* This article is written based on the open workshop REBRAIN & Yandex.Cloud, if you like watching the video, you can find it at this link - https://youtu.be/cZLezUm0ekE
Recently we had the opportunity to feel Yandex.Cloud live. Since we wanted to feel it for a long time and tightly, we immediately abandoned the idea of launching a simple wordpress blog with a cloud base - it's too boring. After some deliberation, we decided to deploy something similar to the production architecture of a service for receiving and analyzing events in near real time mode.
I am absolutely sure that the vast majority of online (and not only) businesses in one way or another collect a mountain of information about their users and their actions. At a minimum, this is necessary for making certain decisions - for example, if you are managing an online game - you can see statistics at what level users are most likely to get stuck and delete your toy. Or why users leave your site without buying anything (hello, Yandex.Metrica).
So, our story: how we wrote an application in golang, tested kafka vs rabbitmq vs yqs, wrote data streaming to a Clickhouse cluster, and visualized data using yandex datalens. Naturally, all of this was spiced with infrastructure delights in the form of docker, terraform, gitlab ci and, of course, prometheus. Let's go!
I would like to make a reservation right away that we cannot configure everything in one sitting - for this we need several articles in the series. A little about the structure:
Part 1 (you are reading it). We will define the technical specification and architecture of the solution, and also write an application in golang.
Part 2. We release our application to production, make it scalable and test the load.
Part 3. Let's try to figure out why we need to store messages in a buffer, and not in files, and also compare kafka, rabbitmq and yandex queue service among themselves.
Part 4. We will deploy the Clickhouse cluster, write streaming to transfer data from the buffer there, set up visualization in datalens.
Part 5. Let's put the entire infrastructure in proper shape - configure ci / cd using gitlab ci, connect monitoring and service discovery using prometheus and consul.
TK
First, we will formulate the terms of reference - what exactly we want to get at the output.
- We want to have an endpoint of the form events.kis.im (kis.im is the test domain that we will use throughout all the articles), which should accept events using HTTPS.
- Events are a simple json of the form: {"event": "view", "os": "linux", "browser": "chrome"}. At the final stage, we will add a little more fields, but this will not play a big role. If you wish, you can switch to protobuf.
- The service should be able to process 10,000 events per second.
- It should be able to scale horizontally by simply adding new instances to our solution. And it will be nice if we can move the front-end to different geolocations to reduce latency for client requests.
- Fault tolerance. The solution must be sufficiently stable and able to survive when any parts fall (up to a certain amount, of course).
Architecture
In general, for this kind of tasks, classical architectures have long been invented that allow you to scale effectively. The figure shows an example of our solution.

So, what we have:
1. On the left are shown our devices that generate various events, whether it be passing the level of players in a toy on a smartphone or creating an order in an online store through a regular browser. The event, as indicated in the TOR, is a simple json that is sent to our endpoint - events.kis.im.
2. The first two servers are simple balancers, their main tasks are:
- . , , keepalived, IP .
- TLS. , TLS . -, , -, , backend .
- backend . — . , , load balancer’ .
3. Behind the balancers, we have application servers running a fairly simple application. It should be able to accept incoming HTTP requests, validate the sent json and store the data into a buffer.
4. The diagram shows kafka as a buffer, although, of course, other similar services can be used at this level. We will compare Kafka, rabbitmq and yqs in the third article.
5. The penultimate point of our architecture is Clickhouse - a columnar database that allows you to store and process a huge amount of data. At this level, we need to transfer data from the buffer to, in fact, the storage system (more on this in article 4).
This arrangement allows us to independently scale each layer horizontally. Backend servers do not cope - let's add more - because they are stateless applications, and therefore, this can be done even in automatic mode. It does not pull a buffer in the form of a kafka - we will add more servers and transfer some of the partitions of our topic to them. The clickhouse fails - it's impossible :) In fact, we'll also drop the servers and share the data.
By the way, if you want to implement the optional part of our technical specification and make scaling in different geolocations, then there is nothing easier:
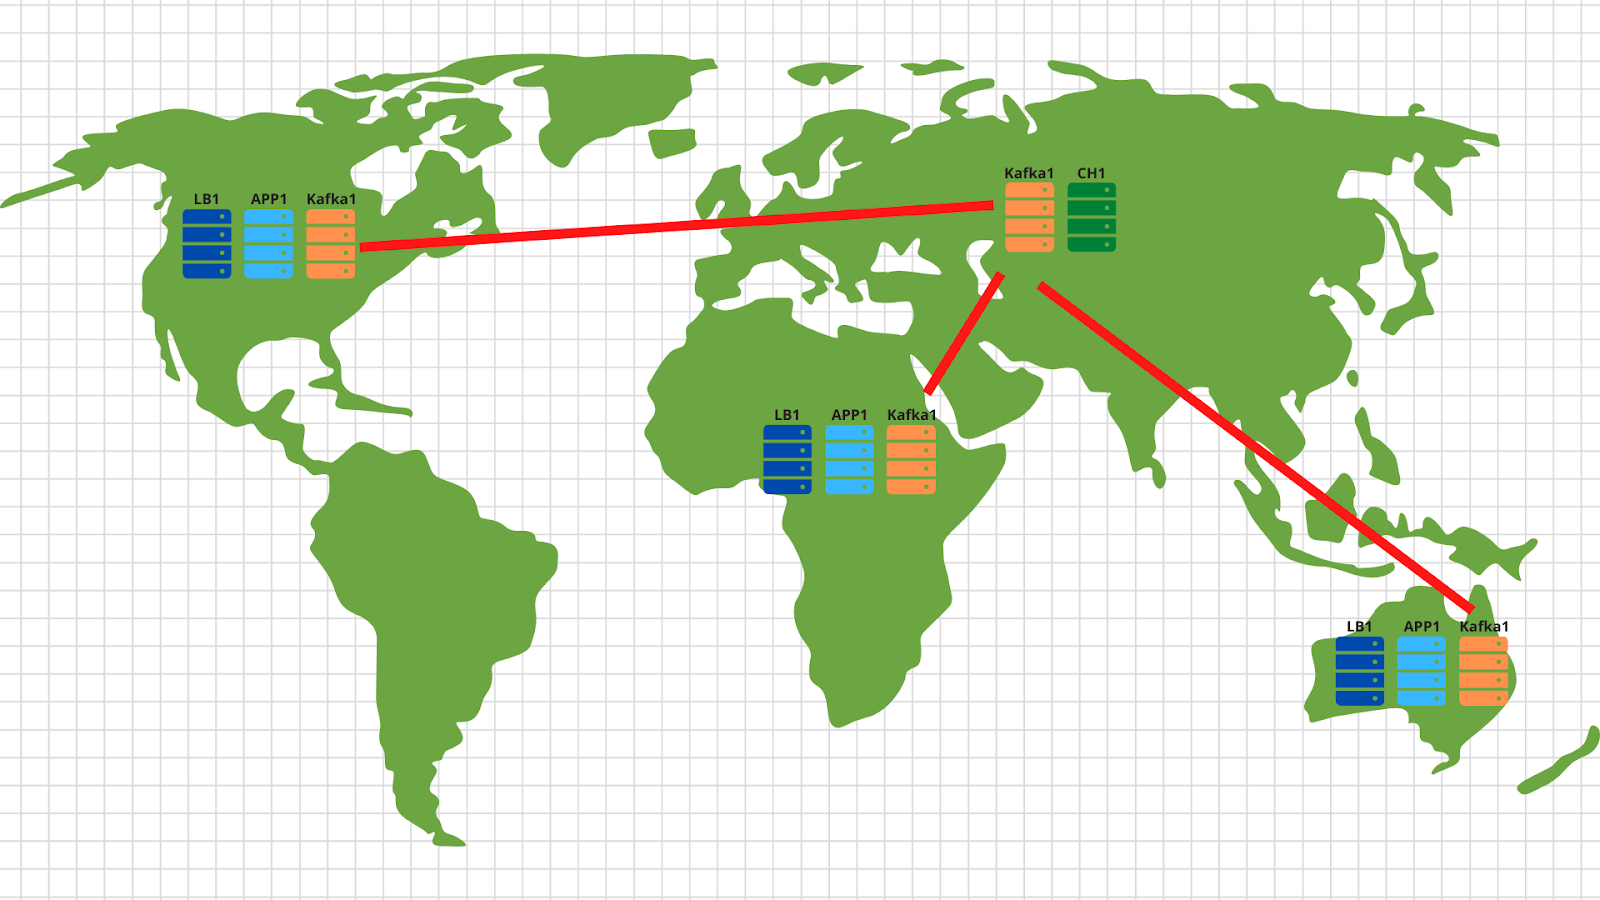
In each geolocation, we deploy a load balancer with application and kafka. In general, 2 application servers, 3 kafka nodes and a cloud balancer, for example, cloudflare, are enough, which will check the availability of application nodes and balance requests by geolocation based on the client's original IP address. Thus, the data sent by the American client will land on the American servers. And data from Africa - on African.
Then everything is quite simple - we use the mirror tool from the kafka set and copy all data from all locations to our central data center located in Russia. Inside, we parse the data and write it to Clickhouse for subsequent visualization.
So, we figured out the architecture - let's start to shake Yandex.Cloud!
Writing an application
Before the Cloud, you still have to endure a little and write a fairly simple service for processing incoming events. We will use golang, because it has proven itself very well as a language for writing network applications.
After spending an hour (maybe a couple of hours), we get something like this: https://github.com/RebrainMe/yandex-cloud-events/blob/master/app/main.go .
What are the main points here I would like to note:
1. When starting the application, you can specify two flags. One is responsible for the port on which we will listen for incoming http requests (-addr). The second one is for the address of the kafka server where we will record our events (-kafka):
addr     = flag.String("addr", ":8080", "TCP address to listen to")
kafka    = flag.String("kafka", "127.0.0.1:9092", "Kafka endpoints”)
2. The application uses the sarama library ( [] github.com/Shopify/sarama ) to send messages to the kafka cluster. We immediately set the settings focused on the maximum processing speed:
config := sarama.NewConfig()
config.Producer.RequiredAcks = sarama.WaitForLocal
config.Producer.Compression = sarama.CompressionSnappy
config.Producer.Return.Successes = true
3. Also, our application has a built-in prometheus client that collects various metrics, such as:
- the number of requests to our application;
- the number of errors when executing the request (it is impossible to read the post request, broken json, it is impossible to write to the kafka);
- processing time of one request from a client, including the time of writing a message to kafka.
4. Three endpoints that our application processes:
- / status - just return ok to show that we are alive. Although you can add some checks, such as the availability of the kafka cluster.
- / metrics - according to this url, the prometheus client will return the metrics it has collected.
- /post — endpoint, POST json . json — -.
I'll make a reservation that the code is not perfect - it can (and should!) Be finished. For example, you can stop using the built-in net / http and switch to faster fasthttp. Or you can gain processing time and cpu resources by taking the json validation check to a later stage - when the data will be transferred from the buffer to the clickhouse cluster.
In addition to the development side of the issue, we immediately thought about our future infrastructure and decided to deploy our application via docker. The final Dockerfile for building the application is https://github.com/RebrainMe/yandex-cloud-events/blob/master/app/Dockerfile . In general, it is quite simple, the only point that I want to draw attention to is the multistage assembly, which allows us to reduce the final image of our container.
First steps in the cloud
First of all, we register at cloud.yandex.ru . After filling in all the required fields, we will create an account and give a grant for a certain amount of money that can be used to test cloud services. If you want to repeat all the steps from our article, this grant should be enough for you.
After registration, a separate cloud and a default directory will be created for you, in which you can start creating cloud resources. In general, in Yandex.Cloud, the relationship of resources looks like this:

You can create several clouds for one account. And inside the cloud, create different directories for different company projects. You can read more about this in the documentation - https://cloud.yandex.ru/docs/resource-manager/concepts/resources-hierarchy... By the way, below in the text I will often refer to it. When I set up the entire infrastructure from scratch, the documentation helped me out more than once, so I advise you to study.
To manage the cloud, you can use both the web interface and the console utility - yc. Installation is performed with one command (for Linux and Mac Os):
curl https://storage.yandexcloud.net/yandexcloud-yc/install.sh | bashIf an internal security guard raged about running scripts from the Internet, then, firstly, you can open the script and read it, and secondly, we run it under our user - without root rights.
If you want to install the client for windows, then you can use the instructions here and then follow
yc initto completely configure it:
vozerov@mba:~ $ yc init
Welcome! This command will take you through the configuration process.
Please go to https://oauth.yandex.ru/authorize?response_type=token&client_id= in order to obtain OAuth token.

Please enter OAuth token:
Please select cloud to use:
 [1] cloud-b1gv67ihgfu3bp (id = b1gv67ihgfu3bpt24o0q)
 [2] fevlake-cloud (id = b1g6bvup3toribomnh30)
Please enter your numeric choice: 2
Your current cloud has been set to 'fevlake-cloud' (id = b1g6bvup3toribomnh30).
Please choose folder to use:
 [1] default (id = b1g5r6h11knotfr8vjp7)
 [2] Create a new folder
Please enter your numeric choice: 1
Your current folder has been set to 'default' (id = b1g5r6h11knotfr8vjp7).
Do you want to configure a default Compute zone? [Y/n]
Which zone do you want to use as a profile default?
 [1] ru-central1-a
 [2] ru-central1-b
 [3] ru-central1-c
 [4] Don't set default zone
Please enter your numeric choice: 1
Your profile default Compute zone has been set to 'ru-central1-a'.
vozerov@mba:~ $
In principle, the process is simple - first you need to get the oauth token for cloud management, select the cloud and the folder that you will use.
If you have several accounts or folders within the same cloud, you can create additional profiles with separate settings via yc config profile create and switch between them.
In addition to the above methods, the Yandex.Cloud team has written a very good terraform plugin for managing cloud resources. For my part, I prepared a git repository, where I described all the resources that will be created within the framework of the article - https://github.com/rebrainme/yandex-cloud-events/ . We are interested in the master branch, let's clone it locally:
vozerov@mba:~ $ git clone https://github.com/rebrainme/yandex-cloud-events/ events
Cloning into 'events'...
remote: Enumerating objects: 100, done.
remote: Counting objects: 100% (100/100), done.
remote: Compressing objects: 100% (68/68), done.
remote: Total 100 (delta 37), reused 89 (delta 26), pack-reused 0
Receiving objects: 100% (100/100), 25.65 KiB | 168.00 KiB/s, done.
Resolving deltas: 100% (37/37), done.
vozerov@mba:~ $ cd events/terraform/
All the main variables used in terraform are written in the main.tf file. To get started, create a private.auto.tfvars file in the terraform folder with the following content:
# Yandex Cloud Oauth token
yc_token = ""
# Yandex Cloud ID
yc_cloud_id = ""
# Yandex Cloud folder ID
yc_folder_id = ""
# Default Yandex Cloud Region
yc_region = "ru-central1-a"
# Cloudflare email
cf_email = ""
# Cloudflare token
cf_token = ""
# Cloudflare zone id
cf_zone_id = ""
All variables can be taken from the yc config list, since we have already configured the console utility. I advise you to immediately add private.auto.tfvars to .gitignore so as not to inadvertently publish private data.
In private.auto.tfvars, we also specified data from Cloudflare - for creating dns records and proxying the main domain events.kis.im to our servers. If you do not want to use cloudflare, then remove the initialization of the cloudflare provider in main.tf and the dns.tf file, which is responsible for creating the necessary dns records.
In our work, we will combine all three methods - the web interface, the console utility, and terraform.
Virtual networks
Honestly, this step could be skipped, because when you create a new cloud, you will automatically have a separate network and 3 subnets - one for each Availability Zone. But still I would like to make a separate network for our project with its own addressing. The general scheme of network operation in Yandex.Cloud is shown in the figure below (honestly taken from https://cloud.yandex.ru/docs/vpc/concepts/ )
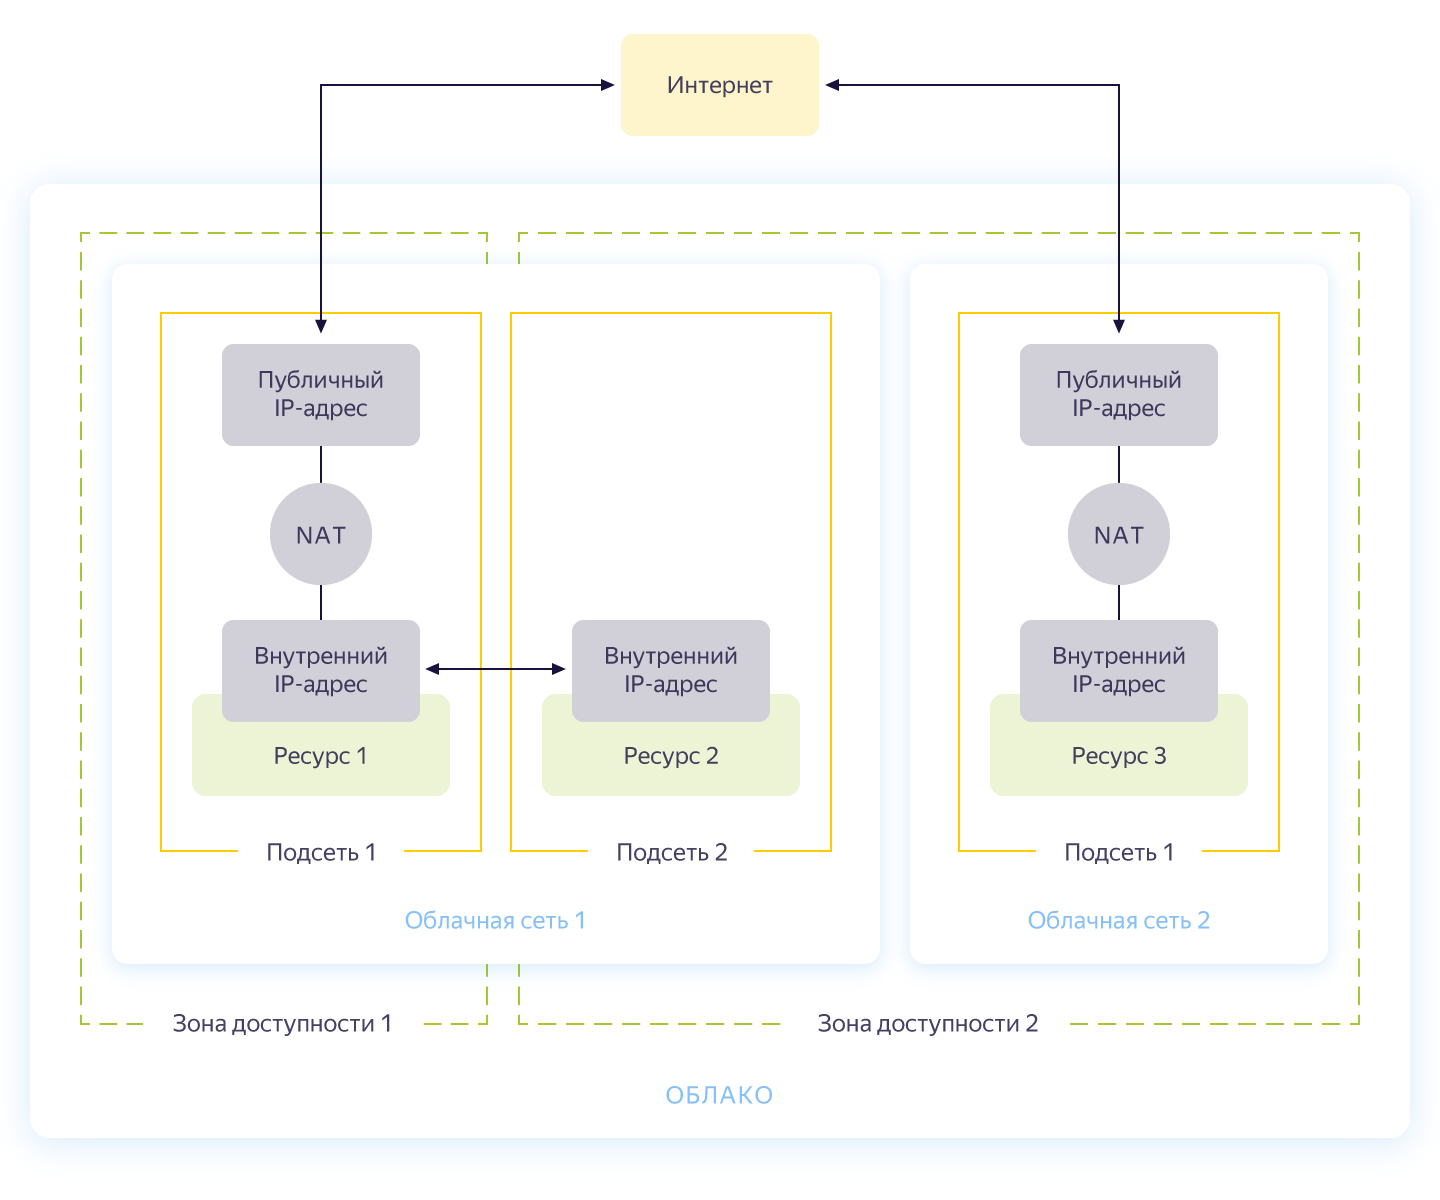
So, you create a common network within which resources can communicate with each other. For each availability zone, a subnet is made with its own addressing and connected to the public network. As a result, all cloud resources in it can communicate, even being in different availability zones. Resources connected to different cloud networks can only see each other through external addresses. By the way, how this magic works inside was well described on Habré .
Network creation is described in the network.tf file from the repository. There we create one common private network internal and connect three subnets to it in different availability zones - internal-a (172.16.1.0/24), internal-b (172.16.2.0/24), internal-c (172.16.3.0/24 ).
We initialize terraform and create networks:
vozerov@mba:~/events/terraform (master) $ terraform init
... skipped ..

vozerov@mba:~/events/terraform (master) $ terraform apply -target yandex_vpc_subnet.internal-a -target yandex_vpc_subnet.internal-b -target yandex_vpc_subnet.internal-c

... skipped ...

Plan: 4 to add, 0 to change, 0 to destroy.

Do you want to perform these actions?
  Terraform will perform the actions described above.
  Only 'yes' will be accepted to approve.

  Enter a value: yes

yandex_vpc_network.internal: Creating...
yandex_vpc_network.internal: Creation complete after 3s [id=enp2g2rhile7gbqlbrkr]
yandex_vpc_subnet.internal-a: Creating...
yandex_vpc_subnet.internal-b: Creating...
yandex_vpc_subnet.internal-c: Creating...
yandex_vpc_subnet.internal-a: Creation complete after 6s [id=e9b1dad6mgoj2v4funog]
yandex_vpc_subnet.internal-b: Creation complete after 7s [id=e2liv5i4amu52p64ac9p]
yandex_vpc_subnet.internal-c: Still creating... [10s elapsed]
yandex_vpc_subnet.internal-c: Creation complete after 10s [id=b0c2qhsj2vranoc9vhcq]

Apply complete! Resources: 4 added, 0 changed, 0 destroyed.
Excellent! We have made our network and are now ready to create our internal services.
Creating virtual machines
To test the application, it will be enough for us to create two virtual machines - we will need the first one to build and run the application, the second - to run kafka, which we will use to store incoming messages. And we will create another machine, where we will configure prometheus to monitor the application.
Virtual machines will be configured using ansible, so before starting terraform, make sure you have one of the latest ansible versions. And install the required roles with ansible galaxy:
vozerov@mba:~/events/terraform (master) $ cd ../ansible/
vozerov@mba:~/events/ansible (master) $ ansible-galaxy install -r requirements.yml
- cloudalchemy-prometheus (master) is already installed, skipping.
- cloudalchemy-grafana (master) is already installed, skipping.
- sansible.kafka (master) is already installed, skipping.
- sansible.zookeeper (master) is already installed, skipping.
- geerlingguy.docker (master) is already installed, skipping.
vozerov@mba:~/events/ansible (master) $
Inside the ansible folder, there is a sample .ansible.cfg config file that I am using. Perhaps useful.
Before creating virtual machines, make sure that you have ssh-agent running and an ssh key added, otherwise terraform will not be able to connect to the created machines. I came across a bug in os x of course: https://github.com/ansible/ansible/issues/32499#issuecomment-341578864 . To avoid repeating this story, add a small variable to the env before starting Terraform:
vozerov@mba:~/events/terraform (master) $ export OBJC_DISABLE_INITIALIZE_FORK_SAFETY=YESCreate the necessary resources in the terraform folder:
vozerov@mba:~/events/terraform (master) $ terraform apply -target yandex_compute_instance.build -target yandex_compute_instance.monitoring -target yandex_compute_instance.kafka
yandex_vpc_network.internal: Refreshing state... [id=enp2g2rhile7gbqlbrkr]
data.yandex_compute_image.ubuntu_image: Refreshing state...
yandex_vpc_subnet.internal-a: Refreshing state... [id=e9b1dad6mgoj2v4funog]

An execution plan has been generated and is shown below.
Resource actions are indicated with the following symbols:
  + create

... skipped ...

Plan: 3 to add, 0 to change, 0 to destroy.

... skipped ...
If everything ended well (and it should be), then we will have three virtual machines:
- build - a machine for testing and building an application. Docker was installed automatically by ansible.
- monitoring - machine for monitoring - prometheus & grafana is installed on it. Login / password is standard: admin / admin
- kafka is a small car with kafka installed, available on port 9092.
Let's make sure that they are all in place:
vozerov@mba:~/events (master) $ yc compute instance list
+----------------------+------------+---------------+---------+---------------+-------------+
|          ID          |    NAME    |    ZONE ID    | STATUS  |  EXTERNAL IP  | INTERNAL IP |
+----------------------+------------+---------------+---------+---------------+-------------+
| fhm081u8bkbqf1pa5kgj | monitoring | ru-central1-a | RUNNING | 84.201.159.71 | 172.16.1.35 |
| fhmf37k03oobgu9jmd7p | kafka      | ru-central1-a | RUNNING | 84.201.173.41 | 172.16.1.31 |
| fhmt9pl1i8sf7ga6flgp | build      | ru-central1-a | RUNNING | 84.201.132.3  | 172.16.1.26 |
+----------------------+------------+---------------+---------+---------------+-------------+
The resources are in place, and from here we can pull their ip-addresses. Everywhere below, I will use ip addresses to connect via ssh and test the application. If you have a cloudflare account connected to terraform, feel free to use the newly created DNS names.
By the way, when creating a virtual machine, an internal ip and an internal DNS name are issued, so you can refer to servers inside the network by names:
ubuntu@build:~$ ping kafka.ru-central1.internal
PING kafka.ru-central1.internal (172.16.1.31) 56(84) bytes of data.
64 bytes from kafka.ru-central1.internal (172.16.1.31): icmp_seq=1 ttl=63 time=1.23 ms
64 bytes from kafka.ru-central1.internal (172.16.1.31): icmp_seq=2 ttl=63 time=0.625 ms
^C
--- kafka.ru-central1.internal ping statistics ---
2 packets transmitted, 2 received, 0% packet loss, time 1001ms
rtt min/avg/max/mdev = 0.625/0.931/1.238/0.308 ms
This will be useful for us to indicate to the application an endpoint with kafk.
Putting together the application
Great, there are servers, there is an application - all that remains is to collect and publish it. For the assembly, we will use the usual docker build, but as a repository of images we will take the service from Yandex - the container registry. But first things first.
Copy the application to the build machine, go to ssh and collect the image:
vozerov@mba:~/events/terraform (master) $ cd ..
vozerov@mba:~/events (master) $ rsync -av app/ ubuntu@84.201.132.3:app/

... skipped ...

sent 3849 bytes  received 70 bytes  7838.00 bytes/sec
total size is 3644  speedup is 0.93

vozerov@mba:~/events (master) $ ssh 84.201.132.3 -l ubuntu
ubuntu@build:~$ cd app
ubuntu@build:~/app$ sudo docker build -t app .
Sending build context to Docker daemon  6.144kB
Step 1/9 : FROM golang:latest AS build
... skipped ...

Successfully built 9760afd8ef65
Successfully tagged app:latest
Half the battle is done - now you can check the functionality of our application by running it and pointing it to kafka:
ubuntu@build:~/app$ sudo docker run --name app -d -p 8080:8080 app /app/app -kafka=kafka.ru-central1.internal:9092</code>

      event    :

<code>vozerov@mba:~/events (master) $ curl -D - -s -X POST -d '{"key1":"data1"}' http://84.201.132.3:8080/post
HTTP/1.1 200 OK
Content-Type: application/json
Date: Mon, 13 Apr 2020 13:53:54 GMT
Content-Length: 41

{"status":"ok","partition":0,"Offset":0}
vozerov@mba:~/events (master) $
The application responded with the success of the recording and indicating the id of the partition and the offset into which the message fell. The only thing to do is to create a registry in Yandex.Cloud and upload our image there (how to do this using three lines is described in the registry.tf file). We create a repository:
vozerov@mba:~/events/terraform (master) $ terraform apply -target yandex_container_registry.events

... skipped ...

Plan: 1 to add, 0 to change, 0 to destroy.

... skipped ...

Apply complete! Resources: 1 added, 0 changed, 0 destroyed.
There are several ways to authenticate in the container registry - using oauth token, iam token, or service account key. For more information about these methods, see the documentation https://cloud.yandex.ru/docs/container-registry/operations/authentication . We will be using the service account key, so we create an account:
vozerov@mba:~/events/terraform (master) $ terraform apply -target yandex_iam_service_account.docker -target yandex_resourcemanager_folder_iam_binding.puller -target yandex_resourcemanager_folder_iam_binding.pusher

... skipped ...

Apply complete! Resources: 3 added, 0 changed, 0 destroyed.
Now it remains to make a key for him:
vozerov@mba:~/events/terraform (master) $ yc iam key create --service-account-name docker -o key.json
id: ajej8a06kdfbehbrh91p
service_account_id: ajep6d38k895srp9osij
created_at: "2020-04-13T14:00:30Z"
key_algorithm: RSA_2048
We get information about the id of our storage, flip the key and log in:
vozerov@mba:~/events/terraform (master) $ scp key.json ubuntu@84.201.132.3:
key.json                                                                                                                    100% 2392   215.1KB/s   00:00

vozerov@mba:~/events/terraform (master) $ ssh 84.201.132.3 -l ubuntu

ubuntu@build:~$ cat key.json | sudo docker login --username json_key --password-stdin cr.yandex
WARNING! Your password will be stored unencrypted in /home/ubuntu/.docker/config.json.
Configure a credential helper to remove this warning. See
https://docs.docker.com/engine/reference/commandline/login/#credentials-store

Login Succeeded
ubuntu@build:~$
To load the image into the registry, we need the ID container registry, we take it from the yc utility:
vozerov@mba:~ $ yc container registry get events
id: crpdgj6c9umdhgaqjfmm
folder_id:
name: events
status: ACTIVE
created_at: "2020-04-13T13:56:41.914Z"
After that, we tag our image with a new name and load:
ubuntu@build:~$ sudo docker tag app cr.yandex/crpdgj6c9umdhgaqjfmm/events:v1
ubuntu@build:~$ sudo docker push cr.yandex/crpdgj6c9umdhgaqjfmm/events:v1
The push refers to repository [cr.yandex/crpdgj6c9umdhgaqjfmm/events]
8c286e154c6e: Pushed
477c318b05cb: Pushed
beee9f30bc1f: Pushed
v1: digest: sha256:1dd5aaa9dbdde2f60d833be0bed1c352724be3ea3158bcac3cdee41d47c5e380 size: 946
We can make sure that the image booted successfully:
vozerov@mba:~/events/terraform (master) $ yc container repository list
+----------------------+-----------------------------+
|          ID          |            NAME             |
+----------------------+-----------------------------+
| crpe8mqtrgmuq07accvn | crpdgj6c9umdhgaqjfmm/events |
+----------------------+-----------------------------+
By the way, if you install the yc utility on a linux machine, you can use the command
yc container registry configure-dockerfor docker setup.
Conclusion
We have done a great and difficult job and as a result:
- .
- golang, -.
- container registry.
In the next part we will move on to the interesting part - we will pour our application into production and finally launch the load on it. Don't switch!
This material is in the video recording of the open workshop REBRAIN & Yandex.Cloud: We accept 10,000 requests per second on Yandex Cloud - https://youtu.be/cZLezUm0ekE
If you are interested in visiting such events online and asking questions in real time, connect to the channel DevOps by REBRAIN .
We would like to say special thanks to Yandex.Cloud for the opportunity to hold such an event. A link to them - https://cloud.yandex.ru/prices
If you need a move to the cloud or have questions about your infrastructure, feel free to leave a request .
P.S. 2 , , .