An all-Russian vote on the approval of amendments to the Constitution of the Russian Federation was held from June 25 to July 1, 2020 (wikipedia) .
The main purpose of this post is to demonstrate how you can quickly start working with voting data and show the presence of a certain type of anomalies in them.
All calculations, visualizations and data parsing are provided in Google Colab, which is available from this Google Colab link .
Link to the second part
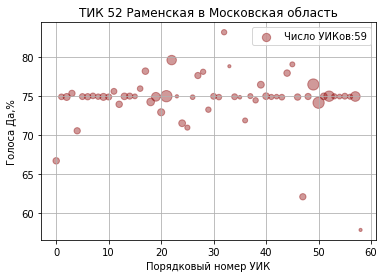
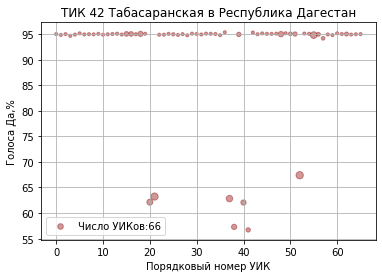
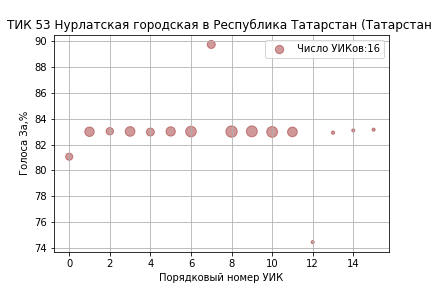
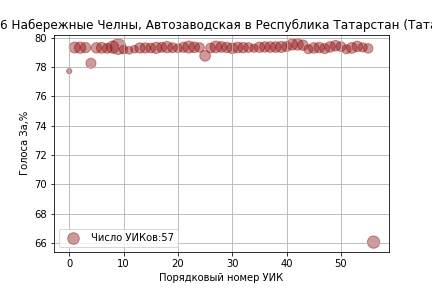
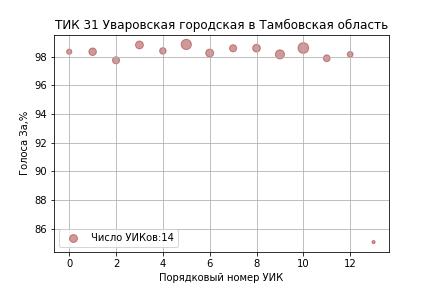
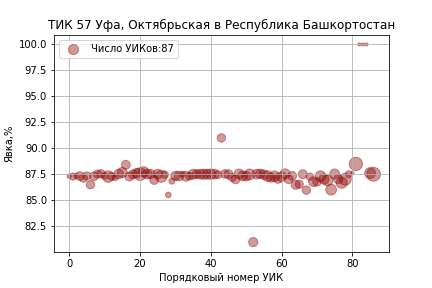
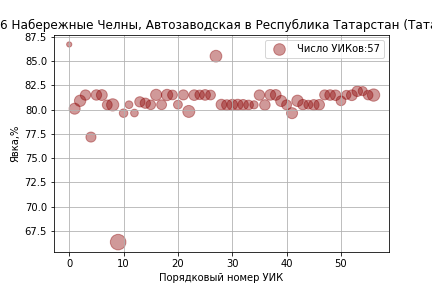
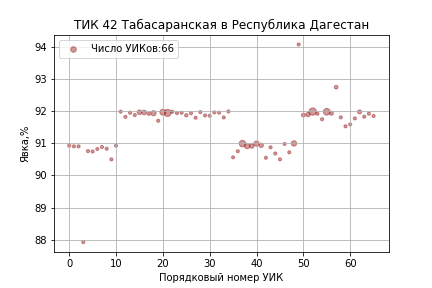
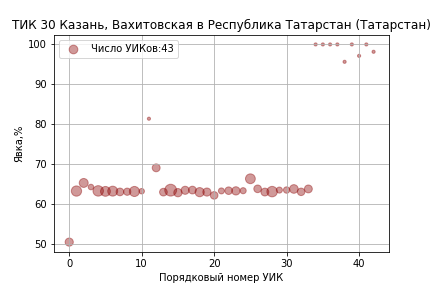
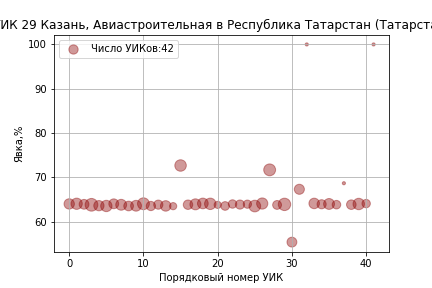
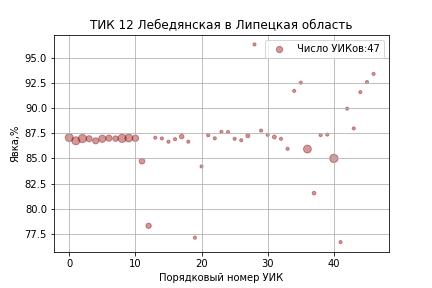
We will focus on identifying cases of zero variance voting, that is, results when all PECs within one TEC vote equally or with minimal variance. These cases have no natural explanation except that the counting of votes was not carried out.
It looks like this (link to CEC pages TEC 52 , TEC 33 , TEC 42 and TEC 19 ):


Further in the text 'For' = 'Yes', 'Against' = 'No'.
Data sources
. . , .
JSON CSV . (no data, no job!). , , Telegram- RUElectionData .
- .
- , 10.00 12.00 15.00 18.00 .
- , .
, .
. () youtube.
18 « » . ( ) 12.00 10.00 3%, 15.00 12.00 5% ( ).

, 91%, — 90% ( ).

Runtime->Run All. 15 .
Google Drive Google account. GoogleCredentials . , . .
.
.
( « »). turnouts_05_Jul_2020_14_56.zip results_06_Jul_2020_19_05.zip RUElectionData.
df2 df1 df:
df= pd.merge(df1, df2.drop(columns=['reg']), how='inner',on=['tik', 'uik'])transliterate:
!pip install transliterate
from transliterate import translit
:
df['turnout_pct']=df['n_ballots_all']/df['n_registered_voters']*100.
df['yes_pct']=df['yes']/df['n_ballots_polling_station']*100.
df['no_pct']=df['no']/df['n_ballots_polling_station']*100.
df['invalid_pct']=df['n_ballots_invalid']/df['n_ballots_polling_station']*100.
:
df_original=df.copy(deep=True). « » «» «». 100%.
df=df[df['turnout_pct']<100.]
ax = df.plot.scatter(x='turnout_pct',y='yes_pct',label=' ()',c='DarkBlue',s=0.001)
ax = df.plot.scatter(x='turnout_pct',y='no_pct',label=' ()',c='DarkRed',s=0.001,ax=ax)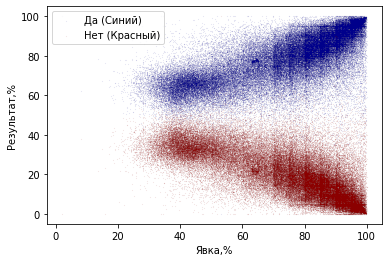
, , «» :
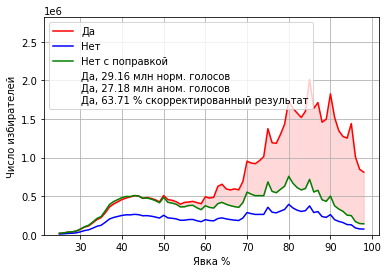
«» :

80%, 85%, 90% 95%.
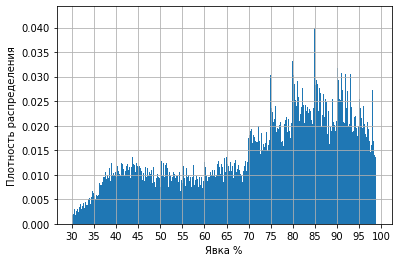
. , , , .
. , ( ) (: A Model Is Only as Good as Its Assumptions).
« » Excel . () wiki:Median absolute deviation.
, «» . , . , 1- 2- . , , url , .
100 ‘’ 153 5570 6 . 5.5 . .
«» . .
. ().
4 , : « ».
« » 50 «»(«»).
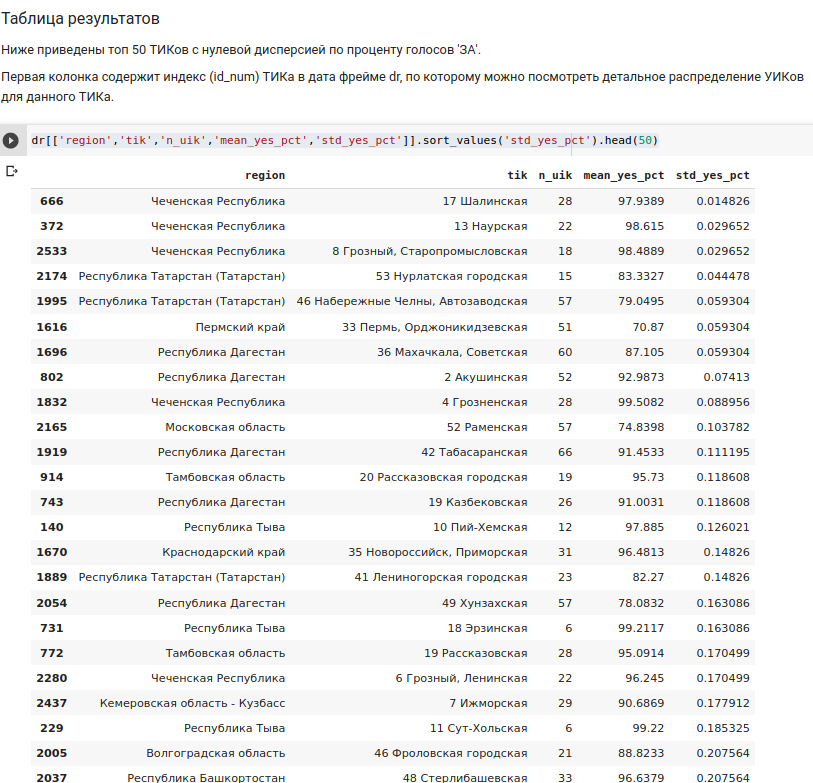
« », . ( ) id_num . id_num 1616, 1995 2165.
id_num=1616 33 ,
( ). :

, «» ( yes_pct) 71.9%. :


, « » «». plot_top_n_results . plot_top_n_results=50 plot_top_n_results=300 .
.
import shutil
from google.colab import files
directory='/content/drive/anomaly/dispersion'
shutil.make_archive(directory, 'zip', directory)
files.download('/content/drive/anomaly/dispersion.zip')
10 . 10 . .
Facebook' .
:
https://elections.dekoder.org/ru/russia/constitution/2020/
https://www.electoral.graphics/ru-ru/
Voter Rights Movement "Golos" https://www.golosinfo.org/ .
Observer associations: https://constitution.observer/
ps Thanks to everyone who read. I hope you were able to check the author's calculations with your own hands, using open source code and data. Special thankstyomitch and Lissov for the witty comments.