
Instead of a preface
The Regional Internet Registrar (RIR), whose field of responsibility extends to Europe, Central Asia and the Middle East, is the RIPE NCC (Réseaux IP Européens Network Coordination Center). The RIPE NCC is a non-profit organization based in the Netherlands. Supports the Internet. Provides IP addresses and autonomous system numbers to local ISPs and large organizations.
One of the RIPE NCC's flagship Internet research projects is the RIPE Atlas (commenced in late 2010), which is an evolution of the Test Traffic Measurement Service, which was discontinued in 2014.
RIPE Atlas is a global network of sensors that actively measure the state of the Internet. There are currently thousands of sensors in the RIPE Atlas network and the number is constantly growing. The RIPE NCC aggregates the collected data and makes it shareware for users in a convenient form.
The development of the network takes place on the principle of voluntary installation of sensors by users in their infrastructure, for which "credits" are issued, which can be spent on taking measurements of interest using other sensors.
Typically RIPE Atlas is used:
- to track the availability of your network from various points on the Internet;
- to investigate and troubleshoot your network with a quick and flexible connection test;
- in the monitoring system of its own network;
- to monitor the availability of the DNS infrastructure;
- verifying IPv6 connectivity.
RIPE Atlas
As already mentioned, RIPE Atlas is a system of sensors that are located on the Internet and are under a single administrative control. In addition to conventional sensors (Probes), there are more advanced ones - anchors (Anchors).
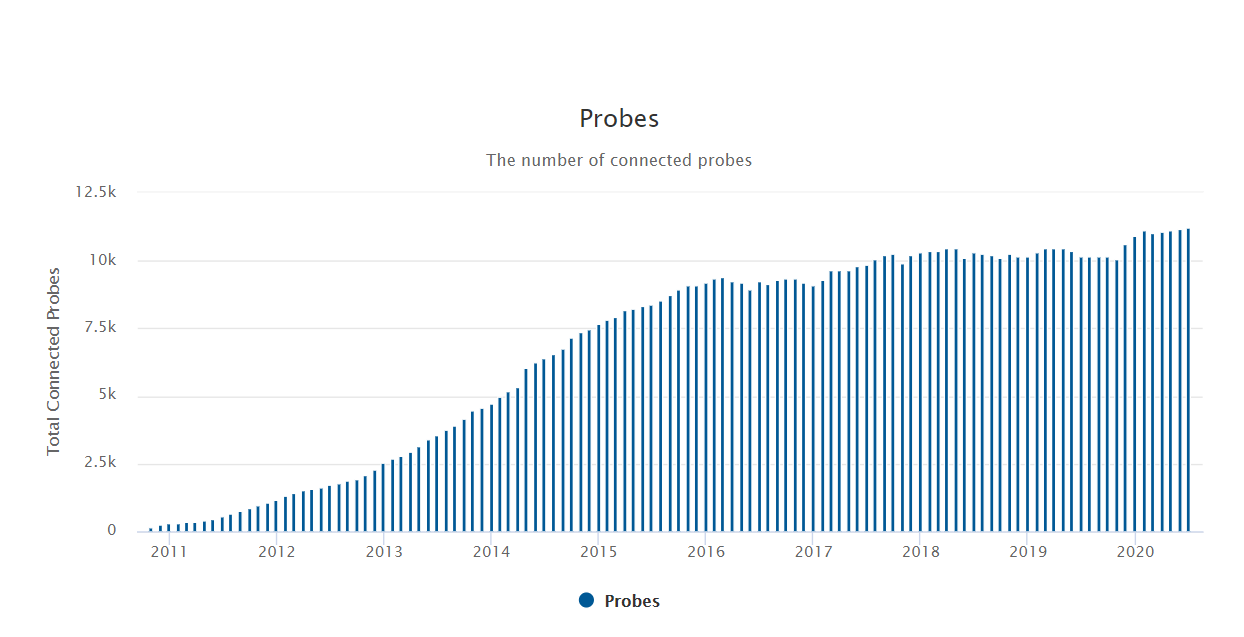
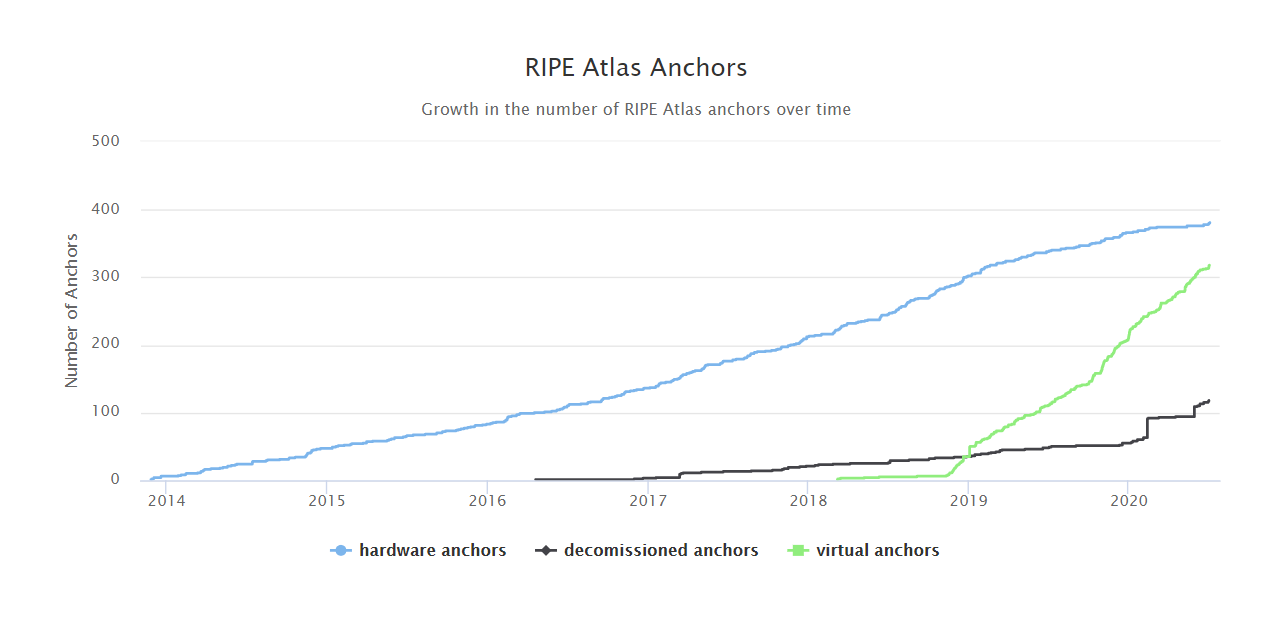
As of mid-2020, the RIPE Atlas system has more than 11,000 active sensors and more than 650 active anchors, which together take over 25,000 measurements and receive more than 10,000 results per second.
The graphs below show the growth in the number of sensors and anchors.
And the following figures show a map of the World showing the location of sensors and anchors, respectively.
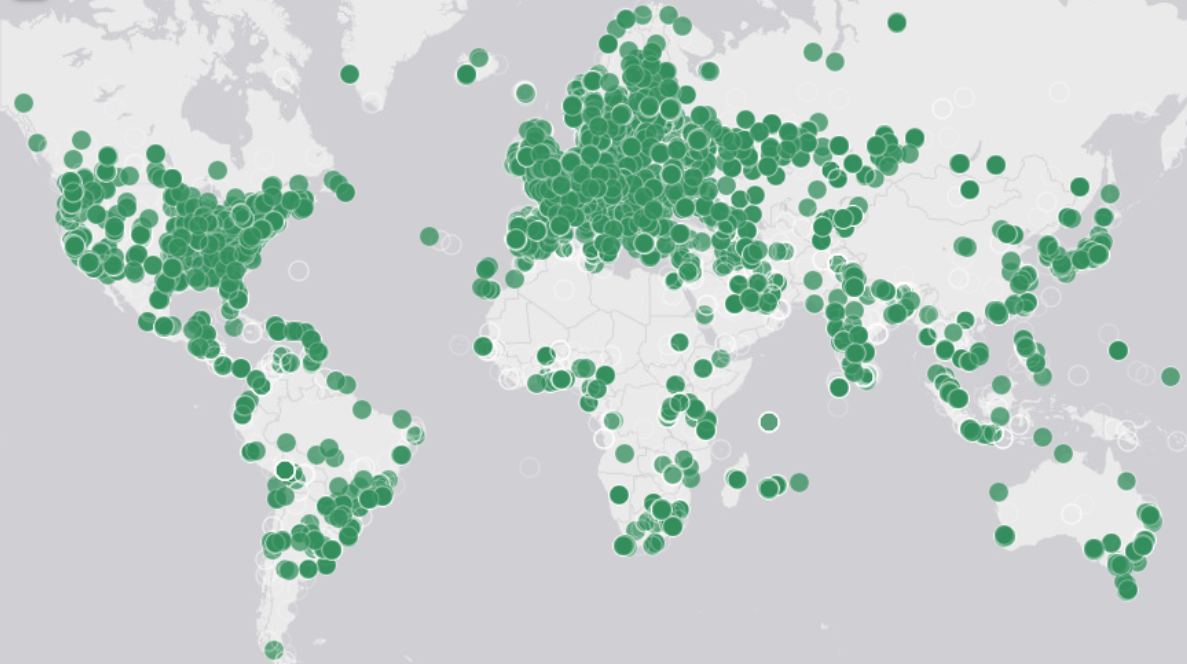
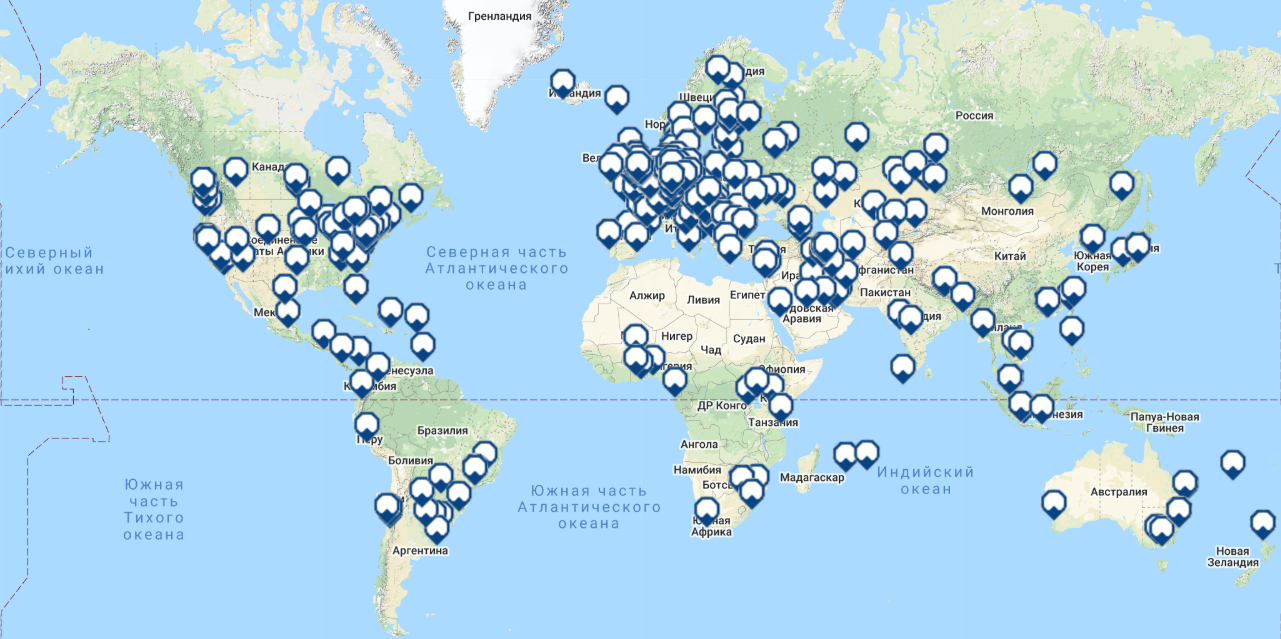
Despite the regional status of the RIPE NCC, the RIPE Atlas network covers almost the entire world, while Russia is in the top 5 in terms of the number of installed sensors (568), along with Germany (1562), the USA (1440), France (925) and the UK ( 610).
Control servers
When studying the operation of the sensor, it was found that it periodically (every 4 minutes) checks connectivity with some objects on the network, including root DNS servers and nodes, with domain names like "ctr-sin02.atlas.ripe.net", I suppose , which are the management servers of the RIPE Atlas network.
I did not find information on the control servers on the official website, but it can be assumed that their tasks include managing sensors, as well as aggregating and processing data. If my guess is correct, then there are at least 6 control servers, of which are located in the USA - 2, the Netherlands - 2, Germany - 1, Singapore - 1. Port 443 is open on all servers.
If someone has more information about the managers servers of the RIPE Atlas network - please clarify this issue.
20.08.2020. , RIPE Atlas , ( ) , , , ..
«ctr-sin02.atlas.ripe.net» .
RIPE Atlas «The Internet Protocol Journal», Volume 18, Number 3, P. 2-26.
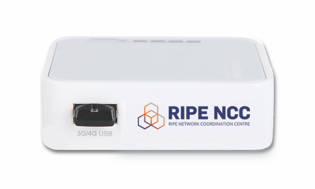
The RIPE Atlas sensor is a small device (TP-Link 3020) that is USB powered and connected to the Ethernet port of the router using a network cable. Depending on the model, the sensor can have Atheros AR9331 chipset, 400 MHz, 4 MB flash and 32 MB RAM, or MediaNek MT7628NN chipset, 575 MHz, 8 MB flash and 64 MB RAM.
Anchor
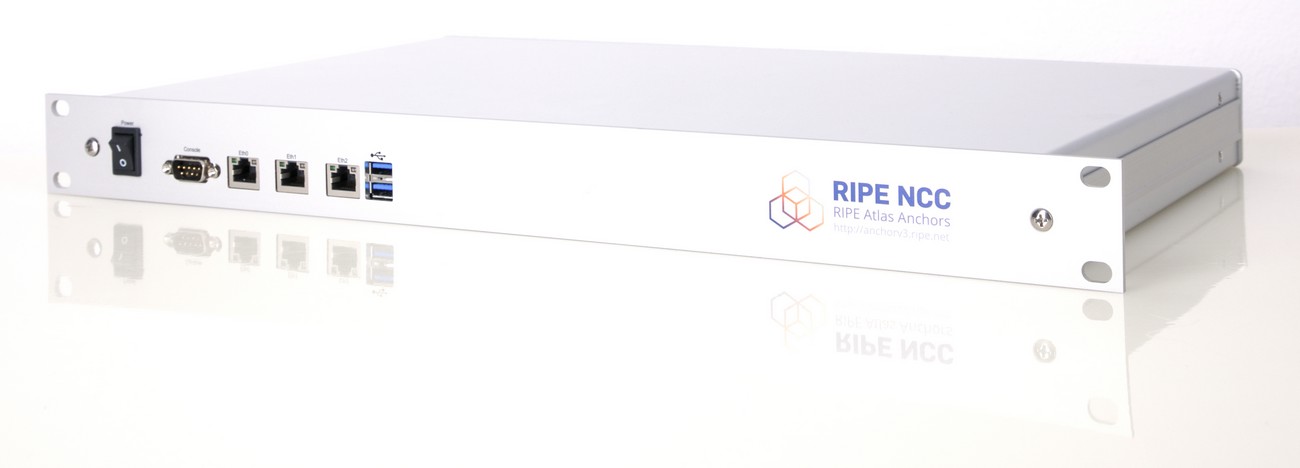
The armature is an improved sensor with much greater performance and measurement capability. It is a device in a standard 19-inch version on the APU2C2 or APU2E2 hardware platform with a 4-core 1 GHz processor, 2 GB of RAM, 3 Gigabit Ethernet ports and a 250 GB SSD-drive. The cost of the anchor is about $ 400 .
Installing and managing the sensor
As already mentioned, sensors are distributed free of charge in order to install them in your infrastructure. When requesting a sensor, the country, city and number of the autonomous system where it will be located are indicated. In response to my request, the RIPE NCC sent this message.
Sorry, your application does not meet our criteria for a hardware sensor at this time. While our goal is to distribute RIPE Atlas sensors as widely as possible, it looks like there are already enough devices connected either within the ASN you specified, in the network you applied to, or in the country in which you applied. application.
No problem. In this case, you can install a software sensor, for example, on a virtual machine, home server or router - there are no restrictions on location and autonomous system. CentOS, Debian, Raspbian and Turris OS are supported. For deployment, you need to download and install the appropriate software, for example, from the repository on GitHub .
Installing a software sensor is straightforward. For example, to install on CentOS 8, you need to run the commands:
curl -O 'https://ftp.ripe.net/ripe/atlas/software-probe/centos8/noarch/ripe-atlas-repo-1-2.el8.noarch.rpm'yum install ripe-atlas-repo-1-2.el8.noarch.rpmand register the sensor, while you must provide the SSH key that is located in
/var/atlas-probe/etc/probe_key.pub, as well as indicate the autonomous system number and your city. The letter recalled the need to correctly indicate the location of the sensor.
Sensor management is limited by the ability to share the measurement resource with other users, set up notifications about downtime, and also by standard network settings (address, default gateway, etc.).
Measurements
Finally we got to the measurements. Setting up tasks for taking measurements is made from your personal account. You can also refer to the results there.
Formation of a measurement task consists of three steps: selection of a measurement type, selection of a sensor, selection of a measurement period.
Measurements can be of the following types: ping, traceroute, DNS, SSL, HTTP, NTP. Detailed settings for a specific type of measurement, excluding specific ones caused by a specific protocol or utility, include: target address, network layer protocol, the number of packets in the measurement and the time between measurements, packet size and time between packets, the degree of random offset of the start time of sending packets.
The choice of sensors is possible by their identifier or country of location, region, autonomous system, tag, etc.
The measurement period is set by the start and end times.
The measurement results are available on the website in your personal account, which can also be obtained in json format. In general, measurement results are quantitative indicators that characterize the availability of a particular site or service.
For the user, the measurement capabilities are presented by a wide, but very limited spectrum. However, it is obvious that the capabilities of the system imply the generation of packets of almost any configuration, which opens up much wider possibilities for measuring the state of the Internet.
Below is an example of raw single measurements with default settings. In measurements such as ping, traceroute and SSL, the target was the IP address habr.com, DNS - the IP address of the Google DNS server, NTP - the IP address of the NTP server ntp1.stratum2.ru. All measurements used one sensor located in Vladivostok.
Ping
[{"fw":4790,"lts":18,"dst_name":"178.248.237.68","af":4,"dst_addr":"178.248.237.68","src_addr":"192.168.0.10","proto":"ICMP","ttl":55,"size":48,"result":[{"rtt":122.062873},{"rtt":121.775641},{"rtt":121.807897}],"dup":0,"rcvd":3,"sent":3,"min":121.775641,"max":122.062873,"avg":121.882137,"msm_id":26273241,"prb_id":4428,"timestamp":1594622562,"msm_name":"Ping","from":"5.100.99.178","type":"ping","group_id":26273241,"step":null,"stored_timestamp":1594622562}]Traceroute
[{"fw":4790,"lts":19,"endtime":1594622643,"dst_name":"178.248.237.68","dst_addr":"178.248.237.68","src_addr":"192.168.0.10","proto":"ICMP","af":4,"size":48,"paris_id":1,"result":[{"hop":1,"result":[{"from":"192.168.0.1","ttl":64,"size":76,"rtt":7.49},{"from":"192.168.0.1","ttl":64,"size":76,"rtt":1.216},{"from":"192.168.0.1","ttl":64,"size":76,"rtt":1.169}]},{"hop":2,"result":[{"from":"5.100.98.1","ttl":254,"size":28,"rtt":1.719},{"from":"5.100.98.1","ttl":254,"size":28,"rtt":1.507},{"from":"5.100.98.1","ttl":254,"size":28,"rtt":1.48}]},---DATA OMITED---,{"hop":10,"result":[{"from":"178.248.237.68","ttl":55,"size":48,"rtt":121.891},{"from":"178.248.237.68","ttl":55,"size":48,"rtt":121.873},{"from":"178.248.237.68","ttl":55,"size":48,"rtt":121.923}]}],"msm_id":26273246,"prb_id":4428,"timestamp":1594622637,"msm_name":"Traceroute","from":"5.100.99.178","type":"traceroute","group_id":26273246,"stored_timestamp":1594622649}]DNS
[{"fw":4790,"lts":146,"dst_addr":"8.8.8.8","af":4,"src_addr":"192.168.0.10","proto":"UDP","result":{"rt":174.552,"size":42,"abuf":"5BGAgAABAAEAAAAABGhhYnIDY29tAAABAAHADAABAAEAAAcmAASy+O1E","ID":58385,"ANCOUNT":1,"QDCOUNT":1,"NSCOUNT":0,"ARCOUNT":0},"msm_id":26289620,"prb_id":4428,"timestamp":1594747880,"msm_name":"Tdig","from":"5.100.99.178","type":"dns","group_id":26289620,"stored_timestamp":1594747883}]SSL
[{"fw":4790,"lts":63,"dst_name":"178.248.237.68","dst_port":"443","method":"TLS","ver":"1.2","dst_addr":"178.248.237.68","af":4,"src_addr":"192.168.0.10","ttc":106.920213,"rt":219.948332,"cert":["-----BEGIN CERTIFICATE-----\nMIIGJzCCBQ+gAwIBAg ---DATA OMITED--- yd/teRCBaho1+V\n-----END CERTIFICATE-----"],"msm_id":26289611,"prb_id":4428,"timestamp":1594747349,"msm_name":"SSLCert","from":"5.100.99.178","type":"sslcert","group_id":26289611,"stored_timestamp":1594747352}]NTP
[{"fw":4790,"lts":72,"dst_name":"88.147.254.230","dst_addr":"88.147.254.230","src_addr":"192.168.0.10","proto":"UDP","af":4,"li":"no","version":4,"mode":"server","stratum":2,"poll":8,"precision":0.0000076294,"root-delay":0.000518799,"root-dispersion":0.0203094,"ref-id":"5893fee5","ref-ts":3803732581.5476198196,"result":[{"origin-ts":3803733082.3982748985,"receive-ts":3803733082.6698465347,"transmit-ts":3803733082.6698560715,"final-ts":3803733082.5099263191,"rtt":0.111643,"offset":-0.21575},{"origin-ts":3803733082.5133042336,"receive-ts":3803733082.7847337723,"transmit-ts":3803733082.7847442627,"final-ts":3803733082.6246700287,"rtt":0.111355,"offset":-0.215752},{"origin-ts":3803733082.6279149055,"receive-ts":3803733082.899283886,"transmit-ts":3803733082.8992962837,"final-ts":3803733082.7392635345,"rtt":0.111337,"offset":-0.2157}],"msm_id":26289266,"prb_id":4428,"timestamp":1594744282,"msm_name":"Ntp","from":"5.100.99.178","type":"ntp","group_id":26289266,"stored_timestamp":1594744289}]Conclusion
The RIPE Atlas network is a convenient tool for near-real-time monitoring of the availability of facilities and services on the Internet.
The data generated by the RIPE Atlas network can be useful to telecom operators, researchers, the technical community, and anyone interested in the healthy functioning of the Internet and wants to learn more about the basic network structures and data flows that support the Internet on a global scale.
PS RIPE Atlas is not alone in its kind, there are analogues, for example this one .