Hello! It is difficult to find a microcontroller programmer who has never faced a severe failure. Very often it is not processed in any way, but simply remains hanging in an endless loop of the handler provided in the manufacturer's startup file. At the same time, the programmer tries to intuitively find the reason for the failure. In my opinion, this is not the best way to solve the problem.
In this article, I want to describe a technique for analyzing severe failures of popular microcontrollers with a Cortex M3 / M4 core. Although, perhaps, "technique" is too loud a word. Rather, I'll just take an example of how I analyze the occurrence of severe failures and show what can be done in a similar situation. I will be using IAR software and the STM32F4DISCOVERY debug board, as many aspiring programmers have these tools. However, this is completely irrelevant, this example can be adapted for any processor of the family and any development environment.

Fall into HardFault
Before you try to analyze HatdFault, you need to get into it. There are many ways to do this. It immediately occurred to me to try to switch the processor from the Thumb state to the ARM state by setting the address of the unconditional jump instruction to an even number.
A small digression. As you know, microcontrollers of the Cortex M3 / M4 family use the Thumb-2 assembly instruction set and always work in Thumb mode. ARM mode is not supported. If you try to set the value of the unconditional jump address (BX reg) with the least significant bit cleared, the UsageFault exception will occur, since the processor will try to switch its state to ARM. You can read more about this in [1] (clauses 2.8 THE INSTRUCTION SET; 4.3.4 Assembler Language: Call and Unconditional Branch).
To begin with, I propose to simulate an unconditional jump to an even address in C / C ++. To do this, I will create the func_hard_fault function, then I will try to call it by pointer, after decreasing the pointer address by one. This can be done as follows:
void func_hard_fault(void);

void main(void)
{
  void (*ptr_hard_fault_func) (void); //
  ptr_hard_fault_func = reinterpret_cast<void(*)()>(reinterpret_cast<uint8_t *>(func_hard_fault) - 1); //
  ptr_hard_fault_func(); //

  while(1) continue;
}

void func_hard_fault(void) //,
{
  while(1) continue;
}
Let's see with the debugger what I did.

In red, I highlighted the current jump instruction at the address in RON R1, which contains an even jump address. As a result:

This operation can be performed even more simply using assembler inserts:
void main(void)
{
  //
  asm("LDR R1, =0x0800029A"); //-    f
  asm("BX r1"); //   R1

  while(1) continue;
}
Hooray, we got to HardFault, mission accomplished!
HardFault Analysis
Where did we get to HardFault?
In my opinion, the most important thing is to find out where we got to HardFault from. This is not difficult to do. First, let's write our own handler for the HardFault situation.
extern "C"
{
void HardFault_Handler(void)
{

}
}
Now let's talk about how to figure out how we got here. The Cortex M3 / M4 processor core has such a wonderful thing as context preservation [1] (clause 9.1.1 Stacking). In simple terms, when any exception occurs, the contents of the R0-R3, R12, LR, PC, PSR registers are stored on the stack.

Here the most important register for us will be the PC register, which contains information about the currently executing instruction. Since the register value was pushed onto the stack at the time of the exception, it will contain the address of the last instruction executed. The rest of the registers are less important for analysis, but something useful can be snatched from them. LR is the return address of the last transition, R0-R3, R12 are values that can tell in which direction to move, PSR is just a general register of program status.
I propose to find out the values of the registers in the handler. To do this, I wrote the following code (I saw a similar code in one of the manufacturer's files):
extern "C"
{
void HardFault_Handler(void)
{
  struct
  {
    uint32_t r0;
    uint32_t r1;
    uint32_t r2;
    uint32_t r3;
    uint32_t r12;
    uint32_t lr;
    uint32_t pc;
    uint32_t psr;
  }*stack_ptr; //    (SP)


  asm(
      "TST lr, #4 \n" // 3   ( )
      "ITE EQ \n"   //     3?
      "MRSEQ %[ptr], MSP  \n"  //,
      "MRSNE %[ptr], PSP  \n"  //,
      : [ptr] "=r" (stack_ptr)
      );

  while(1) continue;
}
}
As a result, we have the values of all saved registers:
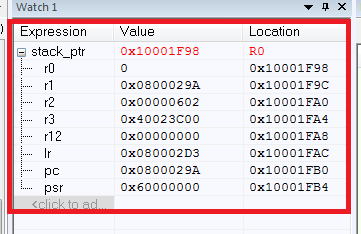
What happened here? First, we got the stack pointer stack_ptr, everything is clear here. Difficulties arise with the assembler insertion (if there is a need to understand the assembly instructions for Cortex, then I recommend [2]).
Why didn't we just save the stack via MRS stack_ptr, MSP? The fact is that the Cortex M3 / M4 cores have two stack pointers [1] (item 3.1.3 Stack Pointer R13) - the main MSP stack pointer and the PSP process stack pointer. They are used for different processor modes. I will not go deep into what this is done for and how it works, but I will give a little explanation.
To find out the processor operating mode (used in this MSP or PSP), you need to check the third bit of the communication register. This bit determines which stack pointer is used to return from an exception. If this bit is set, then it is MSP, if not, then PSP. In general, most applications written in C / C ++ use only MSPs, and this check can be omitted.
So what's the bottom line? Having a list of saved registers, we can easily determine where the program fell from in HardFault from the PC register. The PC points to the address 0x0800029A, which is the address of our "breaking" instruction. Also, don't forget about the importance of the values of the other registers.
Cause of HardFault
In fact, we can also figure out the cause of the HardFault. Two registers will help us with this. Hard fault status register (HFSR) and Configurable fault status register (CFSR; UFSR + BFSR + MMFSR). The CFSR register consists of three registers: Usage fault status register (UFSR), Bus fault status register (BFSR), Memory management fault address register (MMFSR). You can read about them, for example, in [1] and [3].
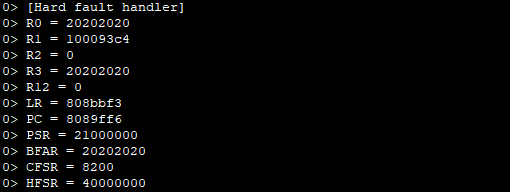
I propose to see what these registers produce in my case:

First, the HFSR FORCED bit is set. This means that a failure has occurred that cannot be processed. For further diagnostics, the remaining fault status registers should be examined.
Second, the CFSR INVSTATE bit is set. This means that a UsageFault has occurred because the processor tried to execute an instruction that illegally uses EPSR.
What is EPSR? EPSR - Execution program status register. This is an internal PSR register - a special program status register (which, as we recall, is stored on the stack). The twenty-fourth bit of this register indicates the current state of the processor (Thumb or ARM). This can determine our reason for the failure. Let's try to count it:
volatile uint32_t EPSR = 0xFFFFFFFF;

  asm(
    "MRS %[epsr], PSP  \n"
    : [epsr] "=r" (EPSR)
      );
As a result of execution, we get the value EPSR = 0.

It turns out that the register shows the status of ARM and we found the cause of the failure? Not really. Indeed, according to [3] (p. 23), reading this register using a special MSR command always returns zero. It is not very clear to me why it works this way, because this register is already read-only, but here it cannot be read completely (only some bits can be used via xPSR). Perhaps these are some architectural limitations.
As a result, unfortunately, all this information gives practically nothing to an ordinary MK programmer. That is why I consider all these registers only as an addition to the analysis of the stored context.
However, for example, if the failure was caused by division by zero (this failure is allowed by setting the DIV_0_TRP bit of the CCR register), then the DIVBYZERO bit will be set in the CFSR register, which will indicate to us the reason for this very failure.
What's next?
What can be done after we have analyzed the cause of the failure? The following procedure seems to be a good option:
- Print the values of all analyzed registers to the debug console (printf). This can only be done if you have a JTAG debugger.
- Save failure information to internal or external (if available) flash. It is also possible to display the value of the PC register on the device screen (if available).
- Reload processor NVIC_SystemReset ().
Sources
- Joseph Yiu. The definitive guide to the ARM Cortex-M3.
- Cortex-M3 Devices Generic User Guide.
- STM32 Cortex-M4 MCUs and MPUs programming manual.