In this area, programmers have some advantages over other people, since programmers can independently create devices for a smart home.

We have available components at our disposal that allow us to quickly build a wide variety of devices. Here I want to talk about how, using a Raspberry Pi, an LCD display and a few lines of code, organize weather monitoring. Our system will be connected to the Internet, so it will allow you to monitor the weather anywhere on Earth.
Prerequisites
I want to show right away what I got.

Weather Monitoring System in Action
Since this is a DIY project, you need to get a few things before you can reproduce it. Namely, we are talking about the following:
- Raspberry Pi 3 (or higher).
- LCD display.
- Connecting wires.
- Variable resistor (optional).
- Breadboard (optional).
Now let's talk about how to put it all together and set it up.
Step 1. Preparing to work with the ClimaCell API and connecting the display to the board
The first step in our work is to obtain a key to access the ClimaCell API and connect the display to the board.
Here we will use the ClimaCell Weather API as a source of weather data . This API provides access to a variety of metrics, including air quality metrics.
To work with the ClimaCell API, you need to create an account on the project website and get an API key that will be used to sign requests to the system.
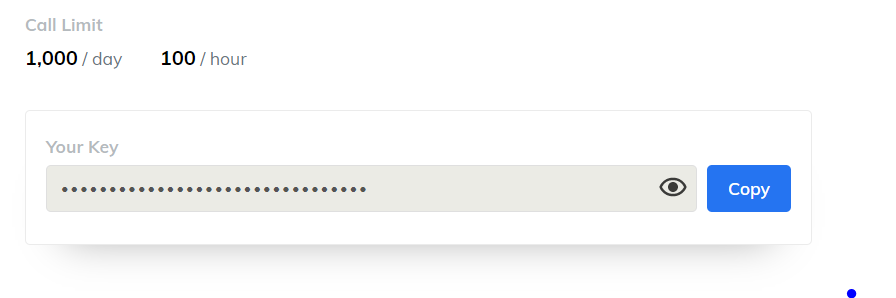
ClimaCell API limits
Registration in the system is free, you can make up to 100 requests per hour, the number of requests that can be performed daily is limited to 1000. This is more than enough for our project.
Once we have the API key at our disposal, we can move on to working with the hardware components and start connecting the LCD display to the Raspberry Pi. Turn off the power before connecting the display to the board.
The layout of the GPIO ports on the Raspberry Pi 3 is shown in the following figure.

Raspberry Pi 3 GPIO Port
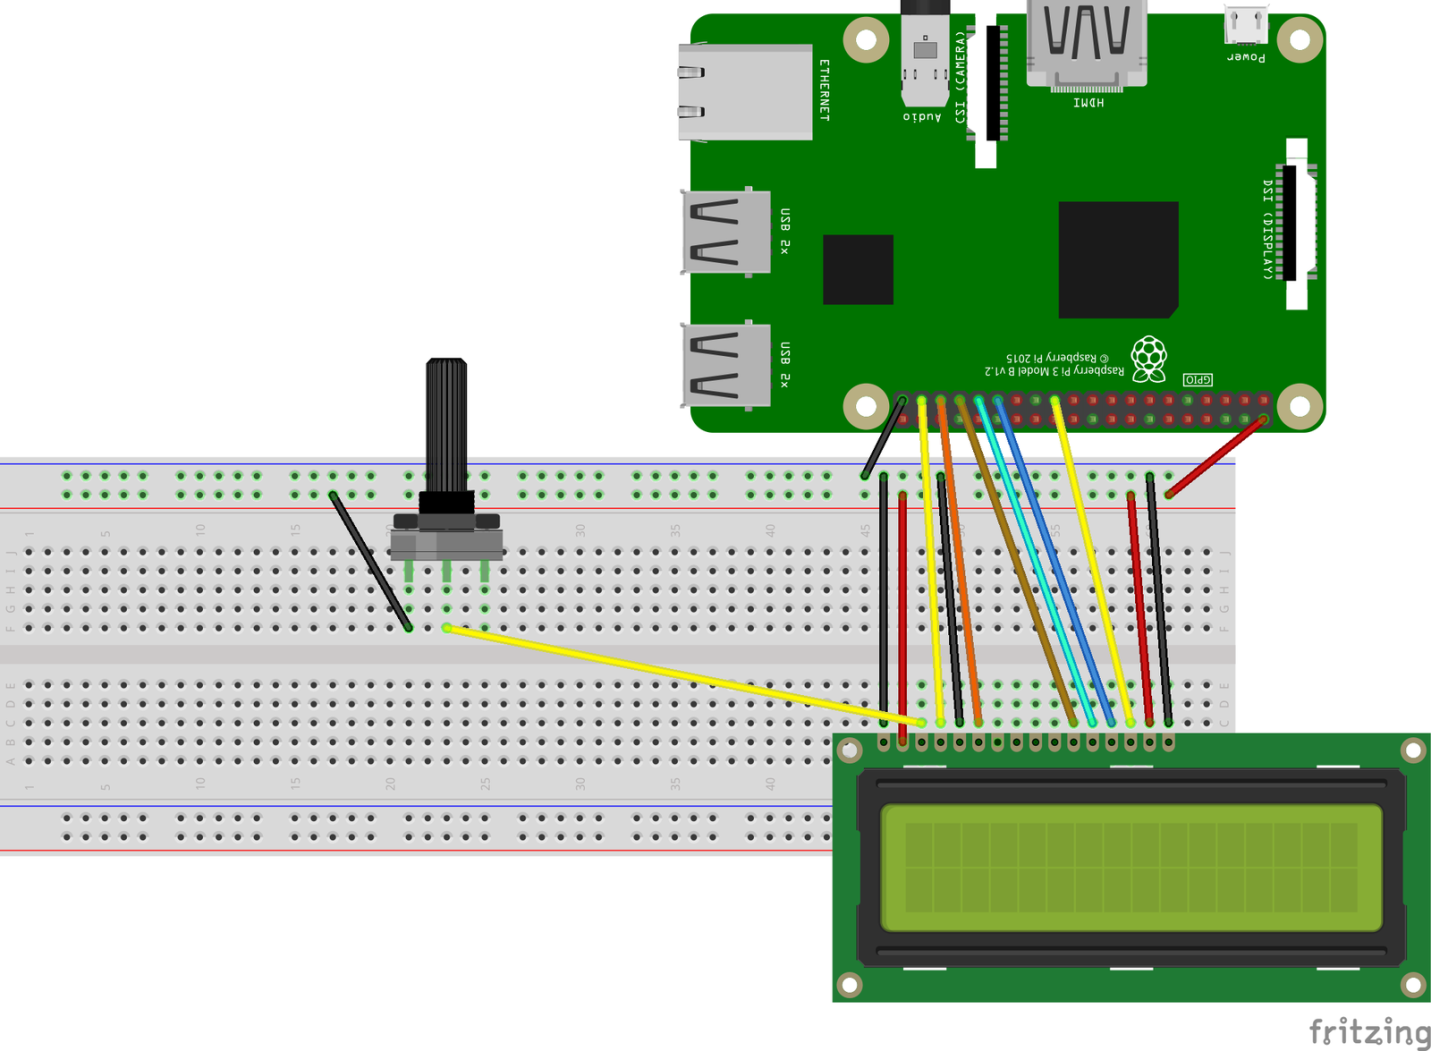
Diagram Here is a diagram for connecting the display to the board.

Diagram of connecting the display to the board
With this connection, the display will work at full brightness and in full contrast. The brightness level is not a problem, but the contrast needs additional adjustment, otherwise you will not be able to make out anything on the screen.
That is why we need at least one variable resistor with which we will adjust the contrast level of the display.
Variable resistor wiring diagram
After the display is connected to the board, we can turn on the Raspberry Pi. If everything is connected correctly, the display will turn on. And with the help of a variable resistor, we can adjust the level of its contrast.
Step 2. Preparing the Node.js project
The software part of our project will be based on Node.js . If your Raspberry Pi doesn't have this platform installed yet, check out this simple guide.
Create a new folder and run the command in it
npm init -yto initialize a new Node.js project. Then run the command npm install lcd node-fetchto install the two dependencies we need.
- The package
lcdwill be used to organize work with the LCD-display. node-fetchWe need the package in order to make HTTP requests to the ClimaCell API.
It was said above that we need an API key to interact with the ClimaCell API. This key can be placed either in the program code, or in a special file
config.jsondesigned to store project settings.
In the case of using,
config.jsonwe are talking about adding the following to it:
{ "cc_key": "<your_ClimaCell_API_key>"}
Now, completing the stage of preliminary preparation of the Node.js project, let's add the following code to its main file:
// *
const Lcd = require("lcd");
const fs = require("fs");
const fetch = require("node-fetch");

// *
const { cc_key } = JSON.parse(fs.readFileSync("./config.json"));
Step 3. Working with the LCD display
Outputting data to an LCD display using a package
lcdis an elementary task. The package is a layer of abstraction above the low-level display engines. The use of such a package saves us from having to solve a lot of small tasks when displaying data on the display.
Here is the code that is responsible for working with the display.
const lcd = new Lcd({ rs: 26, e: 19, data: [13, 6, 5, 11], cols: 16, rows: 2 });

function writeToLcd(col, row, data) {
  return new Promise((resolve, reject) => {
    lcd.setCursor(col, row);
    lcd.print(data, (err) => {
      if (err) {
        reject();
      }
      resolve();
    });
  });
}
First, we create an object
lcdby passing an object with parameters to the appropriate constructor, containing, among other things, information about the pins used to connect the display to the board.
Properties of the object with parameters
colsand rowsspecify the number of columns and rows of the display. It uses a 16x2 display. If you are using another display, for example, one with 8 columns and 1 row, replace the numbers 16 and 2, respectively, with 8 and 1.
In order to display something on the display, you need to use the following object methods in sequence
lcd:
lcd.setCursor()- selection of the position from which the data will be displayed.lcd.print()- data output.
We put calls to these functions in a promise so that we would be able to call the corresponding operations asynchronously using the async / await construct.
By now, you should be able to display something on the display. For example, executing the command
writeToLcd(0,0,'Hello World')should result in the display, on the first line, starting with the first column, of text Hello World.
Step 4: Downloading Weather Information and Displaying It
Let's start downloading the weather information and displaying it on the display.
The ClimaCell platform provides us with many weather indicators and, in addition, information about the quality of the air, information about the level of pollen in the air, about the level of risk from traffic, about fires. We have a lot of data, but we must not forget that our display has only 16 columns and 2 lines, that is, 32 characters.
If you need to display a lot of data on such a display, and this limitation seems too strong, you can use the scrolling effect.
Scroll effect
Here, in order not to complicate the project, we restrict ourselves to displaying the following data on the screen:
- Current date (hour, minute, second).
- Temperature.
- Precipitation intensity.
Here is the code that is responsible for loading the data and displaying it:
function getWeatherData(apiKey, lat, lon) {
  const url = `https://api.climacell.co/v3/weather/realtime?lat=${lat}&lon=${lon}&unit_system=si&fields=temp&fields=precipitation&apikey=${apiKey}`;

  const res = await fetch(url);
  const data = await res.json();
  return data;
}

async function printWeatherData() {
  const { temp, precipitation } = await getWeatherData(cc_key, 45.658, 25.6012);

  // *
  await writeToLcd(0, 0, Math.round(temp.value) + temp.units);

  // *
  const precipitationMessage =
    "Precip.: " + precipitation.value + precipitation.units;
  await writeToLcd(0, 1, precipitationMessage);
To receive weather data from ClimaCell, for example, for a certain city, you need to pass the geographic coordinates to the API - latitude and longitude.
To find the coordinates of your city, you can use a free service like latlong.net and then save the coordinates in a file
config.jsonalong with the API key. It is quite possible to enter these data directly into the code.
The data returned by the API looks like this:
{
  lat: 45.658,
  lon: 25.6012,
  temp: { value: 17.56, units: 'C' },
  precipitation: { value: 0.3478, units: 'mm/hr' },
  observation_time: { value: '2020-06-22T16:30:22.941Z' }
}
This object, using the destructive assignment mechanism, can be parsed and, having received information about the temperature and precipitation level, display this information in the first and second lines of the display.
Step 5. Completing the project
We just have to modify the code and, when new data arrives, update the information displayed on the screen.
async function main() {
  await printWeatherData();

  setInterval(() => {
    printWeatherData();
  }, 5 * 60 * 1000);

  setInterval(async () => {
    await writeToLcd(8, 0, new Date().toISOString().substring(11, 19));
  }, 1000);
}

lcd.on("ready", main);

// *     ctrl+c,     .
process.on("SIGINT", (_) => {
  lcd.close();
  process.exit();
});
Weather data is updated every 5 minutes. But, since ClimaCell limits the number of requests made to the service to 100 requests per minute, we can go even further and update the data every minute.
We can display time using one of two approaches:
- You can use the property of the
observation_timeobject coming from the API and display the arrival time of the data. - You can make a real clock and display the current time.
I chose the second option, but you may well do otherwise.
To display the time in the upper right part of the display, you first need to find the column from which the display should begin. This will allow the data to fit neatly into the available screen space. To find the column number, use the following formula:
- ,
The time information is 8 characters long, and since the display line is 16 characters long, you need to start displaying this information at column # 8.
The work with the display is organized asynchronously. Therefore, to know when the display is initialized and ready to go, we must use the library method
lcd.on().
Another recommended technique for working with embedded systems is to release resources when the program exits. This is why we use an event handler
SIGINTto release display resources when the program exits.
There are other similar events:
SIGUSR1andSIGUSR2- for interceptionkill PID, like restartingnodemon.uncaughtException- to catch unhandled exceptions.
Step 6. Organization of continuous script operation
Our script is ready and we can already run the program. But we still have something to do before declaring the project completed.
At this point, you are probably connected to the Raspberry Pi using SSH, or directly. But, regardless of the method of connecting to the board, when you close the terminal, the program will stop.
At the same time, if you turn off the board and then, immediately, or after a while, turn it on again, the script will not automatically start. You will have to start it manually.
To solve these problems, we can use a process manager like pm2 .
Here's what to do:
- Installing pm2:
sudo npm install pm2 -g - Create a startup script for pm2:
sudo pm2 startup - Application launch:
pm2 start index.js - Saving a list of processes between server restarts:
pm2 save
The Raspberry Pi can now be restarted. The script will run after the device is ready for use.
Outcome
Now you have a weather monitoring system at your disposal that you can customize as you like. If knowledge of the weather data is important to you (or if you want to keep abreast of other metrics provided by ClimaCell, such as air pollution levels), you can create a Raspberry Pi case that can hold an LCD display as well. And then, having equipped this structure with a battery, it can be neatly placed somewhere.
The Raspberry Pi is a board that looks a lot like a regular computer. You can do a lot more fun with it than you usually do with microcontrollers like the Arduino . Therefore, the Raspberry Pi is easy to pair with other devices you have.
Are you planning to do something similar to what was discussed in this material?
