From an architectural point of view, the IoT platform requires the following tasks to be solved:
- The amount of data received, received and processed requires high bandwidth, storage and computing power.
- Devices can be distributed over a wide geographic area
- Companies require their architecture to constantly evolve so that new services can be offered to customers.
One of the features of the IoT platform is independence between objects and signals, which allows parallel computations, increasing productivity.
Data coming from sensors is collected from sources: PLC, DCS, microcontrollers, etc. and can be stored in the time domain to avoid data loss due to connection problems. The data can be time series (events), semi-structured data (logs and binaries), or unstructured data (images). Time series data and events are collected frequently (from every second to several minutes). They are then sent over the network and stored in a centralized data lake and time-series database TSDB. Data lake can be cloud-based, local data center, or third-party storage.
The data can be processed immediately using data flow analysis called "hot path" with a rule checking mechanism based on simple or smart setpoint. Advanced analytics can include digital twins, machine learning, deep learning, or physics-based analytics. Such a system can process a large amount of data (from ten minutes to a month) from different sensors. This data is stored in intermediate storage. This analytics is called "cold path" and is usually launched by the scheduler or when data is available and requires a lot of computing resources. Advanced analytics often need additional information such as the monitored vehicle model and operational attributes, which can be found in the asset registry.The Asset registry contains information about the type of asset, including its name, serial number, symbolic name, location, operational capabilities, the history of the parts it consists of, and the role it plays in the manufacturing process. In the asset registry, we can store a list of the dimensions of each asset, logical name, unit of measure and range of boundaries. In the industrial sector, this static information is essential for a correct analytical model.In the industrial sector, this static information is essential for a correct analytical model.In the industrial sector, this static information is essential for a correct analytical model.
Reasons for developing a custom platform:
- Return on investment: small budget;
- Technology: use of technology regardless of the supplier;
- Data confidentiality;
- Integration: the need to develop a level of integration with a new or outdated platform;
- Other restrictions.
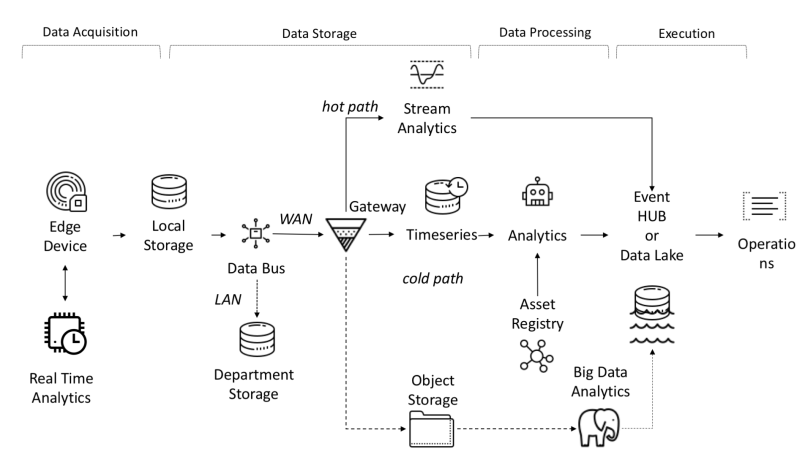
End-to-end data flow in I-IoT
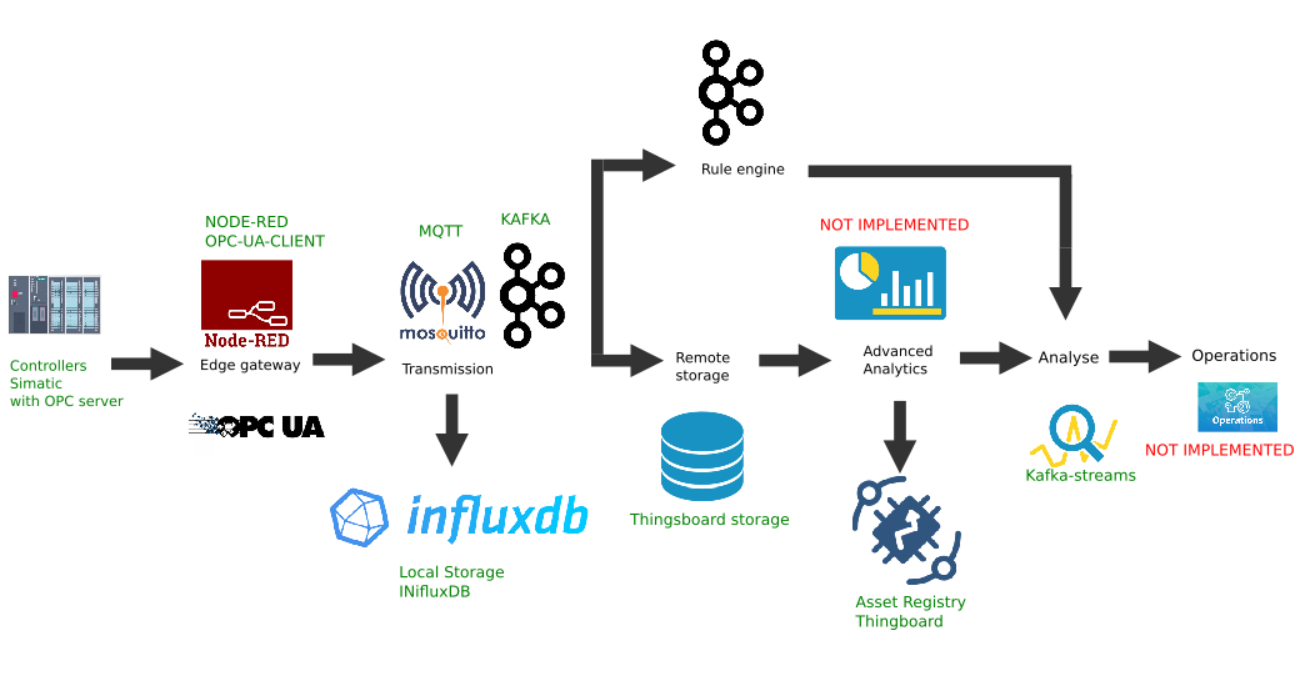
Example of custom implementation of the Edge platform
This figure shows the implementation of the following platform links:
- Data source: as an example, a Simatic PLCSIM Advanced controller simulator with an activated OPC server is selected, as described in the previous article;
- The popular Node-Red platform with the node-red-contrib-opcua plugin installed was chosen as the border gateway ;
- MQTT broker Mosquitto is used as a dispatcher for data transfer between other links in the stream;
- Apache Kafka is used as a distributed streaming platform that serves as hot path analytics using kafka-streams.
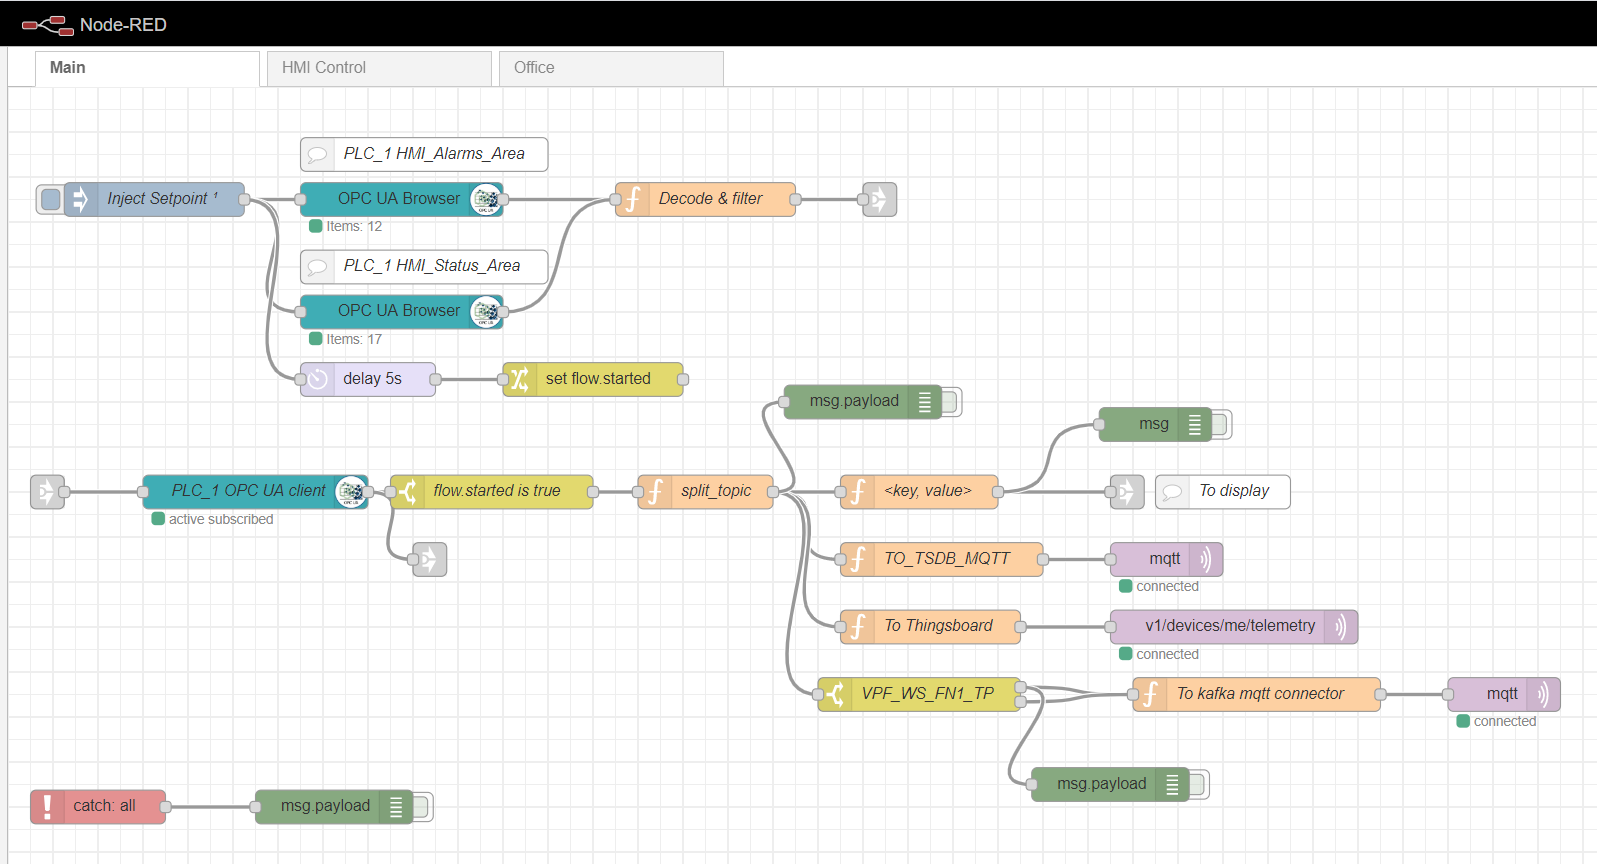
Node-red Edge gateway
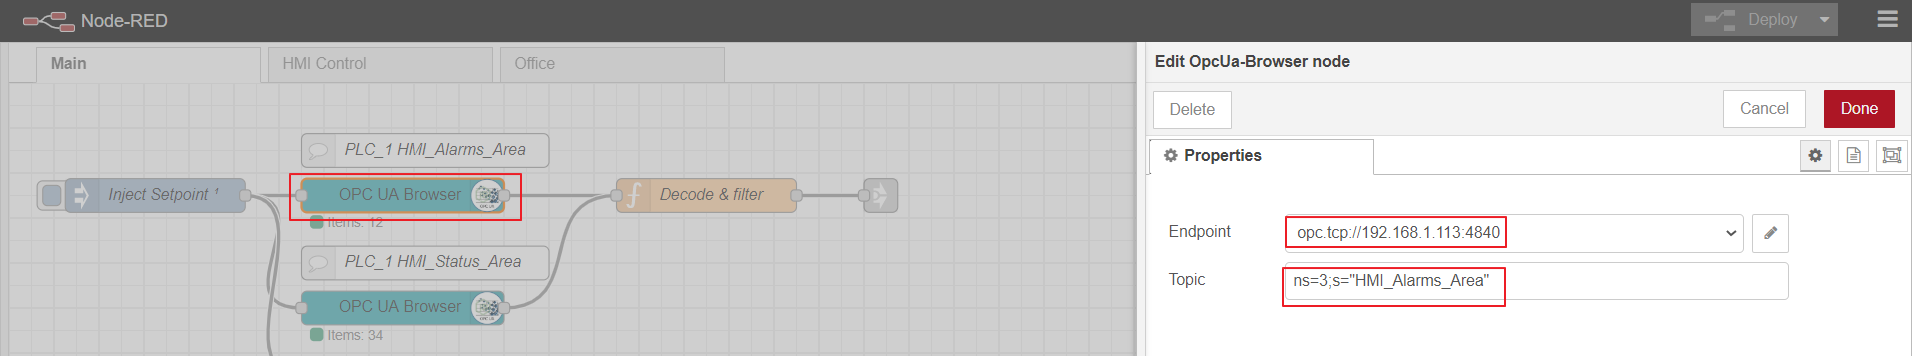
As an edge computing gateway, we will use Node-red, a simple custom platform that has many different plugins. The role of the Industrial adapter is played by the node-red-contrib-opcua plugin. For multiple collection of data from the controller by the subscription method, the nodes are used: OpcUa-Browser and OpcUa-client. In the OPC browser node, the url of the OPC server (endpoint) and the topic are configured, which specifies the namespace and name of the readable data block, for example: ns = 3; s = "HMI_Alarms_Area". In the OPC client node, the url of the OPC server is also specified, the SUBSCRIBE and the data update interval are set as the Action.
Node-red main flow
Setting up the OPC-browser node
OPC-client

In order to subscribe to read multiple data, it is necessary to prepare and download tags from the controller, according to the OPC protocol. To do this, first, an inject node is used with the only once checkbox, which triggers a one-time reading of data blocks specified in the OPC browser nodes. The data is then processed by the Decode & filter function. After that, the OPC client node subscribes and reads the changing data from the controller. Further processing of the stream depends on the specific implementation and requirements. In my example, I process the data for further sending it to the MQTT broker to different topics.
The HMI control and Office tabs are a simple HMI implementation based on Scadavis.io and a node-red dashboard as described earlier in the article .
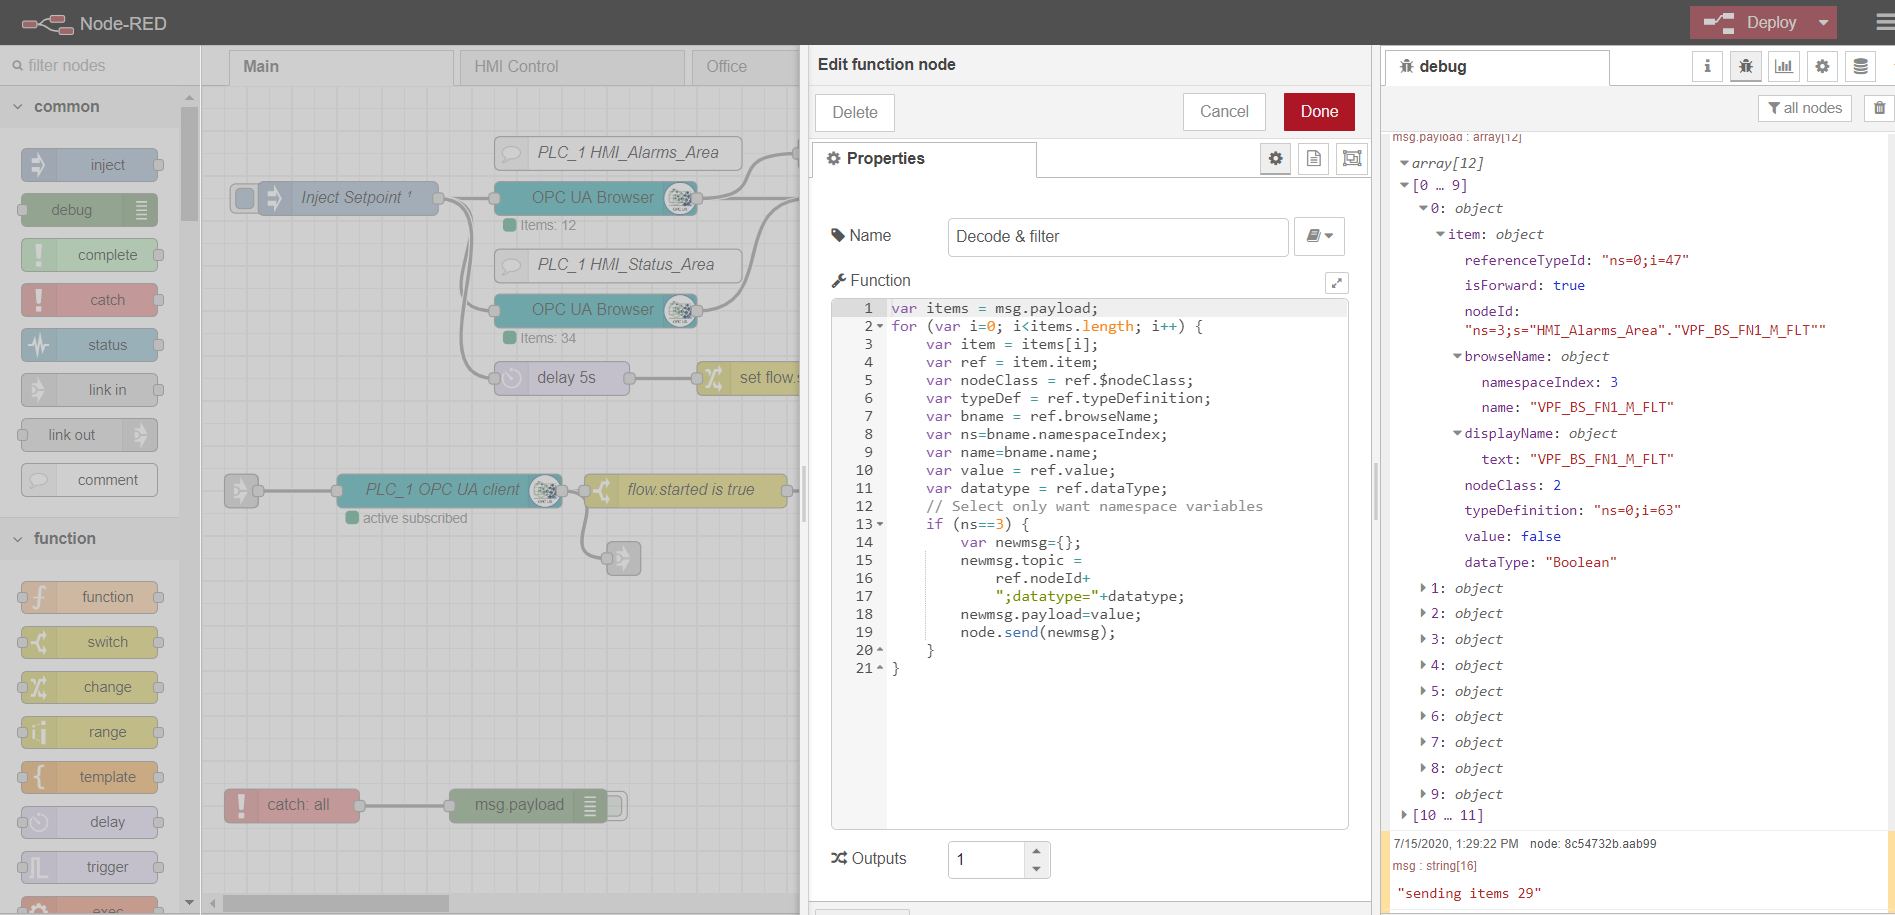
An example of parsing data from an OPC-browser node:
var items = msg.payload;
for (var i=0; i<items.length; i++) {
    var item = items[i];
	var ref = item.item;
	var nodeClass = ref.$nodeClass;
	var typeDef = ref.typeDefinition;
	var bname = ref.browseName;
	var ns=bname.namespaceIndex;
	var name=bname.name;
	var value = ref.value;
	var datatype = ref.dataType;
	// Select only want namespace variables
	if (ns==3) {
	    var newmsg={};
		newmsg.topic =
		    ref.nodeId+
		    ";datatype="+datatype;
		newmsg.payload=value;
		node.send(newmsg);
	}
}
MQTT broker
Any implementation can be used as a broker. In my case, the Mosquitto broker is already installed and configured . The broker performs the function of transporting data between the Edge gateway and other platform participants. There are examples with load balancing and distributed architecture ( like here ). In this case, we will restrict ourselves to one mqtt broker with data transfer without encryption.
Local storage of time series data
It is convenient to record and store time series data in the NoSql time-series database. The InfluxData stack works well for our purposes . We need four services from this stack:
InfluxDB is an open source time series database that is part of the TICK (Telegraf, InfluxDB, Chronograf, Kapacitor) stack. Designed for high-load data processing and provides SQL-like query language InfluxQL for interacting with data.
Telegraf is an agent for collecting and sending metrics and events to InfluxDB from external IoT systems, sensors, etc. It is configured to collect data from mqtt topics.
Kapacitor is a built-in data engine for InfluxDB 1.x and an integrated component into the InfluxDB platform. This service can be configured to monitor various setpoints and alarms, as well as install a handler for sending events to external systems such as Kafka, email, etc.
Chronograf is the user interface and administrative component of the InfluxDB platform. Used to quickly create dashboards with real-time visualization.
All components of the stack can be run locally or set up a Docker container.
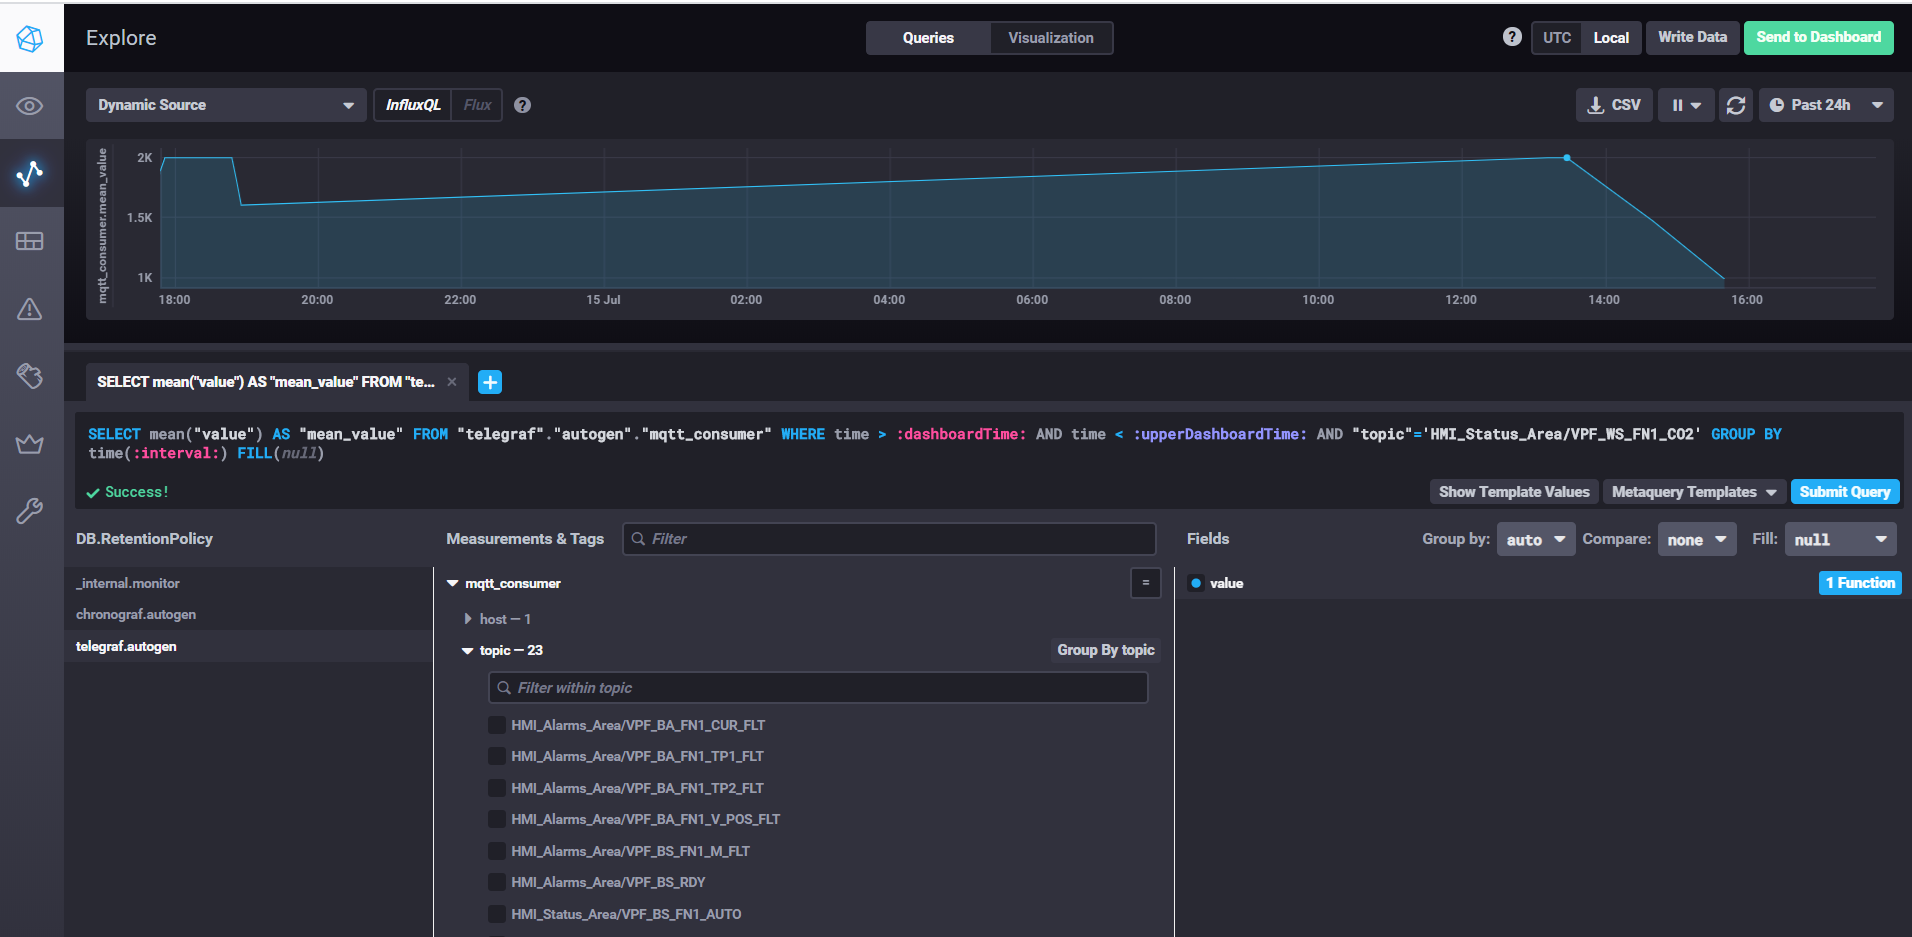
Fetching data and customizing dashboards with Chronograf
To start InfluxDB, just execute the influxd command, in the influxdb.conf settings, you can specify the storage location and other properties, by default the data is stored in the user directory in the .influxdb directory.
To start telegraf, you need to run the command telegraf -config telegraf.conf, where you can specify the sources of metrics and events in the settings, in our example for mqtt it looks like this:
# # Read metrics from MQTT topic(s)
 [[inputs.mqtt_consumer]]
   servers = ["tcp://192.168.1.107:1883"]
   qos = 0
   topics = ["HMI_Status_Area/#", "HMI_Alarms_Area/#"]
   data_format = "value"
   data_type = "float"
In the servers property, specify the url to the mqtt broker, qos can leave 0 if it is enough to write data without confirmation. In the topics property, specify the mqtt topic masks from which we will read data. For example HMI_Status_Area / # means that we read all topics that have the HMI_Status_Area prefix. Thus, telegraf for each topic will create its own metric in the database, where it will write data.
To start kapacitor, you need to run the kapacitord -config kapacitor.conf command. The properties can be left as default and further settings can be done with chronograf.
To start chronograf, just run the chronograf command of the same name. The web interface will be available localhost : 8888 /
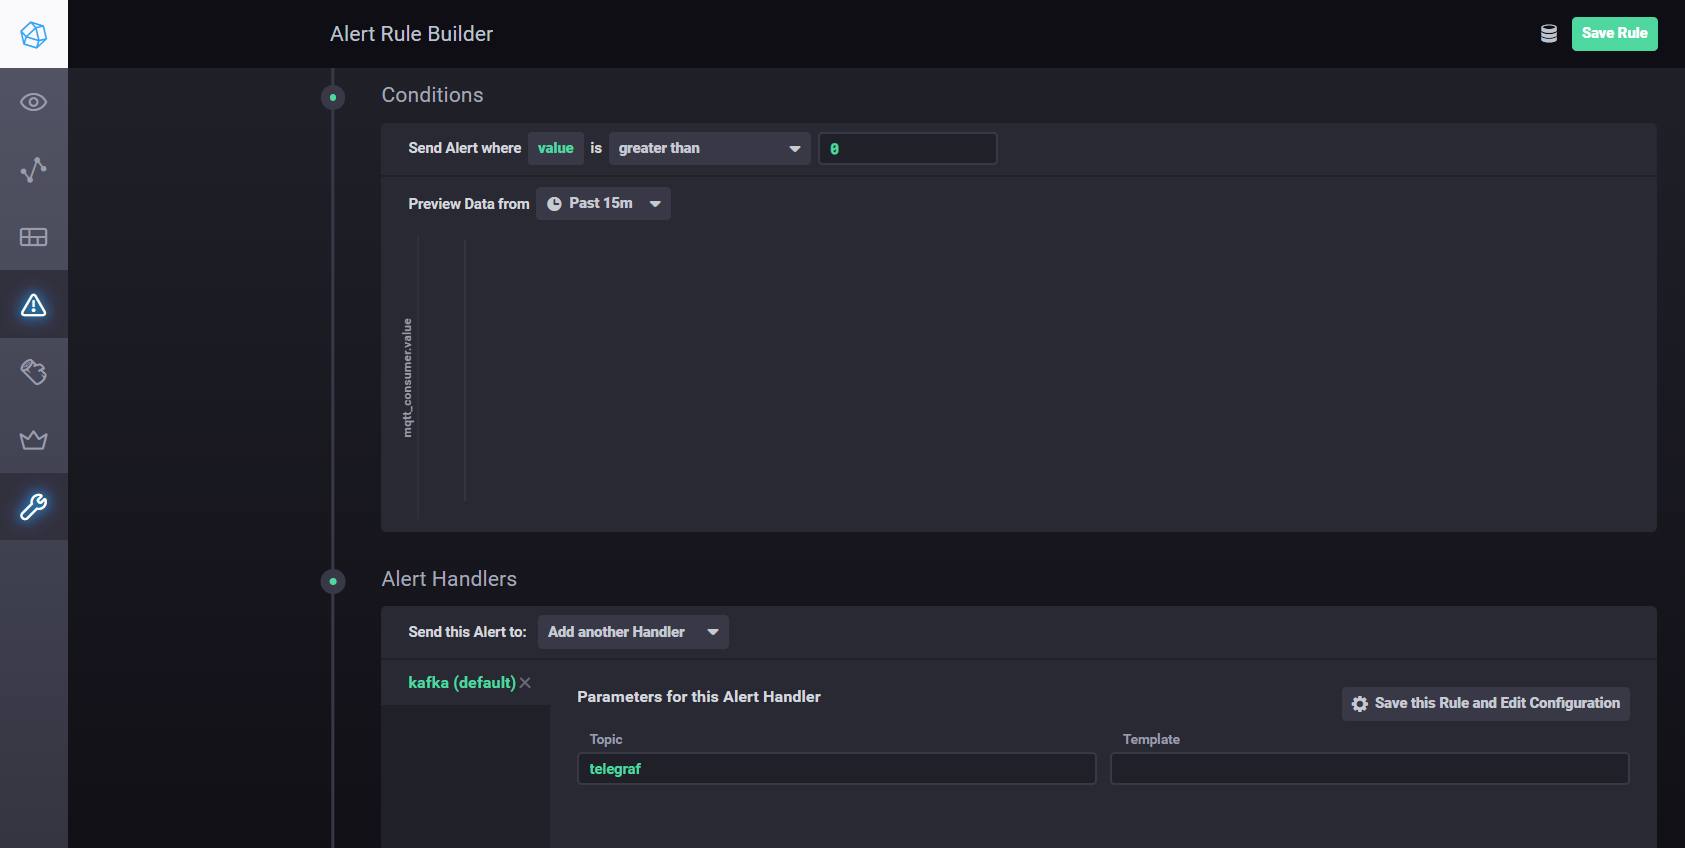
To configure settings and alarms using Kapacitor, you can usemanual . In short - you need to go to the Alerting tab in Chronograf and create a new rule using the Build Alert Rule button, the interface is intuitive, everything is done visually. To set up sending processing results to kafka, etc. you need to add a handler in the Conditions section
Kapacitor handler settings
Distributed Streaming with Apache Kafka
For the proposed architecture, it is necessary to separate data collection from processing, improving scalability and layer independence. We can use a queue to achieve this goal. The implementation can be Java Message Service (JMS) or Advanced Message Queuing Protocol (AMQP), but in this case we will use Apache Kafka. Kafka is supported by most analytics platforms, has very high performance and scalability, and has a good Kafka-streams library.
You can use the Node-red node-red-contrib-kafka-manager plugin to interact with Kafka . But, taking into account the separation of collection from data processing, we will install the MQTT plugin, which subscribes to Mosquitto topics. The MQTT plugin is available here .
To configure the connector, copy the kafka-connect-mqtt-1.1-SNAPSHOT.jar and org.eclipse.paho.client.mqttv3-1.0.2.jar libraries (or another version) to the kafka / libs / directory. Then, in the / config directory, you need to create a properties file mqtt.properties with the following content:
name=mqtt
connector.class=com.evokly.kafka.connect.mqtt.MqttSourceConnector
tasks.max=1

kafka.topic=streams-measures
mqtt.client_id=mqtt-kafka-123456789

mqtt.clean_session=true
mqtt.connection_timeout=30
mqtt.keep_alive_interval=60

mqtt.server_uris=tcp://192.168.1.107:1883
mqtt.topic=mqtt
Having previously launched zookeeper-server and kafka-server, we can start the connector using the command:
connect-standalone.bat …\config\connect-standalone.properties …\config\mqtt.properties
From the mqtt topic (mqtt.topic = mqtt), data will be written to the Kafka topic streams-measures (kafka.topic = streams-measures).
As a simple example, you can create a maven project using the kafka-streams library.
Using kafka-streams, you can implement various services and scenarios for hot analytics and streaming data processing.
An example of comparing the current temperature with the setpoint for the period.
StreamsBuilder builder = new StreamsBuilder();

        KStream<String, String> source = builder.stream("streams-measures");

        KStream<Windowed<String>, String> max = source
                .selectKey((String key, String value) -> {
                        return getKey(key, value);
                    }
                )
                .groupByKey()
                .windowedBy(TimeWindows.of(Duration.ofSeconds(WINDOW_SIZE)))
                .reduce((String value1, String value2) -> {
                        double v1=getValue(value1);
                        double v2=getValue(value2);
                        if ( v1 > v2)
                            return value1;
                        else
                            return value2;
                    }
                )
                .toStream()
                .filter((Windowed<String> key, String value) -> {
                        String measure = tagMapping.get(key.key());
                        double parsedValue = getValue(value);

                        if (measure!=null) {
                            Double threshold = excursion.get(measure);
                            if (threshold!=null) {
                                if(parsedValue > threshold) {
                                    log.info(String.format("%s : %s; Threshold: %s", key.key(), parsedValue, threshold));
                                    return true;
                                }
                                return false;
                            }
                        } else {
                            log.severe("UNKNOWN MEASURE! Did you mapped? : " + key.key());
                        }
                        return false;
                    }
                );

        final Serde<String> STRING_SERDE = Serdes.String();
        final Serde<Windowed<String>> windowedSerde = Serdes.serdeFrom(
                new TimeWindowedSerializer<>(STRING_SERDE.serializer()),
                new TimeWindowedDeserializer<>(STRING_SERDE.deserializer(), TimeWindows.of(Duration.ofSeconds(WINDOW_SIZE)).size()));

        // the output
        max.to("excursion", Produced.with(windowedSerde, Serdes.String()));
Asset registry
The asset registry, in fact, is not a structural component of the Edge platform and is part of the cloud IoT environment. But this example shows how Edge and Cloud interact.
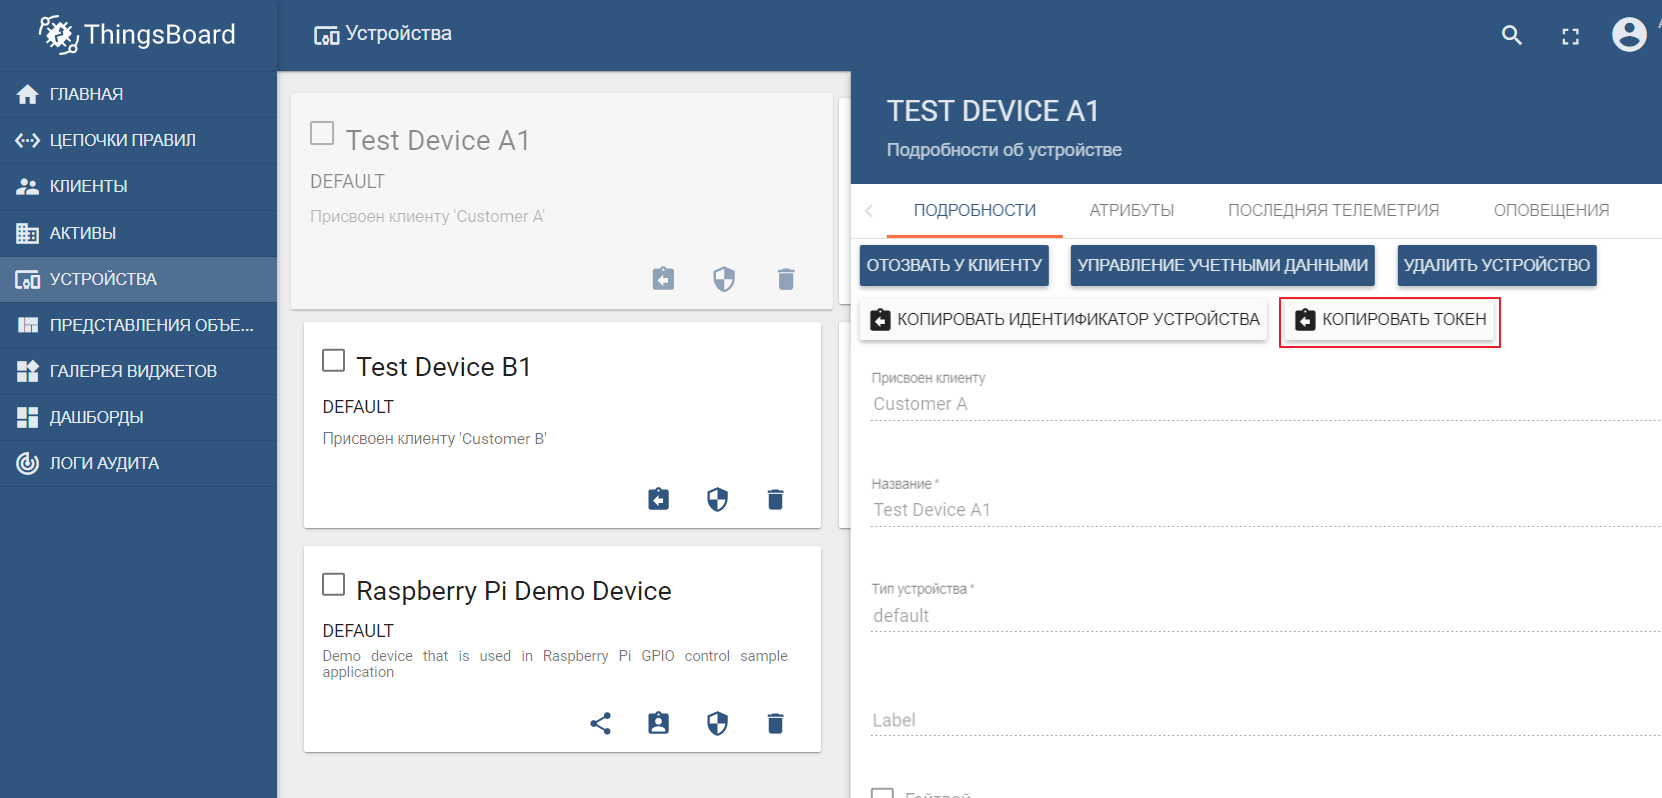
As an asset registry, we will use the popular ThingsBoard IoT platform, the interface of which is also quite intuitive. Installation is possible with demo data. The platform can be installed locally, in docker, or using a ready-made cloud environment .
The demo dataset includes test devices (you can easily create a new one) to which you can send values. By default ThingsBoard starts with its own mqtt broker, to which you need to connect and send datain json format. Let's say we want to send data to ThingsBoard from TEST DEVICE A1. To do this, we need to connect to the ThingBoard broker at localhost: 1883 using A1_TEST_TOKEN as a login, which can be copied from the device settings. Then we can publish data to the topic v1 / devices / me / telemetry: {“temperature”: 26}
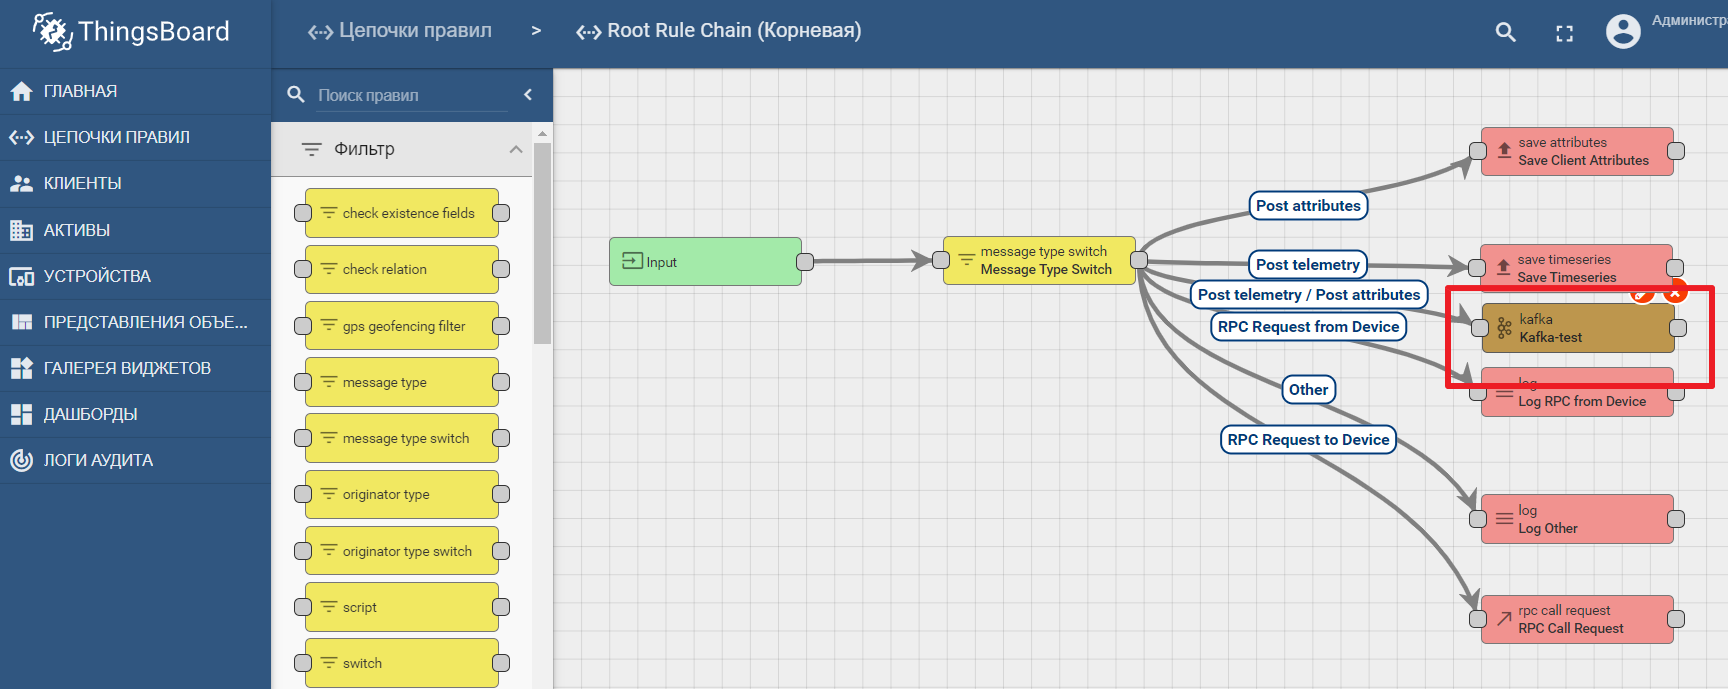
The platform documentation contains a manual for setting up data transfer and processing analytics in Kafka - IoT data analytics using Kafka, Kafka Streams and ThingsBoard
An example of using a kafka node in Thingsboard
Conclusion
Modern IT technologies and open protocols make it possible to design systems of any complexity. The edge platform is the connection point between the industrial environment and the cloud-based IoT platform. It can be decomposed into macrocomponents, among which the edge gateway plays a key role, responsible for forwarding data from devices to the IoT data hub. Open data streaming tools enable efficient analytics and edge computing.