The a priori assumption about the appropriateness and effectiveness of the use of simulators in the risk management system is the assumption that a significant part of the risks are caused by the "human factor" or depend on the "human factor". This assumption is based on the following:
1. According to available data (Rostekhnadzor, CSB, NTSB), the share of the human factor in incidents is 35 to 70%
2. If human error is not taken into account, the calculation can result in almost meaningless values related to safety, such as a reliability index equal to 10 ^ -39 year ^ -1. For example, any member of the maintenance staff, using incorrect instructions for setup, could theoretically disable any enterprise security system. The table contains the basic information on the estimates of the operator's error rates, it can be seen that the operator is 99.99% perfect when performing routine work, but is completely useless under extreme circumstances.
3. The importance of taking into account the “human factor” has been illustrated by various accidents in which critical human errors contributed to a catastrophic sequence of events.
4. While human error is very common and very difficult to predict, existing data on operator and maintenance error rates (WASH 1400, Appendix III) also indicate a significant potential for this factor.
5. The American Petroleum Institute (API), based on a survey of 200 managers at 11 enterprises of 7 petrochemical companies, estimates the average profit from training one operator on CT at more than 100 thousand dollars. in year.
6. Another book provides the following data:
| Study | Result |
| Garrison (1989) | Human error is estimated at $ 563 million for major incidents in the chemical industry prior to 1984. |
| Joshchek (1981) | 80-90% of all incidents in the chemical industry are associated with human error. |
| Rasmussen (1989) | 190 . . :
: 32% : 30% (): 23% : 15% |
| Butikofer (1986) | :
: 41% : 41% : 11% : 5% : 2% |
| Uehara and Hoosegow (1986) | , — 58% |
| Oil Insurance Association Report on Boiler Safety (1971) ( ) | 73% 67% . |
7. estimates the share of individual or human factors in flight accidents at 66%. Armstrong (1939) cites figures from the Department of Commercial Statistics, on the basis of which the proportion of service errors in transport aviation is determined at 41.47%, in sports aviation - 52.18% and on passenger airlines - at 39.65%. Ruff and Struckhold (1944) determine the percentage of accidents due to mental disability at least 50-60%. These figures make it possible to conclude that the human factor, as the cause of flight accidents, is of great importance.
8. “The skeptic is invited to study the statistics of accidents. It proves that it is not technical flaws, but human factors that are the cause of the absolute majority of air disasters, and among them, in turn, psychological factors are in the first place. "
9. Distribution of accidents for reasons given in the book based on available data for 1998-2000:
| Group of reasons | Percentage of accidents,% |
| Low level of work organization | 60 |
| Hardware malfunction | 25 |
| Others (violation of technology, low qualification of personnel, lack of safety equipment) | fifteen |
Also note separately:
- admission of persons to work without appropriate professional training;
- lack of training of personnel.
10. The main causes of accidents on gas pipelines, given in the book, based on the available data for 1996-2001:
| Causes | % of the total |
| External corrosion
|
28.9
|
| incl. KRN
|
22.5 |
| Mechanical damage
|
19
|
| Marriage of construction and installation works
|
21.9
|
| incl. Defect welding
|
thirteen |
| Pipe defects
|
11.4 |
| Natural disasters
|
9.5
|
11. Distribution of accidents for reasons given in book [a6] based on available data for 1990-2002:
| Causes | % of the total |
| Violation of production instructions for ignition of gas-consuming installations | 39 |
| Violation of the Rules for the Protection of Gas Distribution Systems
|
27 |
| Corrosion damage to underground gas pipelines | five |
| Mechanical damage to overhead gas pipelines | 3 |
| Violation of instructions for use of gas equipment
|
8 |
| Violation of Safety Rules in the Gas Industry | 3 |
| Manifestation of factory defects in gas pipes and fittings | five |
| Rupture of welded seams of a polyethylene gas pipeline | 1 |
| Others | nine |
Operator Error Assessment (Document WASH 1400)
Further consideration requires a brief description of the risk management process.
- Error rate by activity
- 10^-4 — , , ( , , )
- 10^-3 — ( ), ; ,
- 3*10^-3 — (, )
- 10^-2 — () , , (, , )
- 3*10^-3 — , , ,
- 3*10^-2 — ,
- 1/ — , ( ) ( ). — ( ), . 1/ , . , , . , ,
- 10^-1 — , ( ) (), , , ,
- -1 — , , , () () () () ()
- -1 — - ,
- 10 ^ -1 - The monitor operator or auxiliary inspector cannot detect the initial operator error. Note: This high error rate is not applicable if there is a continuous error tell-tale on the alarm panel.
- 10 ^ -1 - Personnel on the other shift will not check equipment unless a written directive or specific checklist is given
- 5 * 10 ^ -1 - The monitor does not detect incorrect valve positions, etc. when conducting a general inspection, unless a specific checklist is used
- 0.2-0.3 - Typical error rate for strenuous operator work where dangerous actions occur very quickly
An overview of the risk management process
The proposed methodology for using simulators in the risk management process is based on the following regulatory documents:
- GOST R 51901.13-2005 (IEC 61025: 1990) FAULT TREE ANALYSIS. IEC 61025: 1990 Fault Tree Analysis (FTA) (MOD);
- GOST R 51901.1-2002 Risk analysis of technological systems. harmonized with the international standard IEC 60300-3-9: 1995 "Dependability Management - Part 3: Application guide - section 9: Risk analysis of technological systems" - "Dependability Management. Part. 3. Application guidance. Section 9. Risk Analysis of Technological Systems ";
- GOST R 51901.11-2005 (IEC 61882: 2001) RESEARCH OF HAZARD AND OPERATION. Applied manual. IEC 61882: 2001 Hazard and operability studies (HAZOP studies) - Application guide (MOD).
According to the above documents, the term risk is defined as “a combination of the probability of occurrence of a hazardous event and its consequences. The risk is present in any human activity. It can relate to health and safety (considering, for example, both immediate and long-term health effects from exposure to toxic chemicals). The risk can be economic, for example resulting in the destruction of equipment and products due to fires, explosions or other accidents. It can take into account adverse environmental impacts. "
"Risk management - coordinated actions to direct and control an organization in relation to risks"
"The goal of risk management is to control, prevent or reduce the death of people, reduce morbidity, reduce damage, property damage and consequential losses, as well as prevent adverse environmental impact."
"The risk management process covers various aspects of risk management, from risk identification and analysis, to assessing its acceptability and identifying potential risk mitigation opportunities through the selection, implementation and control of appropriate management actions." (Figure)
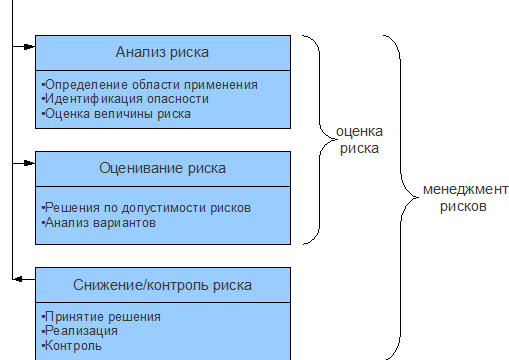
Figure X.1. Relationship between risk analysis and other risk management actions (GOST R 51901.1 - 2002)
“The risk management process is implemented by comparing the results of risk analysis with the criteria of acceptable risk. In general, the assignment of criteria for acceptable risk is a rather difficult task, especially in the social, economic and political fields, and is outside the scope of these standards. "
“Risk analysis is a structured process, the purpose of which is to determine both the likelihood and magnitude of the adverse consequences of the action, object or system under investigation. These standards consider harm to people, property or the environment as adverse effects. "
Analysis can cover areas of expertise such as systems analysis; probability and statistics; physical, chemical, medical (toxicology and epidemiology), social sciences (economics, psychology and sociology) or biological sciences; the influence of the human factor, management science, etc.
Hazards can be classified into the following four main categories: natural hazards; technical hazards; social dangers; lifestyle-related hazards (these categories are not mutually exclusive, for example, when analyzing technical hazards, it is often necessary to take into account the influence of factors from other categories). The nature of the consequences can be: individual (impact on individuals); professional (impact on workers); social (general impact on the community of people); leading to property damage and economic losses (business violations, fines, etc.); environmental (impact on land, air, water, flora, fauna and cultural heritage).
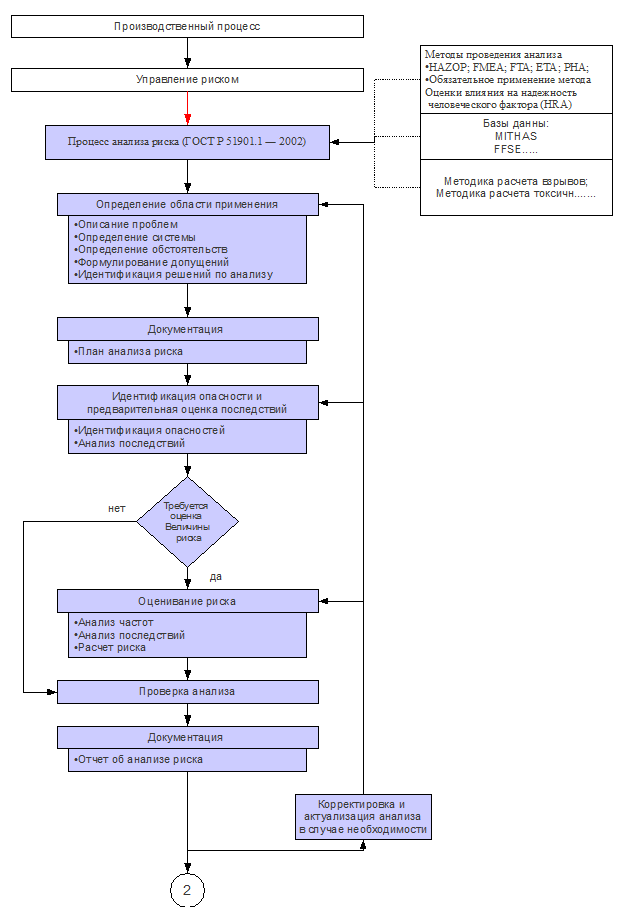
The initial step in the risk management system is the risk analysis process (GOST R 51901.1-2002), which covers the entire range of hazards, not just the human factor.
As an example, consider a centrifugal pump that pumps water from natural sources. Considering the system is limited to the following elements - Figure X.
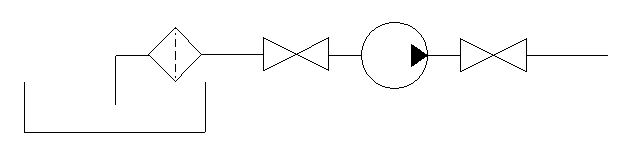
To determine the magnitude of the risk, the hazards that cause the risk, as well as the ways in which these hazards can be realized, must be identified. Known hazards (possibly from previous accidents) must be clearly and accurately identified. Formal methods should be used to identify hazards that were not previously considered in the analysis:
- Hazard and Related Problem Research (HAZOP)
- . , , , - .
- ( « » (F)
- ( « ») ()
- ()
- (HRA)
HAZOP (GOST R 51901.11-2005 (IEC 61882: 2001)) is a form of failure mode and effect analysis (FMEA). This is a procedure for identifying potential hazards throughout the facility as a whole. The goal is to define the system and outline potential hazards.
1. Identify the sources of hazards (explosions, leaks, fires, etc.)
2. Identify the parts of the system that can cause these hazardous conditions
3. Limitations on the analysis. For example, it needs to be decided whether it will include a study of risk from sabotage, sabotage, war, human error, lightning, earthquakes, etc.
A checklist similar to that used by Boeing is the primary tool in identifying hazards: Conventional fuels; Motor fuel; Explosives; Rechargeable batteries; Pressure containers; Spring mechanisms; Heating devices; Pumps, blowers, fans; Rotating mechanisms, etc.
Dangerous processes and conditions: Acceleration; pollution; corrosion; Electrical (power supply failures, unintended inclusions, etc.); Explosions; Fires; Heating and cooling (low, high, differential); Leaks; Moisture; Oxidation; Pressure (low, high, differential); Radiation; Mechanical shocks, etc.
In fact, each major piece of equipment and all ancillary equipment are analyzed. For each line and piece of equipment in relation to such process variables as temperature, pressure, flow rate, level and chemical composition, indicator words are used (taking into account the failure of all protective mechanisms) (according to Table A.1).
Table A.1 - Indicator words HAZOP II
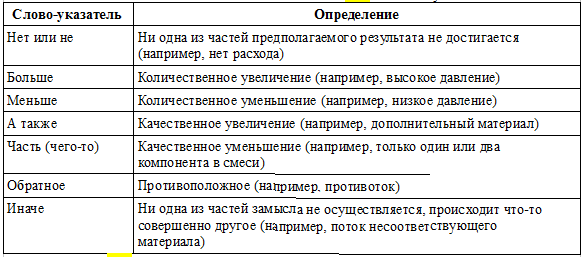
Table A.2 - Example of a worksheet of indicator words “no, no” HAZOP II
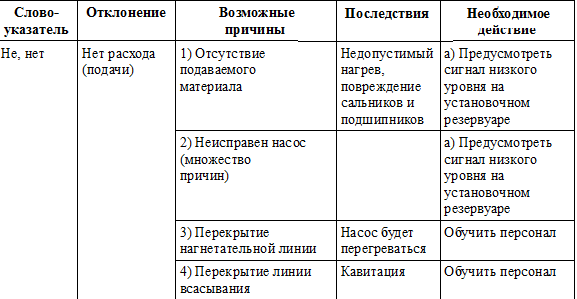

Figure X. Diagram of the HAZOP research process (from GOST R 51901.11-2005)
A more detailed analysis of the identified deviations and their causes are usually performed according to the “Fault tree” (FTA), “Event tree”) (ETA) and “Human Factors Influence” (HRA) techniques.
FTA (IEC 61025) is a set of qualitative or quantitative techniques, with the help of which those conditions and factors that can contribute to a certain undesirable event (called the apex of events) are identified by deduction, built in a logical chain and presented in graphical form.
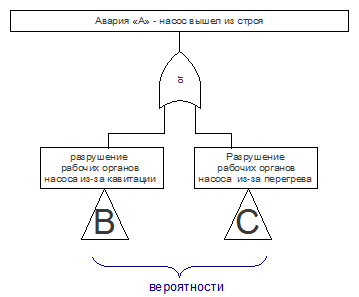
Drawing. Analysis of the diagram of all possible consequences of a failure or failure of the system (analysis of the "fault tree" (FTA)

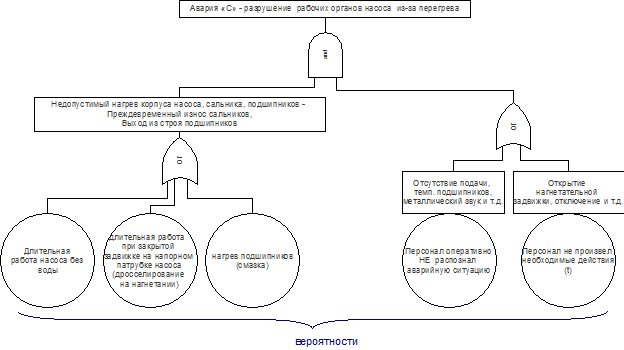
Figure. Analysis of the diagram of all possible consequences of failure or failure of the system (analysis of the "fault tree" (FTA)
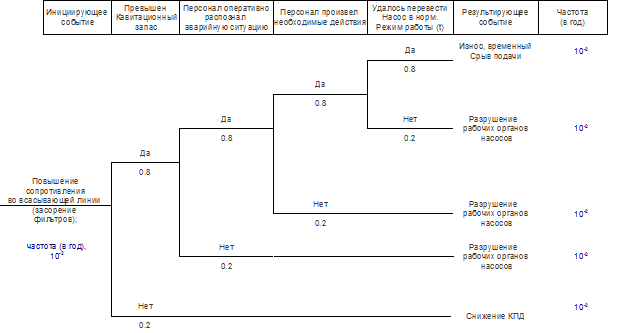
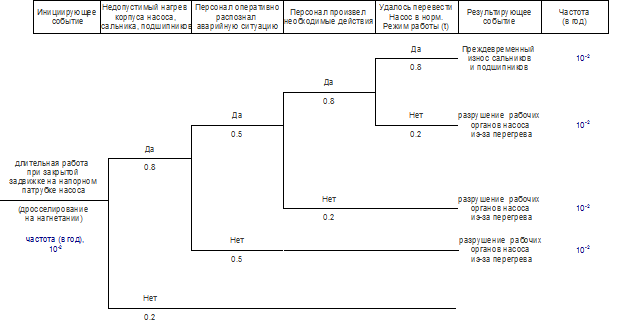
ETA is an inductive type of analysis in which the main question to be asked is "what happens if ...?" It provides a relationship between the operation (or failure) of various mitigating systems and a hazardous event following a single triggering event. The ETA is very useful in identifying events that require further analysis using the FTA (ie the tops of the Fault Trees).
HRA. The assessment relates to the influence of the human factor, namely operators and maintenance personnel, on the operation of the system and can be used to assess the impact of human error on safety and performance. In fact, the process of personnel activity is investigated, starting from the identification of an incident, diagnosis, decision-making, and ending with the actions performed (Figure X390).
Risk assessment
For each end event in the "event tree", the accidents characteristic of this end event are modeled. The physical processes of the formation of emergency situations (outflow, evaporation, formation of an explosive cloud, etc.) and emergency processes (explosions, fires, dispersion of hazardous impurities in the atmosphere, etc.) are simulated. The boundaries of possible affected areas are determined. Solutions are considered that allow to reduce the mass or intensity of the ejection, to reduce the possible affected areas.
Based on the results of modeling physical processes in each emergency event, the impact of damaging factors on people, property and the environment is determined, the consequences of these effects and the probability of these consequences are determined. The degree of destruction of buildings and structures is determined, taking into account their resistance to shock-wave loads, the ignition of materials under the influence of thermal loads of a fire, damage to people under the influence of damaging factors of all possible types of accidents. The expected number of victims and losses of the negative impact of the accident on people, property and the environment are determined. The total risk of negative consequences from all possible sources of accidents (TS elements) is determined. Territorial risk is determined for the personnel of the investigated object and for the population,as well as individual and social risks for the selected regions. Technical solutions and organizational measures are considered to reduce the likelihood of negative consequences.
Frequency analysis: The purpose of frequency analysis is to determine in more detail the frequency of each of the unwanted events or accident scenarios identified during the hazard identification stage. Three main approaches are commonly used:
- use of relevant operating data
- predicting event rates using techniques such as diagramming (rather than drawing) all possible consequences of a system failure or failure (“fault tree”) and analyzing a diagram of the possible consequences of a given event (“event tree”). In the event that statistical data are not available or do not meet the requirements, it is necessary to obtain the frequency of events by analyzing the system and its emergency conditions.
- use of expert opinion.
- - data on reliability from literary sources - from passports, technical specifications for the product, GOSTs, reference books, articles, reports;
- - operational reliability data collected from facilities where risk assessment or targeted data collection has been carried out to determine reliability.
Impact analysis. Consequence analysis provides for a detailed determination of the results of impact on people, property or the environment in the event of an undesirable event. For calculating safety risks (people working or not working), a consequence analysis is a rough estimate of the number of people who could be killed, injured or seriously injured should an undesirable event occur.
Unwanted events usually consist of situations such as the release of toxic materials, fires, explosions, emission of particles from destructive equipment, etc. Consequence models are required to predict the size of accidents, disasters and other phenomena. Knowledge of the mechanism for the release of energy or material and the subsequent processes occurring with them makes it possible to predict the corresponding physical processes in advance.
There are many methods for evaluating this kind of phenomena, ranging from simplistic analytical approaches to highly complex computer models. When using modeling techniques, it is necessary to ensure that it is appropriate for the problem to be addressed.
For instance:
- Calculation of the overpressure of the explosion for flammable gases, vapors of flammable and flammable liquids. NPB 105-03
- NPB 105-03 "Determination of categories of premises, buildings and outdoor installations for explosion and fire hazard"
Risk calculation. In practice, the identification of a hazard from a particular system, equipment or activity can result in a very large number of potential accident scenarios.
Detailed quantitative analysis of frequencies and consequences is not always feasible. In such situations, it may be advisable to rank the scenarios qualitatively, placing them in risk matrices indicating different levels of risk. The quantification then concentrates on scenarios that give higher levels of risk.
Table X provides an example of a risk matrix. The application of the risk matrix could result in scenarios that are considered to be a source of low or insignificant risks, which are reduced on closer examination, since in a collective sense they could not become a source of a significant level of risk.
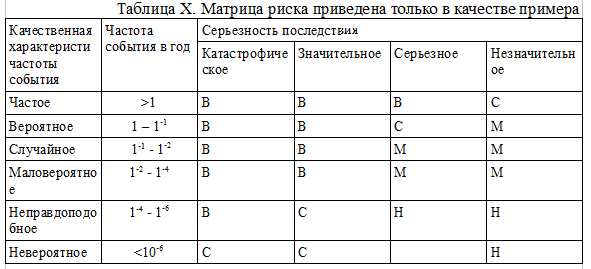
The matrix uses the following risk classification:
- B - high risk value;
- - average risk value;
- M - small amount of risk;
- H is an insignificant amount of risk.
For this example, the severity of the consequence is defined as follows:
- Catastrophic - the almost complete loss of an industrial facility or system. Many deaths;
- Major - Major damage to an industrial facility or system. Several deaths;
- Serious - severe injury, serious occupational disease, serious damage to an industrial facility or system;
- Minor - minor injury, mild occupational disease, or minor damage to the system.
Despite the fact that the GOST provides only an example of a risk matrix, other techniques can be found in the sources studied, such as a "cause-effect" diagram or a Farmer curve .
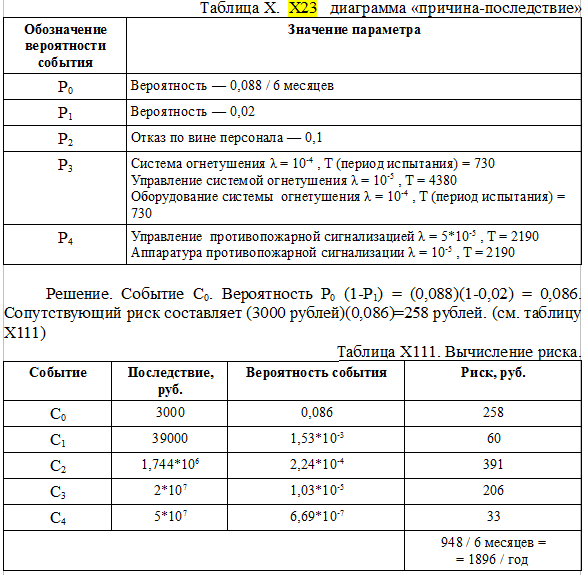
Table X23 shows a cause-effect diagram based on the obtained probabilities of incidents and their consequences. For example, the “pump breakdown” event corresponds to the expected number of failures - 0.088 for 6 months of operation (pump overhaul period). The probability that a shutdown will result in a “water hammer” is 0.02. The consequences of a water hammer are losses indicated by parameters from C0 to C4; they are 1000 rubles if the equipment is damaged (with a probability P0 (1-P1)), and 5 * 10-7 rubles if the entire hydraulic part is destroyed (the probability is equal to P0P1P2P3P4). Downtime losses are estimated at 1000 rubles per hour. Thus, the total losses are
C0 = 1000 rubles + (2) (1000 rubles) = 3000 rubles;
C1 = 15,000 rubles + 24,000 rubles = 39,000 rubles, etc.
Knowing the following values of the parameters, we will determine the possible consequences for each event, then we will present the results graphically depending on the probability of its occurrence, showing on the graph a constant risk line, estimated at 300 rubles.
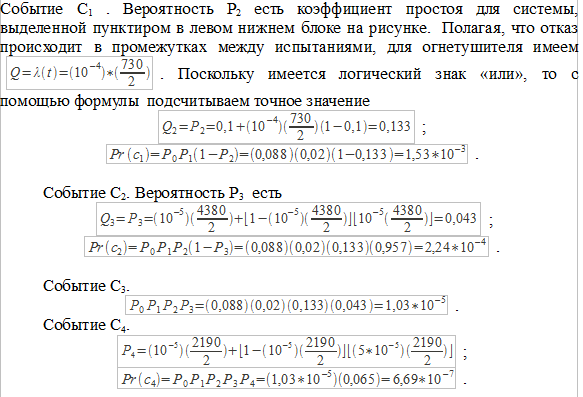
The figure shows the Farmer risk curve, including the plotted straight lines corresponding to the 300-ruble risk. This type of schedule is useful in defining design criteria for accident events with known consequences and acceptable level of risk.
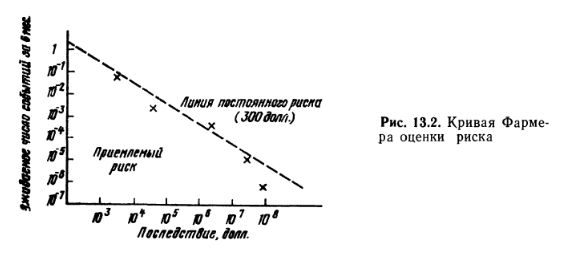
Drawing. Farmer's risk curve
At the conclusion of the risk analysis, the analysis results are checked (possibly with the involvement of another group of experts), the analysis results are adjusted taking into account the latest data and documentary justification (a report in an approved form).
The resulting risk values are compared with the acceptable risk value established by law or agreed with the Customer and stakeholders (for example, the value of an individual fire risk established by Federal Law No. 123-FZ should not exceed 1E-6 per year when an individual is placed in the most distant exit from the building, structure and structure to the point.)
If the risk exceeds the acceptable, all the solutions selected at the previous stages of the analysis are analyzed and those of them are selected that allow reducing its value to an acceptable one at the lowest cost. Proposals for the customer are being developed for implementation. If the risk does not exceed the acceptable one, then a justification for the sufficient safety of the facility is provided.