
This article is the third and final installment of the Sysmon Threat Analysis series. All other parts of the series:
Part 1. Introducing Sysmon Log Analysis
Part 2. Using Sysmon Event Data to Detect Threats
Part 3. Advanced Sysmon Threat Analysis Using Graphs (we are here)
Finding Non-Standard Subgraphs with Sysmon Event Data (Simple Example)
Before we look at an example of identifying anomalies in subgraphs that indicate a potential threat (and if these words do not awaken the nerd in you, then nothing will awaken you!), Let's make a small digression.
At this point, I must issue a warning: this post, along with the code on GitHub, cannot replace an enterprise-grade solution. It can help identify threats on a smaller scale, but my noble mission is to help IT security professionals understand and appreciate real-world threat protection solutions. And one way to achieve this is to create your own solution yourself (with my help).
Experiments at home will help you understand how difficult it is to scale DIY threat detection software. You will have to work with big data sets and everything related to them: cleaning (which is an extremely difficult task), efficient processing (finding the necessary data structures, algorithms, etc.) and providing results with a low number of false positives so that your the same colleagues then did not climb on you with their fists. With this in mind, you can consider a ready- made threat detection solution ... but only after completing our series of articles and conducting your own experiments.
Setting graph weights
One easy way to build a threat protection solution that doesn't rely on malware signatures is to use the threat graph from the previous part .
Such a graph connects process nodes based on entries from the Sysmon event log.
Please note: I did not separate each process start event (Event ID 1 in Sysmon events) into a separate vertex. Instead, I created a more abstract graph that shows, say, the PowerShell vertex has one link to whatever application it launches from any user - one link for Excel, one for the browser, and so on.
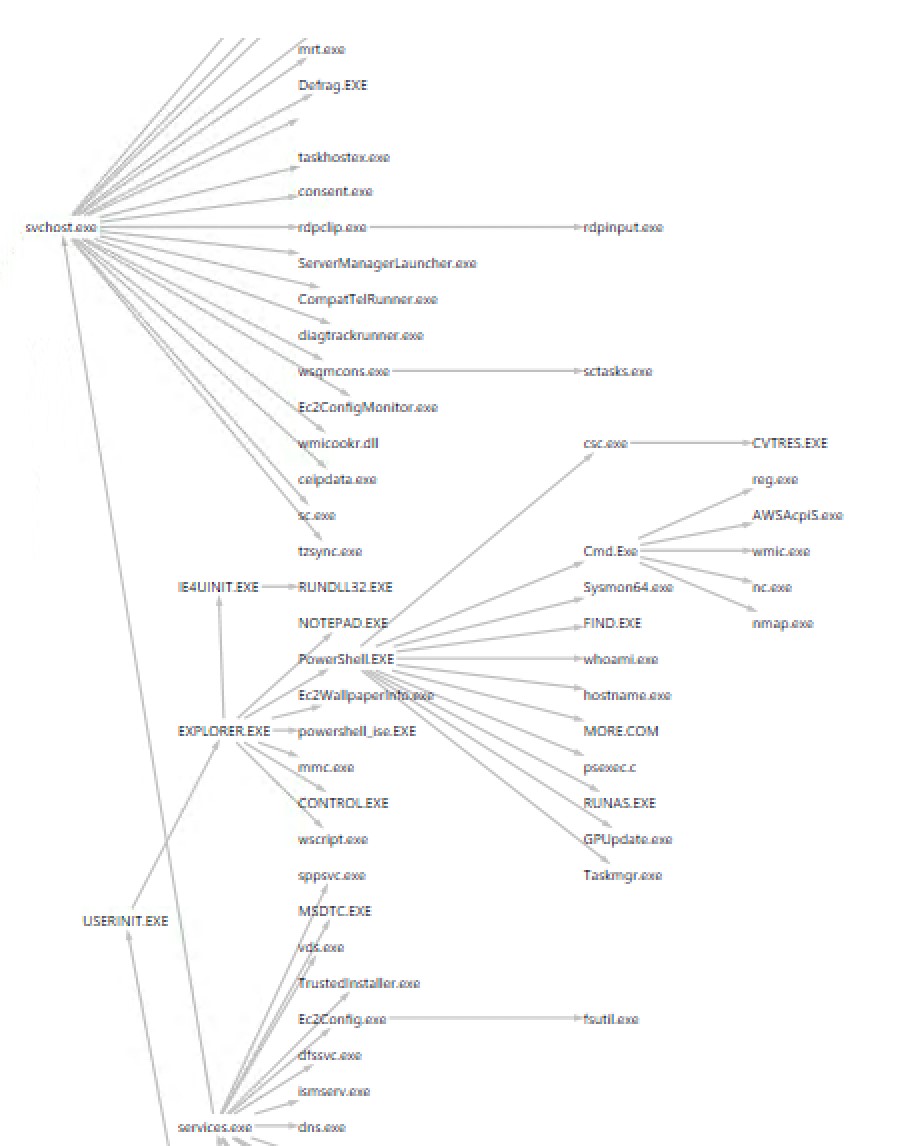
The PSQuickGraph tree view of my Sysmon threat graph. Pay attention to the anomalous branch under cmd.exe
However, we still want to keep track of the frequency of running processes. For example, if PowerShell launched "whoami" 1 time and 10 times the outdated Windows editor "Notepad.exe", then the graph edges that go from the PowerShell vertex should be marked with the corresponding "weights" of 1 and 10, respectively. Is it logical?
In many of the simplest threat detection algorithms, this weight becomes a metric for comparing the regions of the graph. The main point is that a subgraph with a lower average weight compared to the overall average weight is suspicious.
Is not it? The rarely visited summit is an anomalous zone. Therefore, if user actions in the analysis of potential threats go towards a rarely used subgraph, you should raise the alarm level to yellow.
The approach I describe and the PowerShell scripts below are not intended to be used for practical purposes for large infrastructures. But for a separate server, the solution may turn out to be working, or at least provide independent verification of those corporate solutions that you use.
Did I mention that Doug Finke's PowerShell algorithms for data structures are great and powerful tools? Without his work, I wouldn't have achieved anything in my anomaly graph project. Thanks again, Doug!
With the help of his PowerShell library of beautiful graph functions, I can easily calculate the weight of my Sysmon threat graph with just a few PS lines, and also find out the average vertex weight for the entire graph. As it traverses the graph, the code also assigns each vertex the weight of all its outgoing edges:
$AW=0 #average weight
$GW=0 #total weight

$mset = [System.Collections.ArrayList]@() #master set of subraphs
#calculate total weight by summing up the frequencies or weights of the edges
foreach ($e in $g.getAllEdges() ) {
    $GW = $GW + $e.weight
}
write-host "Weight of Graph: " $GW
$AW = $GW / $g.vertices.count
write-host "Average weight per vertex: " $AW

#assign weight of edges to vertice
for ($i=0; $i -lt $g.vertices.count; $i++) {
   $w=0
   $v=$g.vertices[$i]
   foreach($e in $v.getEdges()) {
      if($e -eq $null) {continue}
      $w=$w + $e.weight
   }
   $v.value.Weight = $w
}
The above code does the calculations we need. In this case, each vertex can be considered as the frequency of visits, depending on the outgoing edges.
The hardest part of my PowerShell anomaly graph script - which I'll show you shortly - is finding the regions of the graph that are least likely to occur, and then finding the largest subgraph that contains them. You may need to flip through an old computer science book to complete this task. But it's actually not that hard to write!
I used classical Breadth First Search for my graph by visiting each vertex, and then expanding it at the expense of neighboring vertices until my subgraph reaches a certain threshold depending on the average weight of the vertex. Like this:
function extend-subgraph($v, $t) {
    $vertexQueue = New-Object Queue

    #initialize
    $vertexQueue.enqueue($v)
    $h=$v.value.Weight
    $s=@() #subgraph
    $s+=$v
    $extend=$false
    while (!$vertexQueue.isEmpty()) { #bfs
        $currentVertex = $vertexQueue.dequeue()
        $es= $currentVertex.getEdges()
        foreach($e in $es) {
            $ev= $e.endVertex
            if ((($h + $ev.value.Weight)/($s.count+1) -lt $th)  {
                #extend the sub-graph
                $s+=$ev
                $h =$h + $ev.value.weight
                #queue it up
                $vertexQueue.enqueue($ev)
            }
        }
A quick note for DIY enthusiasts: to create an array of arrays, use the arraylist type and you will save yourself a lot of headache.
Low weight threats and subgraphs
There are many different algorithms for anomalous graphs. The one I used is based on a certain graphBAD that I found on the Internet - and I'll give a link as soon as I find it again.
In general, the main problem in practical threat detection is finding a good dataset to form a baseline. As a full-time blogger and party-time threat detection specialist, I never managed to create an interesting enough Sysmon log containing many different applications. It was quite difficult to generate anomalous subgraphs as I didn't have a large enough spread in weights. One way or another, when using a real server, you may end up with a much better set of data than occasional use of an AWS Windows instance, as in my case.
The PS script of anomalous graphs I wrote was quite capable of producing suspicious subgraphs with low average weights. And I even managed to catch some interesting environments (see below).

Subgraph Weights Algorithm in Action: An Interesting Environment with Low Subgraph 7 Weight
As I mentioned earlier, there are other algorithms for detecting anomalies in graphs with metrics other than simple weights that are worth learning. One of them looks for clusters of "similar" vertices and notices connections or connections between different environments. In this case, the anomaly lies in the user or process that connects the environments using some other characteristic. It makes sense, isn't it?
If your inner nerd is strong in you, you can check out SCAN(Structural Clustering Algorithm for Networks), which does the above. With Doug Finke's PowerShell algorithms, you can even use it. I myself want to take on this project and put it up soon on my GitHub .
Find anomalies through random walks
Let's end this section with another way to find anomalies in the threat graph. I referred to this approach at the end of the previous part . For me, as a person with mathematics on the "you", he is more intuitive. And fans of the old TV show numb3rs will immediately recognize the concept of [clearing throat] Markov chains.
For everyone else, you can think of this as a "random walk" through the graph. At each of the vertices, we roll a dice and select an edge of the graph depending on its weight: the greater the weight of the edge, the higher the chance that we will follow it. You need to split the graph into two parts - it's called a bipartite graph in graph theory - with users on one part and applications on the other.
Next, you rankall vertex applications that can be reached from the user based on the probability of reaching a particular vertex. To analyze the threat, you will then search for running applications, and if any of them have a very low probability of reaching them, then you may have found a real threat!
Plus a karma for someone who linked it to Google's PageRank algorithm. I'll describe this in more detail in the next section, but those interested can Google the phrase random walk with restart .
Random Traversal Theory and EQL Practice
Let's take another digression and analyze what we are trying to achieve with the Sysmon log, which is a great tool for detecting threats and conducting post-incident investigations.
- , Sysmon. Sysmon , .
- 2 Sysmon , , .
- In the third part, we delved into an overview of one simple algorithm that considers edge connections as weights. Sections of a graph weighing less (in terms of edges) than the total average weight over the entire graph can be a potential threat. I'm going to upload the PowerShell scripts of the algorithms from this section to my GitHub (after hovering over them).
The advantage of these methods is that they do not depend on specific commands or process names that attackers constantly change or mask.
In addition, there is another probability-based method for finding vulnerabilities. Let's take a closer look at it.
Accidental Traversal of Vulnerability Graph from Data Based on Sysmon Events
Instead of analyzing the structure of the graph itself, we can think of links as a path or roadmap, in which each application is a separate stop along the way. From the Sysmon log data, we can get the frequency at which each application starts from its parent.
If you look at my threat graph script on GitHub, you will find that this frequency is stored within each edge object using Doug Finke's wonderful PowerShell algorithms.

We can consider the frequency of crossing each of the edges of the vulnerability graph as a probability!
The next step is to use this information to find the likelihood of, say, launching a PowerShell application taskmgr.exe, a Windows process analyzer, notepad, or hostname.exe.
What am I getting at?
In short: I can create a probability transition matrix, so beloved by Markov followersand commonly used in modeling systems. In fact, rolling the dice, going to the next application in the graph, and repeating these actions is a random traversal of the graph. Ultimately, this mathematical method ranks each vertex of the graph according to the probability of getting there from the starting point. And you will find out that, say, launching spreadsheets from Windows Explorer is an extremely common process, and the Windows Script Host Engine is theoretically extremely non-standard and, accordingly, potentially a threat indicator.
This method is known as Random Walk With Restart (hereinafter - RWWR, random walk with restart) and is a variation of the now legendary Google PageRank ranking algorithm .
Let's take a look at a piece of script I wrote to calculate these ranks:
#lets build a row
$row= @(0)*$g.vertices.count
$w=0

foreach($e in $start.getEdges()) {    #calculate total frequency
    $w+=$e.weight
}
if ($w -eq 0)  {   #make it connected
$row[$ix] =1
}
else {  #we assign probabilitys
    #now create transition probability
    foreach($e in $start.getEdges()) {
        $ev = $e.endVertex
        $p = $e.weight
        $jx = v-index $ev.value.Key
        $row[$jx]= $p/$w #normalize by dividing by total
    }
}
$P[$ix] = $row  #yay! One row added to transition matrix
For each vertex, I calculate the resulting frequency of all neighbors and then assign the probability of each transition through the normalization by the total. Thus, if PowerShell.exe has 20 visits to all of its neighbors, but nc.exe has only been visited once from the top of PowerShell.exe, then the probability of going will be 1/20 or 0.05. Is it logical?
The difficulty lies in calculating the matrix used in RWWR, but for those who attended probabilistic modeling lessons, this procedure will not be difficult. There is a good review article on this subject on the Medium website .
My script, which I call random-rater , ranks and outputs the 10 smallestvalues from the list. In this way, you can get applications that have the lowest probability of being launched, starting from a given vertex of the threat graph. Here's the result when using PowerShell.exe as a starting point:
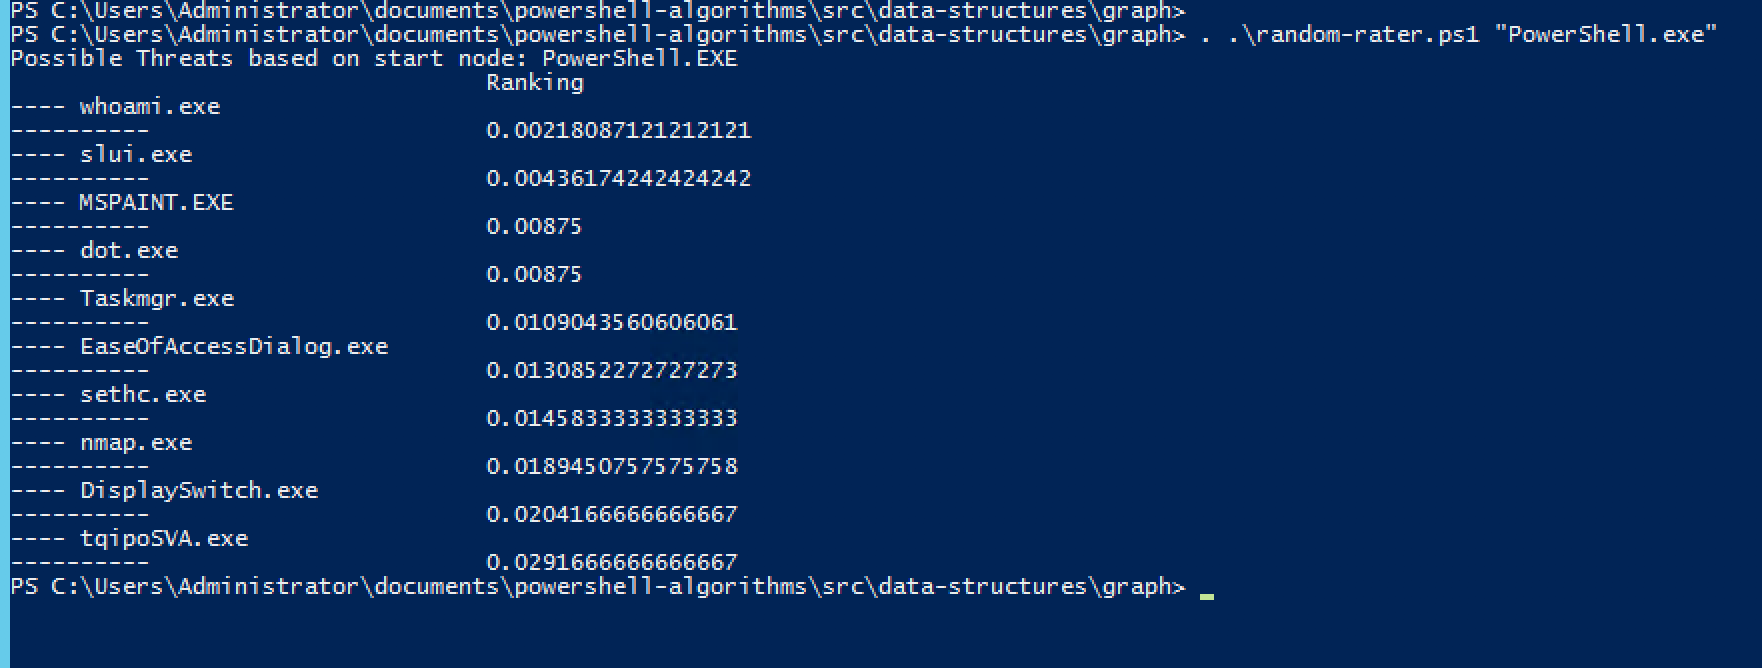
The Random Walk With Restart algorithm can produce a google-like ranking of threats. Hmmm, whoami is the least likely to run.
As a practical side note and warning, it's worth noting that PWWR will be a big data problem in a real system. Even in the case of my small Sysmon log, the calculation lag was quite noticeable due to the large number of floating point operations.
Event Query Language (EQL) for Threat Analysis
For now, it's worth noting that vendors using more sophisticated approaches to detect threats in their products go far beyond what you or I can do on your own. And, definitely, with much higher accuracy.
For those who want to dive into the topic of threat detection, but do not want to work with my scripts - I understand! - there is Event Query Language , or EQL . This is an open source project to apply the Sysmon Log Query Language, which you can learn more about in the extremely comprehensive post... EQL is not only great for investigating incidents, but it can also be used as a tool as long as you have some recent copy of the Sysmon log.
The EQL suite provides an event handler that converts the log into human-readable JSON. You can check out a copy of my branch on GitHub. Unlike my static show-threat-path PS script, EQL allows you to make queries on the fly.
Let's say that I am interested in all cmd.exe shells that were launched on behalf of scvhost.exe - this may be a sign of the attacker's use of psexec.exe or smb.exe. The request will look like this:

Using EQL to find shells cmd.exe launched from svchost.exe. By the way, jq is a Linux utility for displaying JSON data.
There is an even cooler and more powerful way to get this result using the child modifier. This EQL query allows you to search across all processes with a specified ancestor, anywhere in the hierarchy. For example, you can search for applications that, say, had the regsvr32.exe process as an ancestor and may have exploited a well-known vulnerability that I described here .
There is too much to say about EQL in this already long post, so I'd rather publish a separate article on the details of EQL skills for finding vulnerabilities.
Final thoughts on DIY threat detection solutions
I promised to download the Sysmon repository with all the threat detection scripts described in this article. Check back on my GitHub periodically as I will be adding new graph-based threat detection tools over time, along with additional documentation - too much to cover in one article.
You made it to this place, congratulations!
Try my scripts or use them as a basis for developing your own threat detection ideas. PowerShell is fine for complex algorithms. For me, who grew up in the Linux shell language, it was a pleasant surprise to work with a mature scripting language. And I advise you to check out the PowerShell Gallery, another great resource for ready-made battle scripts: you don't have to reinvent the wheel in the PowerShell world.
Another more important takeaway from the entire article will be the realization that vendors of enterprise-grade solutions not only use much more sophisticated threat detection technologies than those that an IT developer can write in their free time, but also the adaptability of these solutions to work with traffic level large organization. Of course, using DIY solutions to analyze an underutilized server or additional validation of enterprise products is a good idea. But threat intelligence and identification is indeed a big data problem , and obviously not a challenge PowerShell can solve.
If you are interested in the opportunity to learn more about how Varonis deals with the task of analyzing and detecting threats, you can always request a personal demo .