In this article, I will tell you about the main BigQuery functions and show their capabilities with specific examples. You can write basic queries and try them out on demo data.
What is SQL and what dialects it has
SQL (Structured Query Language) is a structured query language for working with databases. With its help, you can receive, add to the database and modify large amounts of data. Google BigQuery supports two dialects: Standard SQL and legacy SQL.
Which dialect to choose depends on your preference, but Google recommends using Standard SQL due to a number of advantages:
- Flexibility and functionality when working with nested and repeating fields.
- Support for DML and DDL languages , which allow you to change data in tables, as well as manipulate tables and views in GBQ.
- Processing large amounts of data is faster than Legasy SQL.
- Support for all current and future BigQuery updates.
You can learn more about the difference between dialects in the help .
By default, Google BigQuery queries run against Legacy SQL.
There are several ways to switch to Standard SQL:
- In the BigQuery interface, in the query editing window, select "Show Options" and uncheck the box next to the "Use Legacy SQL" option

- Add the #standardSQL line before the query and start the query on a new line

Where to begin
So that you can practice running queries in parallel with reading the article, I have prepared a table with demo data for you . Load the data from the spreadsheet into your Google BigQuery project.
If you don't already have a GBQ project, create one. To do this, you need an active billing account in the Google Cloud Platform . You will need to link the card, but without your knowledge, money will not be debited from it, moreover, upon registration, you will receive $ 300 for 12 months , which you can spend on storing and processing data.
Google BigQuery features
The most commonly used groups of functions when building queries are Aggregate function, Date function, String function, and Window function. Now more about each of them.
Aggregate function
Aggregation functions allow you to get summary values across the entire table. For example, calculate the average check, total monthly income, or highlight the segment of users who made the maximum number of purchases.
Here are the most popular features from this section:
| Legacy SQL | Standard SQL | What the function does |
|---|---|---|
| AVG (field) | AVG ([DISTINCT] (field)) | Returns the average of the field column. In Standard SQL, when adding the DISTINCT clause, the average is calculated only for rows with unique (non-duplicate) values from the field column |
| MAX (field) | MAX (field) | Returns the maximum value from the field column |
| MIN (field) | MIN (field) | Returns the minimum value from the field column |
| SUM (field) | SUM (field) | Returns the sum of values from the field column |
| COUNT (field) | COUNT (field) | Returns the number of rows in column field |
| EXACT_COUNT_DISTINCT (field) | COUNT ([DISTINCT] (field)) | Returns the number of unique rows in the field column |
For a list of all functions, see the Help: Legacy SQL and Standard SQL .
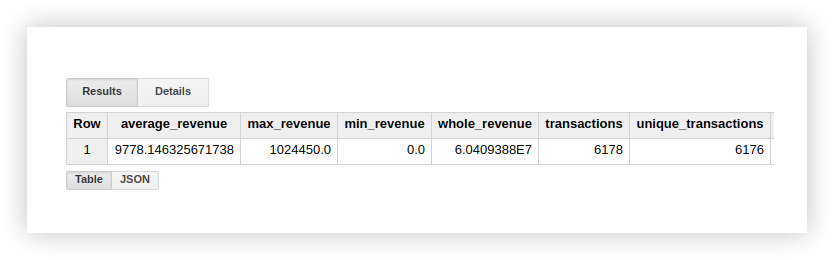
Let's see how the listed functions work with an example data demo. Let's calculate the average income from transactions, purchases with the highest and lowest amount, total income and the number of all transactions. To check if purchases are duplicated, we will also calculate the number of unique transactions. To do this, we write a query in which we indicate the name of our Google BigQuery project, dataset and table.
#legasy SQL
SELECT
  AVG(revenue) as average_revenue,
  MAX(revenue) as max_revenue,
  MIN(revenue) as min_revenue,
  SUM(revenue) as whole_revenue,
  COUNT(transactionId) as transactions,
  EXACT_COUNT_DISTINCT(transactionId) as unique_transactions
FROM
  [owox-analytics:t_kravchenko.Demo_data]
#standard SQL
SELECT
  AVG(revenue) as average_revenue,
  MAX(revenue) as max_revenue,
  MIN(revenue) as min_revenue,
  SUM(revenue) as whole_revenue,
  COUNT(transactionId) as transactions,
  COUNT(DISTINCT(transactionId)) as unique_transactions
FROM
  `owox-analytics.t_kravchenko.Demo_data`
As a result, we get the following results:
You can check the calculation results in the original table with demo data using standard Google Sheets functions (SUM, AVG and others) or pivot tables.
As you can see from the screenshot above, the number of transactions and unique transactions is different.
This suggests that there are 2 transactions in our table with a duplicate transactionId:
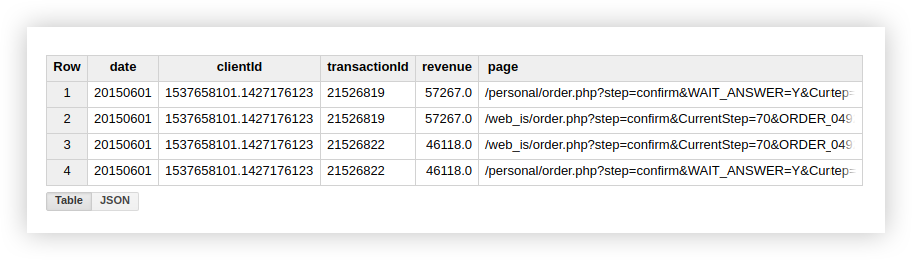
Therefore, if you are interested in unique transactions, use the function that counts unique rows. Alternatively, you can group the data using a GROUP BY clause to get rid of duplicates before using the aggregation function.
Functions for working with dates (Date function)
These functions allow you to process dates: change their format, select the required part (day, month or year), shift the date by a certain interval.
They can be useful to you in the following cases:
- When setting up end-to-end analytics - to bring dates and times from different sources to a single format.
- When creating automatically updated reports or triggered mailings. For example, when you need data for the last 2 hours, a week or a month.
- When creating cohort reports in which it is necessary to obtain data in the context of days, weeks, months.
Most commonly used date functions:
| Legacy SQL | Standard SQL | What the function does |
|---|---|---|
| CURRENT_DATE () | CURRENT_DATE () | Returns the current date in the format% YYYY-% MM-% DD |
| DATE (timestamp) | DATE (timestamp) | Converts a date from the format% YYYY-% MM-% DD% H:% M:% S. in the format% YYYY-% MM-% DD |
| DATE_ADD (timestamp, interval, interval_units) | DATE_ADD(timestamp, INTERVAL interval interval_units) | timestamp, interval.interval_units.
Legacy SQL YEAR, MONTH, DAY, HOUR, MINUTE SECOND, Standard SQL — YEAR, QUARTER, MONTH, WEEK, DAY |
| DATE_ADD(timestamp, — interval, interval_units) | DATE_SUB(timestamp, INTERVAL interval interval_units) | timestamp, interval |
| DATEDIFF(timestamp1, timestamp2) | DATE_DIFF(timestamp1, timestamp2, date_part) | timestamp1 timestamp2.
Legacy SQL , Standard SQL — date_part (, , , , ) |
| DAY(timestamp) | EXTRACT(DAY FROM timestamp) | timestamp. 1 31 |
| MONTH(timestamp) | EXTRACT(MONTH FROM timestamp) | timestamp. 1 12 |
| YEAR(timestamp) | EXTRACT(YEAR FROM timestamp) | timestamp |
For a list of all features, see the Legacy SQL and Standard SQL Help .
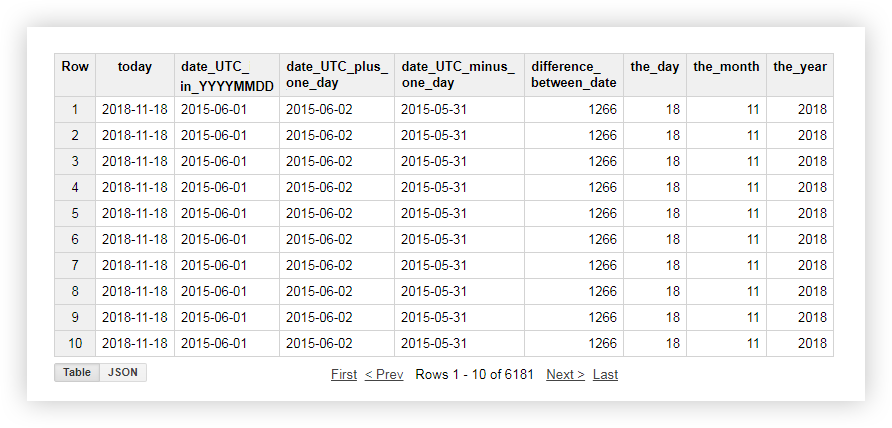
Let's look at a demo of the data, how each of the above functions works. For example, we get the current date, bring the date from the original table into the format% YYYY-% MM-% DD, subtract and add one day to it. Then we calculate the difference between the current date and the date from the original table and divide the current date separately into year, month and day. To do this, you can copy the example queries below and replace the name of the project, dataset and data table with your own.
#legasy SQL
SELECT
    CURRENT_DATE() AS today,
    DATE( date_UTC ) AS date_UTC_in_YYYYMMDD,
    DATE_ADD( date_UTC,1, 'DAY') AS date_UTC_plus_one_day,
    DATE_ADD( date_UTC,-1, 'DAY') AS date_UTC_minus_one_day,
    DATEDIFF(CURRENT_DATE(), date_UTC ) AS difference_between_date,
    DAY( CURRENT_DATE() ) AS the_day,
    MONTH( CURRENT_DATE()) AS the_month,
    YEAR( CURRENT_DATE()) AS the_year
  FROM
    [owox-analytics:t_kravchenko.Demo_data]
#standard SQL
SELECT
  today,
  date_UTC_in_YYYYMMDD,
  DATE_ADD( date_UTC_in_YYYYMMDD, INTERVAL 1 DAY) AS date_UTC_plus_one_day,
  DATE_SUB( date_UTC_in_YYYYMMDD,INTERVAL 1 DAY) AS date_UTC_minus_one_day,
  DATE_DIFF(today, date_UTC_in_YYYYMMDD, DAY) AS difference_between_date,
  EXTRACT(DAY FROM today ) AS the_day,
  EXTRACT(MONTH FROM today ) AS the_month,
  EXTRACT(YEAR FROM today ) AS the_year
FROM (
  SELECT
    CURRENT_DATE() AS today,
    DATE( date_UTC ) AS date_UTC_in_YYYYMMDD
  FROM
    `owox-analytics.t_kravchenko.Demo_data`)
After applying the request, you will receive the following report:
Functions for working with strings (String function)
String functions allow you to form a string, highlight and replace substrings, calculate the length of the string and the ordinal index of the substring in the original string.
For example, with their help you can:
- Make filters in the report by UTM tags that are passed to the page URL.
- Bring the data to a uniform format if the names of sources and campaigns are written in different registers.
- Replace incorrect data in the report, for example, if the campaign name was sent with a typo.
The most popular functions for working with strings:
| Legacy SQL | Standard SQL | What the function does |
|---|---|---|
| CONCAT ('str1', 'str2') or 'str1' + 'str2' | CONCAT ('str1', 'str2') | Concatenates multiple strings 'str1' and 'str2' into one |
| 'str1' CONTAINS 'str2' | REGEXP_CONTAINS('str1', 'str2') 'str1' LIKE ‘%str2%’ | true 'str1' ‘str2’.
Standard SQL ‘str2’ re2 |
| LENGTH('str' ) | CHAR_LENGTH('str' )
CHARACTER_LENGTH('str' ) |
'str' ( ) |
| SUBSTR('str', index [, max_len]) | SUBSTR('str', index [, max_len]) | max_len, index 'str' |
| LOWER('str') | LOWER('str') | 'str' |
| UPPER(str) | UPPER(str) | 'str' |
| INSTR('str1', 'str2') | STRPOS('str1', 'str2') | Returns the index of the first occurrence of string 'str2' in string 'str1', otherwise - 0 |
| REPLACE ('str1', 'str2', 'str3') | REPLACE ('str1', 'str2', 'str3') | Replaces in string 'str1' substring 'str2' with substring 'str3' |
More details - in the help: Legacy SQL and Standard SQL .
Let's look at the example of demo data how to use the described functions. Suppose we have 3 separate columns that contain the values of the day, month and year:
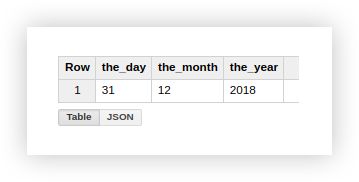
Working with a date in this format is not very convenient, so we will combine it into one column. To do this, use the SQL queries below, and don't forget to include the name of your project, dataset, and Google BigQuery table.
#legasy SQL
SELECT
  CONCAT(the_day,'-',the_month,'-',the_year) AS mix_string1,
  the_day+'-'+the_month+'-'+the_year AS mix_string2
FROM (
  SELECT
    '31' AS the_day,
    '12' AS the_month,
    '2018' AS the_year
  FROM
    [owox-analytics:t_kravchenko.Demo_data])
GROUP BY
  mix_string1,
  mix_string2
#standard SQL
SELECT
  CONCAT(the_day,'-',the_month,'-',the_year) AS mix_string1
FROM (
  SELECT
    '31' AS the_day,
    '12' AS the_month,
    '2018' AS the_year
  FROM
    `owox-analytics.t_kravchenko.Demo_data`)
GROUP BY
  mix_string1
After executing the request, we will get the date in one column:

Often, when loading a specific page on the site, the URL contains the values of the variables that the user has selected. This can be a method of payment or delivery, a transaction number, an index of a physical store where a customer wants to pick up an item, etc. Using an SQL query, you can extract these parameters from the page address.
Let's look at two examples of how and why to do this.
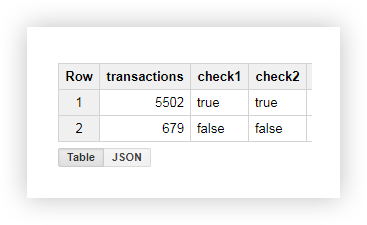
Example 1 . Let's say we want to know the number of purchases at which users pick up items from physical stores. To do this, you need to count the number of transactions sent from pages whose URL contains the substring shop_id (index of the physical store). We do this using the following queries:
#legasy SQL
SELECT
  COUNT(transactionId) AS transactions,
  check
FROM (
  SELECT
    transactionId,
    page CONTAINS 'shop_id' AS check
  FROM
    [owox-analytics:t_kravchenko.Demo_data])
GROUP BY
  check
#standard SQL
SELECT
  COUNT(transactionId) AS transactions,
  check1,
  check2
FROM (
  SELECT
    transactionId,
    REGEXP_CONTAINS( page, 'shop_id') AS check1,
    page LIKE '%shop_id%' AS check2
  FROM
    `owox-analytics.t_kravchenko.Demo_data`)
GROUP BY
  check1,
  check2
From the resulting table, we see that 5502 transactions were sent from the pages containing the shop_id (check = true):
Example 2 . Suppose you assigned your delivery_id to each delivery method and write the value of this parameter in the page URL. To find out which delivery method the user has chosen, select delivery_id in a separate column.
We use the following queries for this:
#legasy SQL
SELECT
  page_lower_case,
  page_length,
  index_of_delivery_id,
  selected_delivery_id,
  REPLACE(selected_delivery_id, 'selected_delivery_id=', '') as delivery_id
FROM (
  SELECT
    page_lower_case,
    page_length,
    index_of_delivery_id,
    SUBSTR(page_lower_case, index_of_delivery_id) AS selected_delivery_id
  FROM (
    SELECT
      page_lower_case,
      LENGTH(page_lower_case) AS page_length,
      INSTR(page_lower_case, 'selected_delivery_id') AS index_of_delivery_id
    FROM (
      SELECT
        LOWER( page) AS page_lower_case,
        UPPER( page) AS page_upper_case
      FROM
        [owox-analytics:t_kravchenko.Demo_data])))
ORDER BY
  page_lower_case ASC
#standard SQL
SELECT
  page_lower_case,
  page_length,
  index_of_delivery_id,
  selected_delivery_id,
  REPLACE(selected_delivery_id, 'selected_delivery_id=', '') AS delivery_id
FROM (
  SELECT
    page_lower_case,
    page_length,
    index_of_delivery_id,
    SUBSTR(page_lower_case, index_of_delivery_id) AS selected_delivery_id
  FROM (
    SELECT
      page_lower_case,
      CHAR_LENGTH(page_lower_case) AS page_length,
      STRPOS(page_lower_case, 'selected_delivery_id') AS index_of_delivery_id
    FROM (
      SELECT
        LOWER( page) AS page_lower_case,
        UPPER( page) AS page_upper_case
      FROM
        `owox-analytics.t_kravchenko.Demo_data`)))
ORDER BY
  page_lower_case ASC
As a result, we get the following table in Google BigQuery:

Functions for working with subsets of data or window functions (Window function)
These functions are similar to the aggregation functions we discussed above. Their main difference is that calculations are performed not on the entire set of data selected using a query, but on a part of it - a subset or window.
Using window functions, you can aggregate data by groups without using the JOIN operator to combine multiple queries. For example, calculate the average income by advertising campaigns, the number of transactions by device. By adding another field to the report, you can easily find out, for example, the share of revenue from an advertising campaign on Black Friday or the share of transactions made from a mobile application.
Together with each function, an OVER expression must be written in the request, which defines the window boundaries. OVER contains 3 components that you can work with:
- PARTITION BY - defines the attribute by which you will divide the source data into subsets, for example PARTITION BY clientId, DayTime.
- ORDER BY - defines the order of the rows in the subset, for example ORDER BY hour DESC.
- WINDOW FRAME - allows you to process rows within a subset according to a specific characteristic. For example, you can calculate the sum of not all lines in the window, but only the first five before the current line.
This table summarizes the most commonly used window functions:
| Legacy SQL | Standard SQL | What the function does |
|---|---|---|
| AVG (field)
COUNT (field) COUNT (DISTINCT field) MAX () MIN () SUM () |
AVG ([DISTINCT] (field))
COUNT (field) COUNT ([DISTINCT] (field)) MAX (field) MIN (field) SUM (field) |
, , , field .
DISTINCT , () |
| 'str1' CONTAINS 'str2' | REGEXP_CONTAINS('str1', 'str2') 'str1' LIKE ‘%str2%’ | true 'str1' ‘str2’.
Standard SQL ‘str2’ re2 |
| DENSE_RANK() | DENSE_RANK() | |
| FIRST_VALUE(field) | FIRST_VALUE (field[{RESPECT | IGNORE} NULLS]) | field .
field . RESPECT IGNORE NULLS , NULL |
| LAST_VALUE(field) | LAST_VALUE (field [{RESPECT | IGNORE} NULLS]) | field .
field . RESPECT IGNORE NULLS , NULL |
| LAG(field) | LAG (field[, offset [, default_expression]]) | field .
Offset , . . Default_expression — , , |
| LEAD(field) | LEAD (field[, offset [, default_expression]]) | field .
Offset , . . Default_expression — , , |
You can see a list of all functions in the help for Legacy SQL and for Standard SQL: Aggregate Analytic Functions , Navigation Functions .
Example 1. Let's say we want to analyze the activity of customers during working and non-working hours. To do this, it is necessary to divide transactions into 2 groups and calculate the metrics we are interested in:
- Group 1 - purchases during business hours from 9:00 to 18:00.
- Group 2 - purchases outside working hours from 00:00 to 9:00 and from 18:00 to 00:00.
In addition to working and non-working hours, another sign for the formation of a window will be the clientId, that is, for each user we will have two windows:
| Subset (window) | clientId | DayTime |
|---|---|---|
| 1 window | clientId 1 | Work time |
| 2 window | clientId 2 | Non-working hours |
| 3 window | clientId 3 | Work time |
| 4 window | clientId 4 | Non-working hours |
| N window | clientId N | Work time |
| N + 1 window | clientId N + 1 | Non-working hours |
Let's calculate the average, maximum, minimum, and total income, the number of transactions and the number of unique transactions for each user during working and non-working hours on the demo data. The queries below will help us to do this.
#legasy SQL
SELECT
  date,
  clientId,
  DayTime,
  avg_revenue,
  max_revenue,
  min_revenue,
  sum_revenue,
  transactions,
  unique_transactions
FROM (
  SELECT
    date,
    clientId,
    DayTime,
    AVG(revenue) OVER (PARTITION BY date, clientId, DayTime) AS avg_revenue,
    MAX(revenue) OVER (PARTITION BY date, clientId, DayTime) AS max_revenue,
    MIN(revenue) OVER (PARTITION BY date, clientId, DayTime) AS min_revenue,
    SUM(revenue) OVER (PARTITION BY date, clientId, DayTime) AS sum_revenue,
    COUNT(transactionId) OVER (PARTITION BY date, clientId, DayTime) AS transactions,
    COUNT(DISTINCT(transactionId)) OVER (PARTITION BY date, clientId, DayTime) AS unique_transactions
  FROM (
    SELECT
      date,
      date_UTC,
      clientId,
      transactionId,
      revenue,
      page,
      hour,
      CASE
        WHEN hour>=9 AND hour<=18 THEN ' '
        ELSE ' '
      END AS DayTime
    FROM
      [owox-analytics:t_kravchenko.Demo_data]))
GROUP BY
  date,
  clientId,
  DayTime,
  avg_revenue,
  max_revenue,
  min_revenue,
  sum_revenue,
  transactions,
  unique_transactions
ORDER BY
  transactions DESC
#standard SQL
SELECT
  date,
  clientId,
  DayTime,
  avg_revenue,
  max_revenue,
  min_revenue,
  sum_revenue,
  transactions,
  unique_transactions
FROM (
  SELECT
    date,
    clientId,
    DayTime,
    AVG(revenue) OVER (PARTITION BY date, clientId, DayTime) AS avg_revenue,
    MAX(revenue) OVER (PARTITION BY date, clientId, DayTime) AS max_revenue,
    MIN(revenue) OVER (PARTITION BY date, clientId, DayTime) AS min_revenue,
    SUM(revenue) OVER (PARTITION BY date, clientId, DayTime) AS sum_revenue,
    COUNT(transactionId) OVER (PARTITION BY date, clientId, DayTime) AS transactions,
    COUNT(DISTINCT(transactionId)) OVER (PARTITION BY date, clientId, DayTime) AS unique_transactions
  FROM (
    SELECT
      date,
      date_UTC,
      clientId,
      transactionId,
      revenue,
      page,
      hour,
      CASE
        WHEN hour>=9 AND hour<=18 THEN ' '
        ELSE ' '
      END AS DayTime
    FROM
      `owox-analytics.t_kravchenko.Demo_data`))
GROUP BY
  date,
  clientId,
  DayTime,
  avg_revenue,
  max_revenue,
  min_revenue,
  sum_revenue,
  transactions,
  unique_transactions
ORDER BY
  transactions DESC
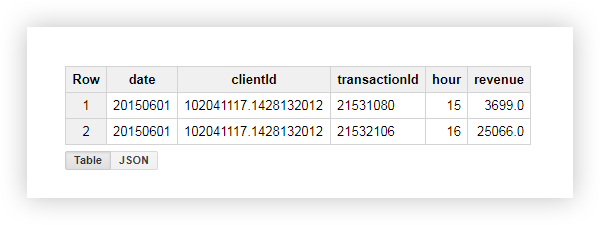
Let's see what happened as a result, using the example of one of the users with clientId = '102041117.1428132012 ′. In the initial table for this user, we had the following data:
By applying the query, we received a report that contains the average, minimum, maximum and total income from this user, as well as the number of transactions. As you can see in the screenshot below, the user made both transactions during business hours:

Example 2 . Now let's complicate the task a little:
- Let's put down the serial numbers for all transactions in the window, depending on the time of their execution. Recall that we define the window by user and working / non-working time.
- Let's display the income of the next / previous transaction (relative to the current one) within the window.
- Let's display the income of the first and last transactions in the window.
For this we use the following queries:
#legasy SQL
SELECT
  date,
  clientId,
  DayTime,
  hour,
  rank,
  revenue,
  lead_revenue,
  lag_revenue,
  first_revenue_by_hour,
  last_revenue_by_hour
FROM (
  SELECT
    date,
    clientId,
    DayTime,
    hour,
    DENSE_RANK() OVER (PARTITION BY date, clientId, DayTime ORDER BY hour) AS rank,
    revenue,
    LEAD( revenue, 1) OVER (PARTITION BY date, clientId, DayTime ORDER BY hour) AS lead_revenue,
    LAG( revenue, 1) OVER (PARTITION BY date, clientId, DayTime ORDER BY hour) AS lag_revenue,
    FIRST_VALUE(revenue) OVER (PARTITION BY date, clientId, DayTime ORDER BY hour) AS first_revenue_by_hour,
    LAST_VALUE(revenue) OVER (PARTITION BY date, clientId, DayTime ORDER BY hour) AS last_revenue_by_hour
  FROM (
    SELECT
      date,
      date_UTC,
      clientId,
      transactionId,
      revenue,
      page,
      hour,
      CASE
        WHEN hour>=9 AND hour<=18 THEN ' '
        ELSE ' '
      END AS DayTime
    FROM
      [owox-analytics:t_kravchenko.Demo_data]))
GROUP BY
  date,
  clientId,
  DayTime,
  hour,
  rank,
  revenue,
  lead_revenue,
  lag_revenue,
  first_revenue_by_hour,
  last_revenue_by_hour
ORDER BY
  date,
  clientId,
  DayTime,
  hour,
  rank,
  revenue,
  lead_revenue,
  lag_revenue,
  first_revenue_by_hour,
  last_revenue_by_hour
#standard SQL
SELECT
  date,
  clientId,
  DayTime,
  hour,
  rank,
  revenue,
  lead_revenue,
  lag_revenue,
  first_revenue_by_hour,
  last_revenue_by_hour
FROM (
  SELECT
    date,
    clientId,
    DayTime,
    hour,
    DENSE_RANK() OVER (PARTITION BY date, clientId, DayTime ORDER BY hour) AS rank,
    revenue,
    LEAD( revenue, 1) OVER (PARTITION BY date, clientId, DayTime ORDER BY hour) AS lead_revenue,
    LAG( revenue, 1) OVER (PARTITION BY date, clientId, DayTime ORDER BY hour) AS lag_revenue,
    FIRST_VALUE(revenue) OVER (PARTITION BY date, clientId, DayTime ORDER BY hour) AS first_revenue_by_hour,
    LAST_VALUE(revenue) OVER (PARTITION BY date, clientId, DayTime ORDER BY hour) AS last_revenue_by_hour
  FROM (
    SELECT
      date,
      date_UTC,
      clientId,
      transactionId,
      revenue,
      page,
      hour,
      CASE
        WHEN hour>=9 AND hour<=18 THEN ' '
        ELSE ' '
      END AS DayTime
    FROM
      `owox-analytics.t_kravchenko.Demo_data`))
GROUP BY
  date,
  clientId,
  DayTime,
  hour,
  rank,
  revenue,
  lead_revenue,
  lag_revenue,
  first_revenue_by_hour,
  last_revenue_by_hour
ORDER BY
  date,
  clientId,
  DayTime,
  hour,
  rank,
  revenue,
  lead_revenue,
  lag_revenue,
  first_revenue_by_hour,
  last_revenue_by_hour
Let's check the calculation results using the example of a user already familiar to us with clientId = '102041117.1428132012 ′:

From the screenshot above, we see that:
- The first transaction was at 15:00 and the second was at 16:00.
- After the current transaction at 15:00, there was a transaction at 16:00, the income of which is 25066 (column lead_revenue).
- Before the current transaction at 4:00 pm, there was a transaction at 3:00 pm with a revenue of 3699 (column lag_revenue).
- The first transaction within the window was a transaction at 15:00, the income for which is 3699 (column first_revenue_by_hour).
- The request processes the data line by line, therefore, for the transaction under consideration, it will be the last in the window and the values in the last_revenue_by_hour and revenue columns will be the same.
conclusions
In this article, we have covered the most popular functions from the sections Aggregate function, Date function, String function, Window function. However, Google BigQuery has many more useful features, for example:
- Casting functions - allow you to cast data to a specific format.
- Table wildcard functions - allow you to access multiple tables from a dataset.
- Regular expression functions - allow you to describe the model of a search query, and not its exact value.
Write in the comments if it makes sense to write in the same detail about them.