Today, we will tell you, without reference to specific models of network equipment, how the principle "from automation to autonomy" is embodied in the new capabilities of the FabricInsight product. Indeed, in recent years, not only has its composition changed, but also numerous new scenarios have appeared that make it possible to determine the current state of the network and predict possible problems in it.
Four stages of data center development
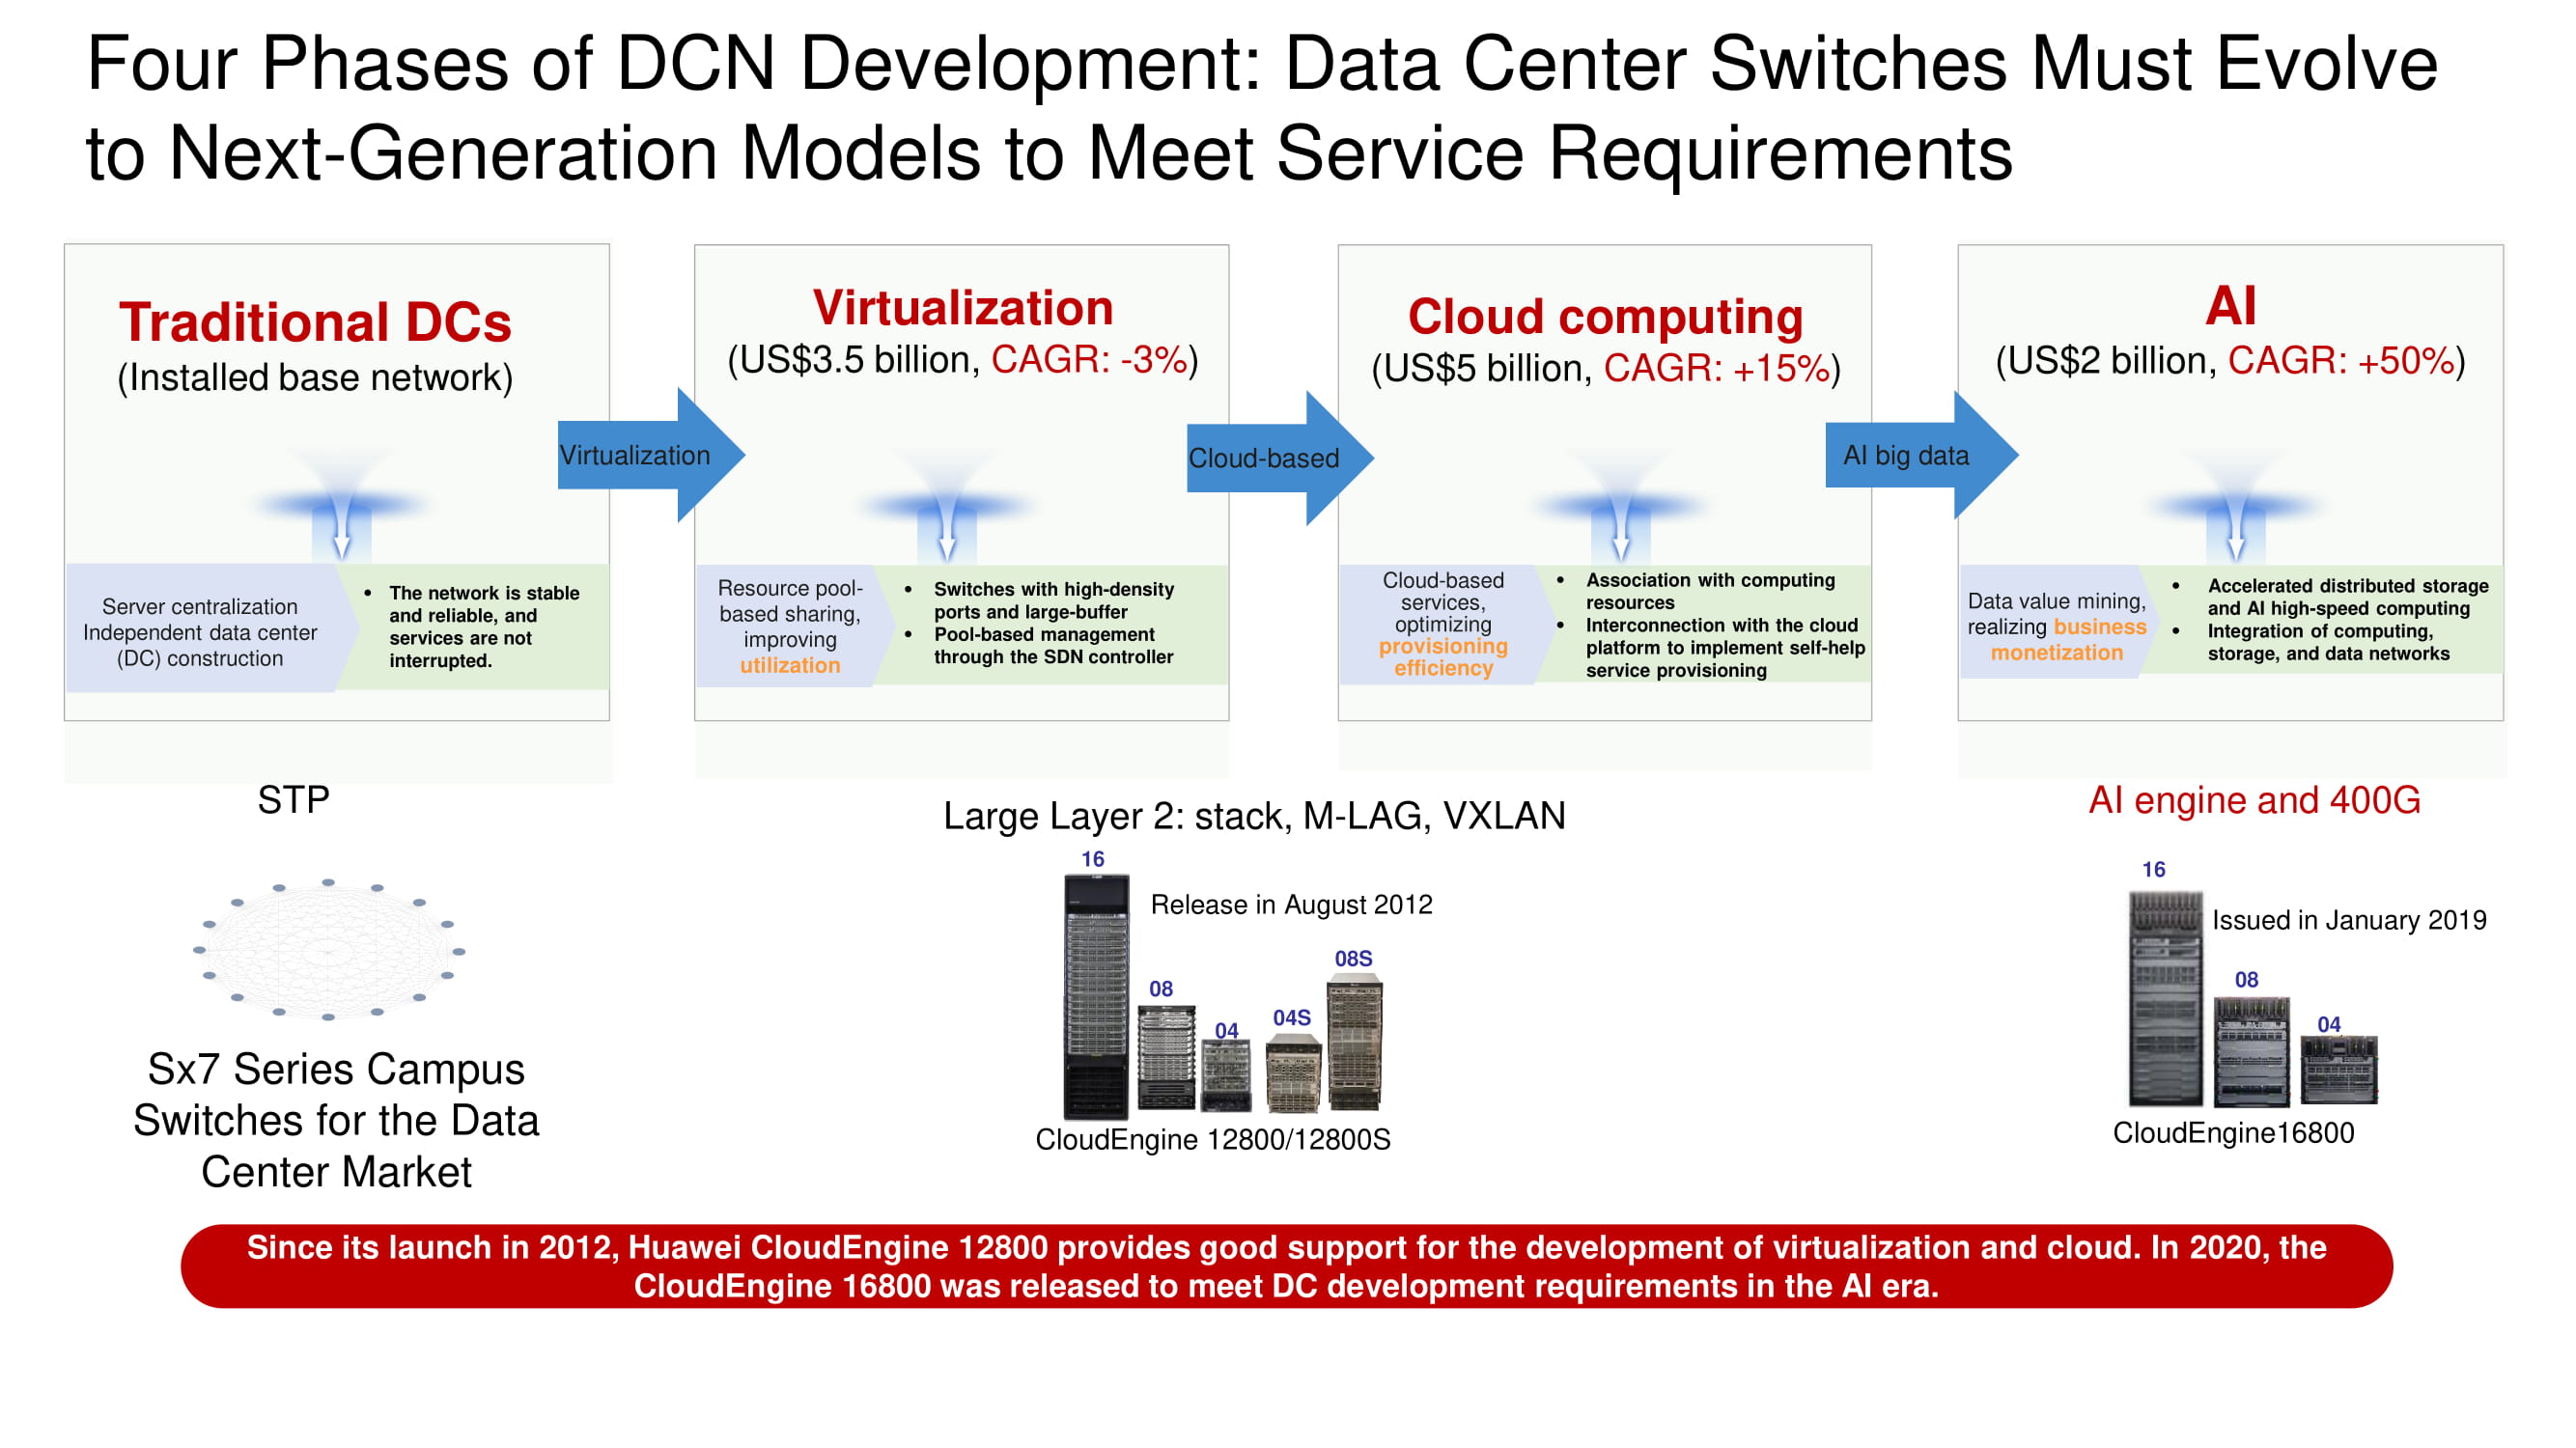
Determining the vector of development of data center networks, it is easy to see how traditional data center architectures gradually fell under the onslaught of virtualization systems, then survived a massive migration of resources and services to the clouds, and now came close to the widespread introduction of artificial intelligence systems and high-speed interfaces of 400 Gbps. AI capabilities are needed to build lossless Ethernet networks and create applications that are completely immune to latency.
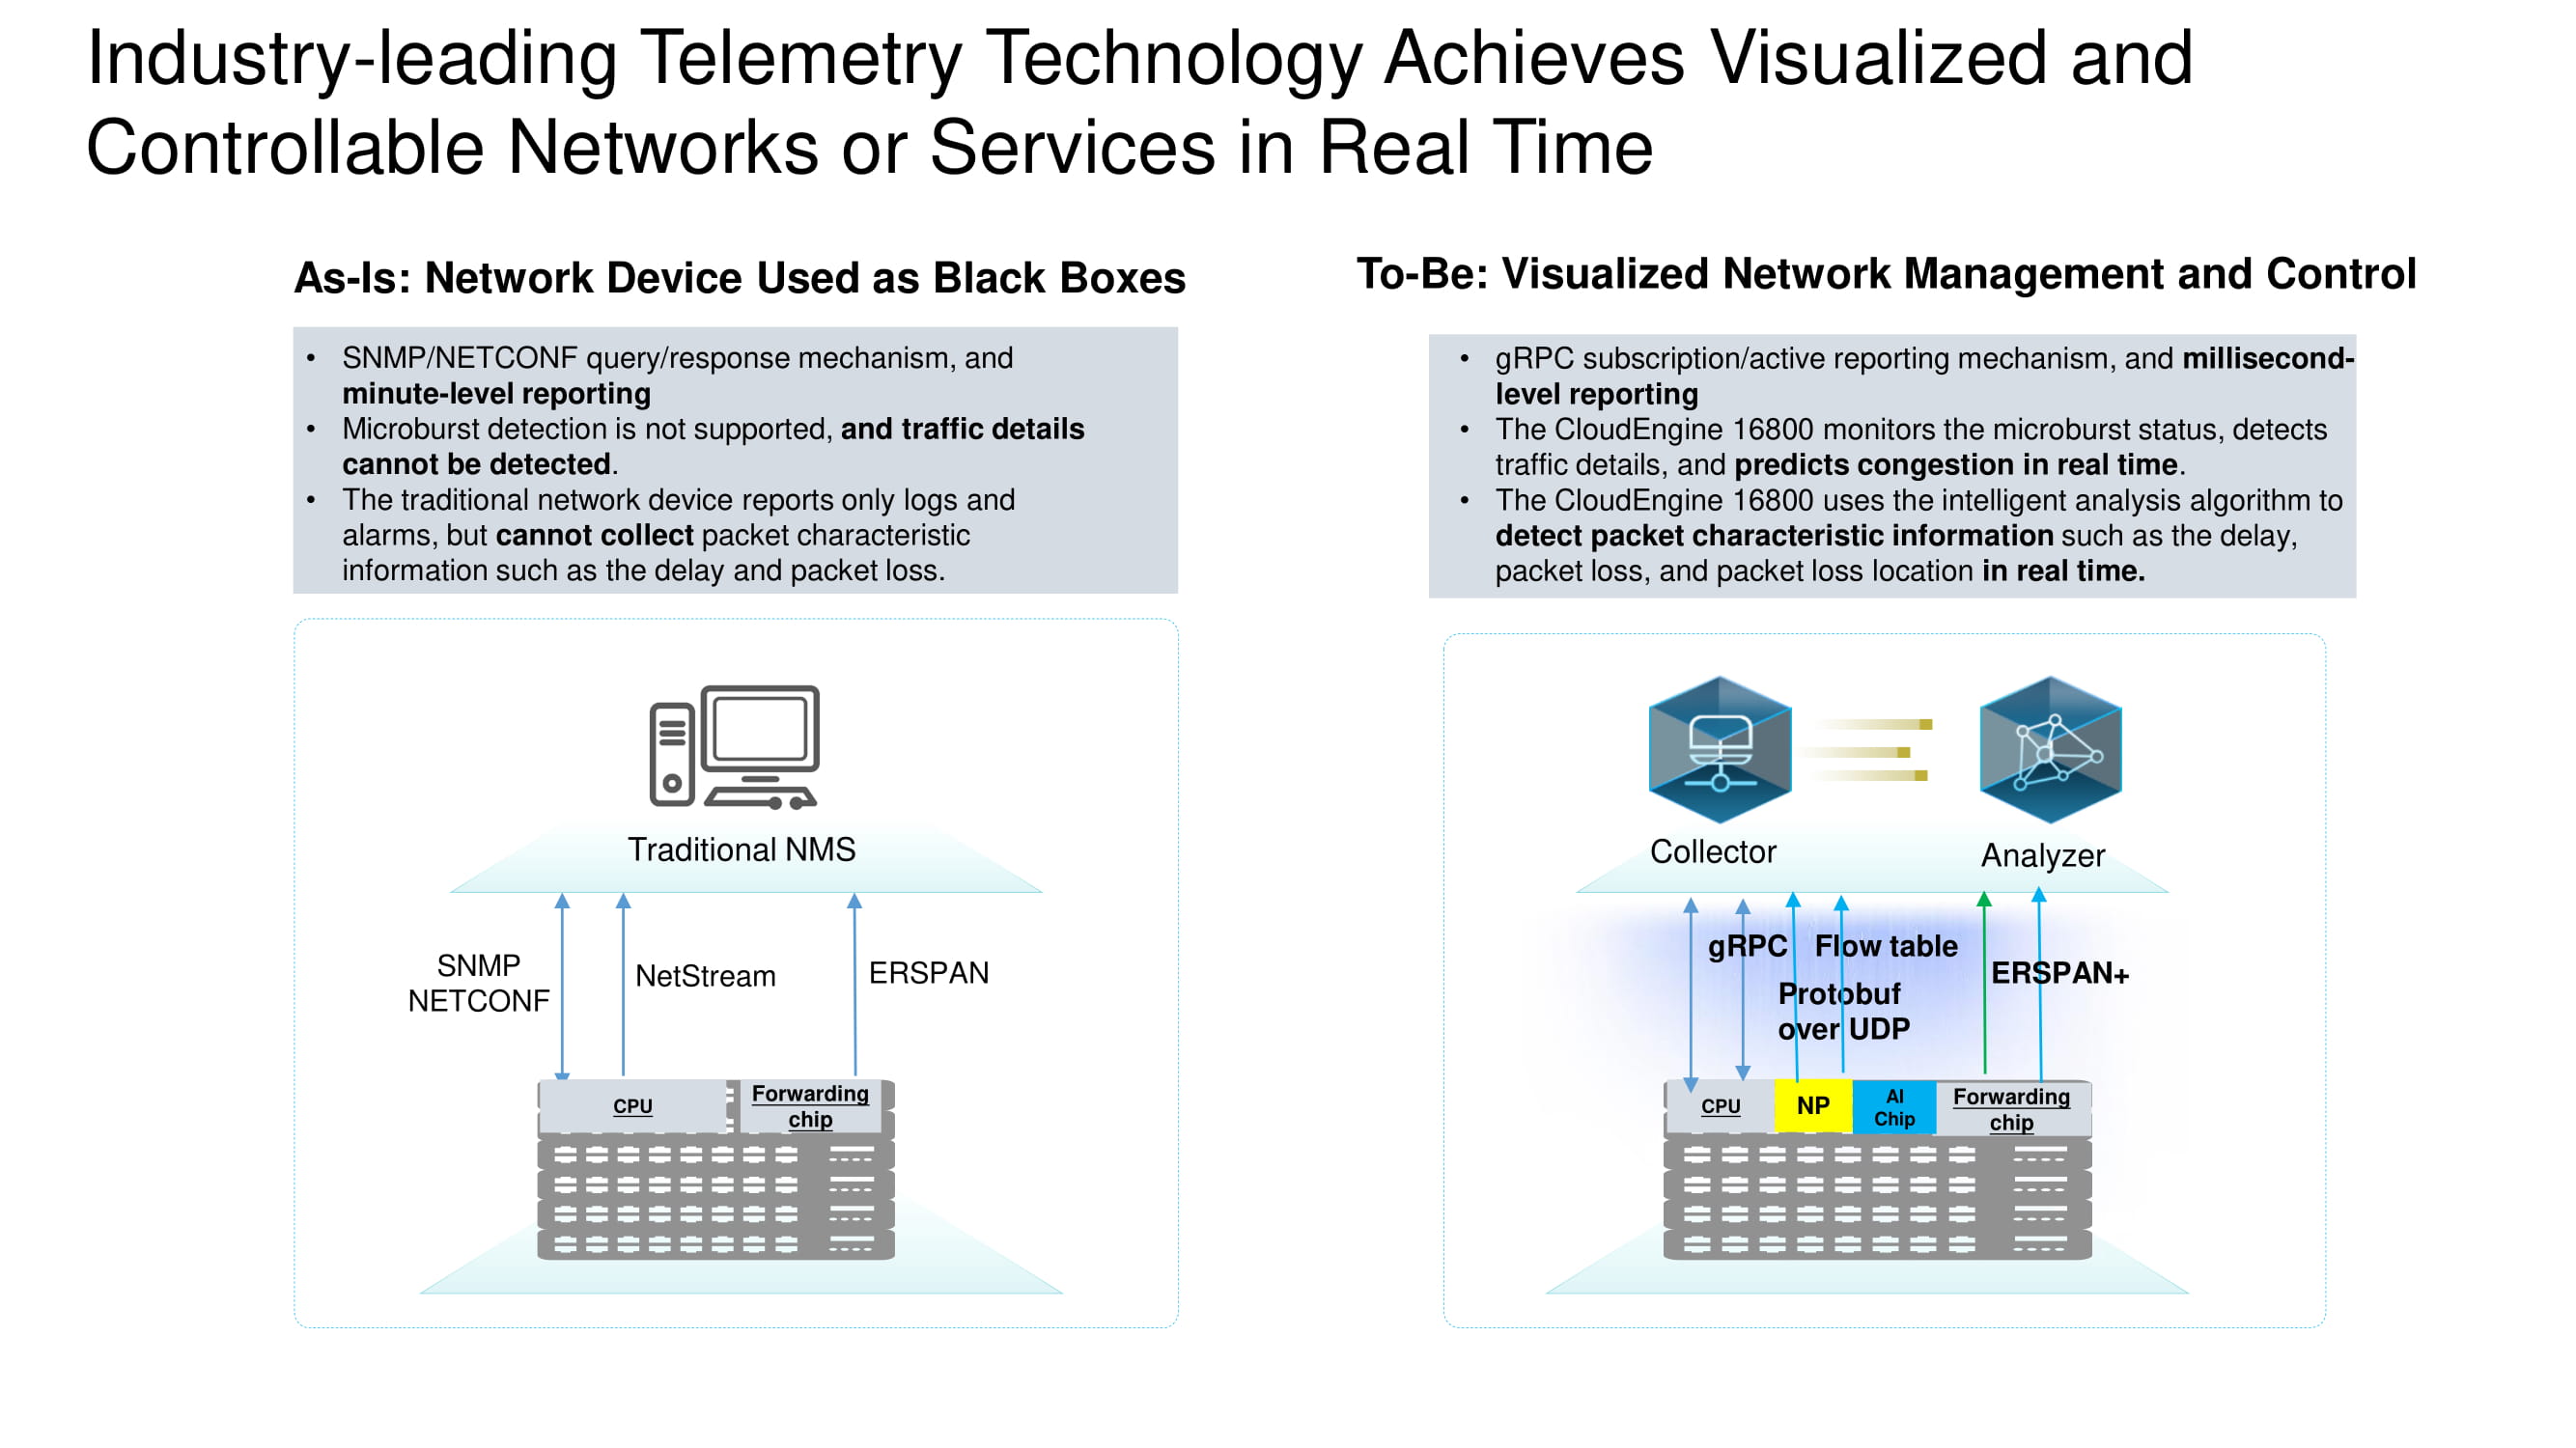
Another area of application of AI is analyzing and monitoring data center operation. We have to move from an ideology that implies functionally limited monitoring of the state of some "black boxes" to the concept of completely transparent networks, about which everything is known.
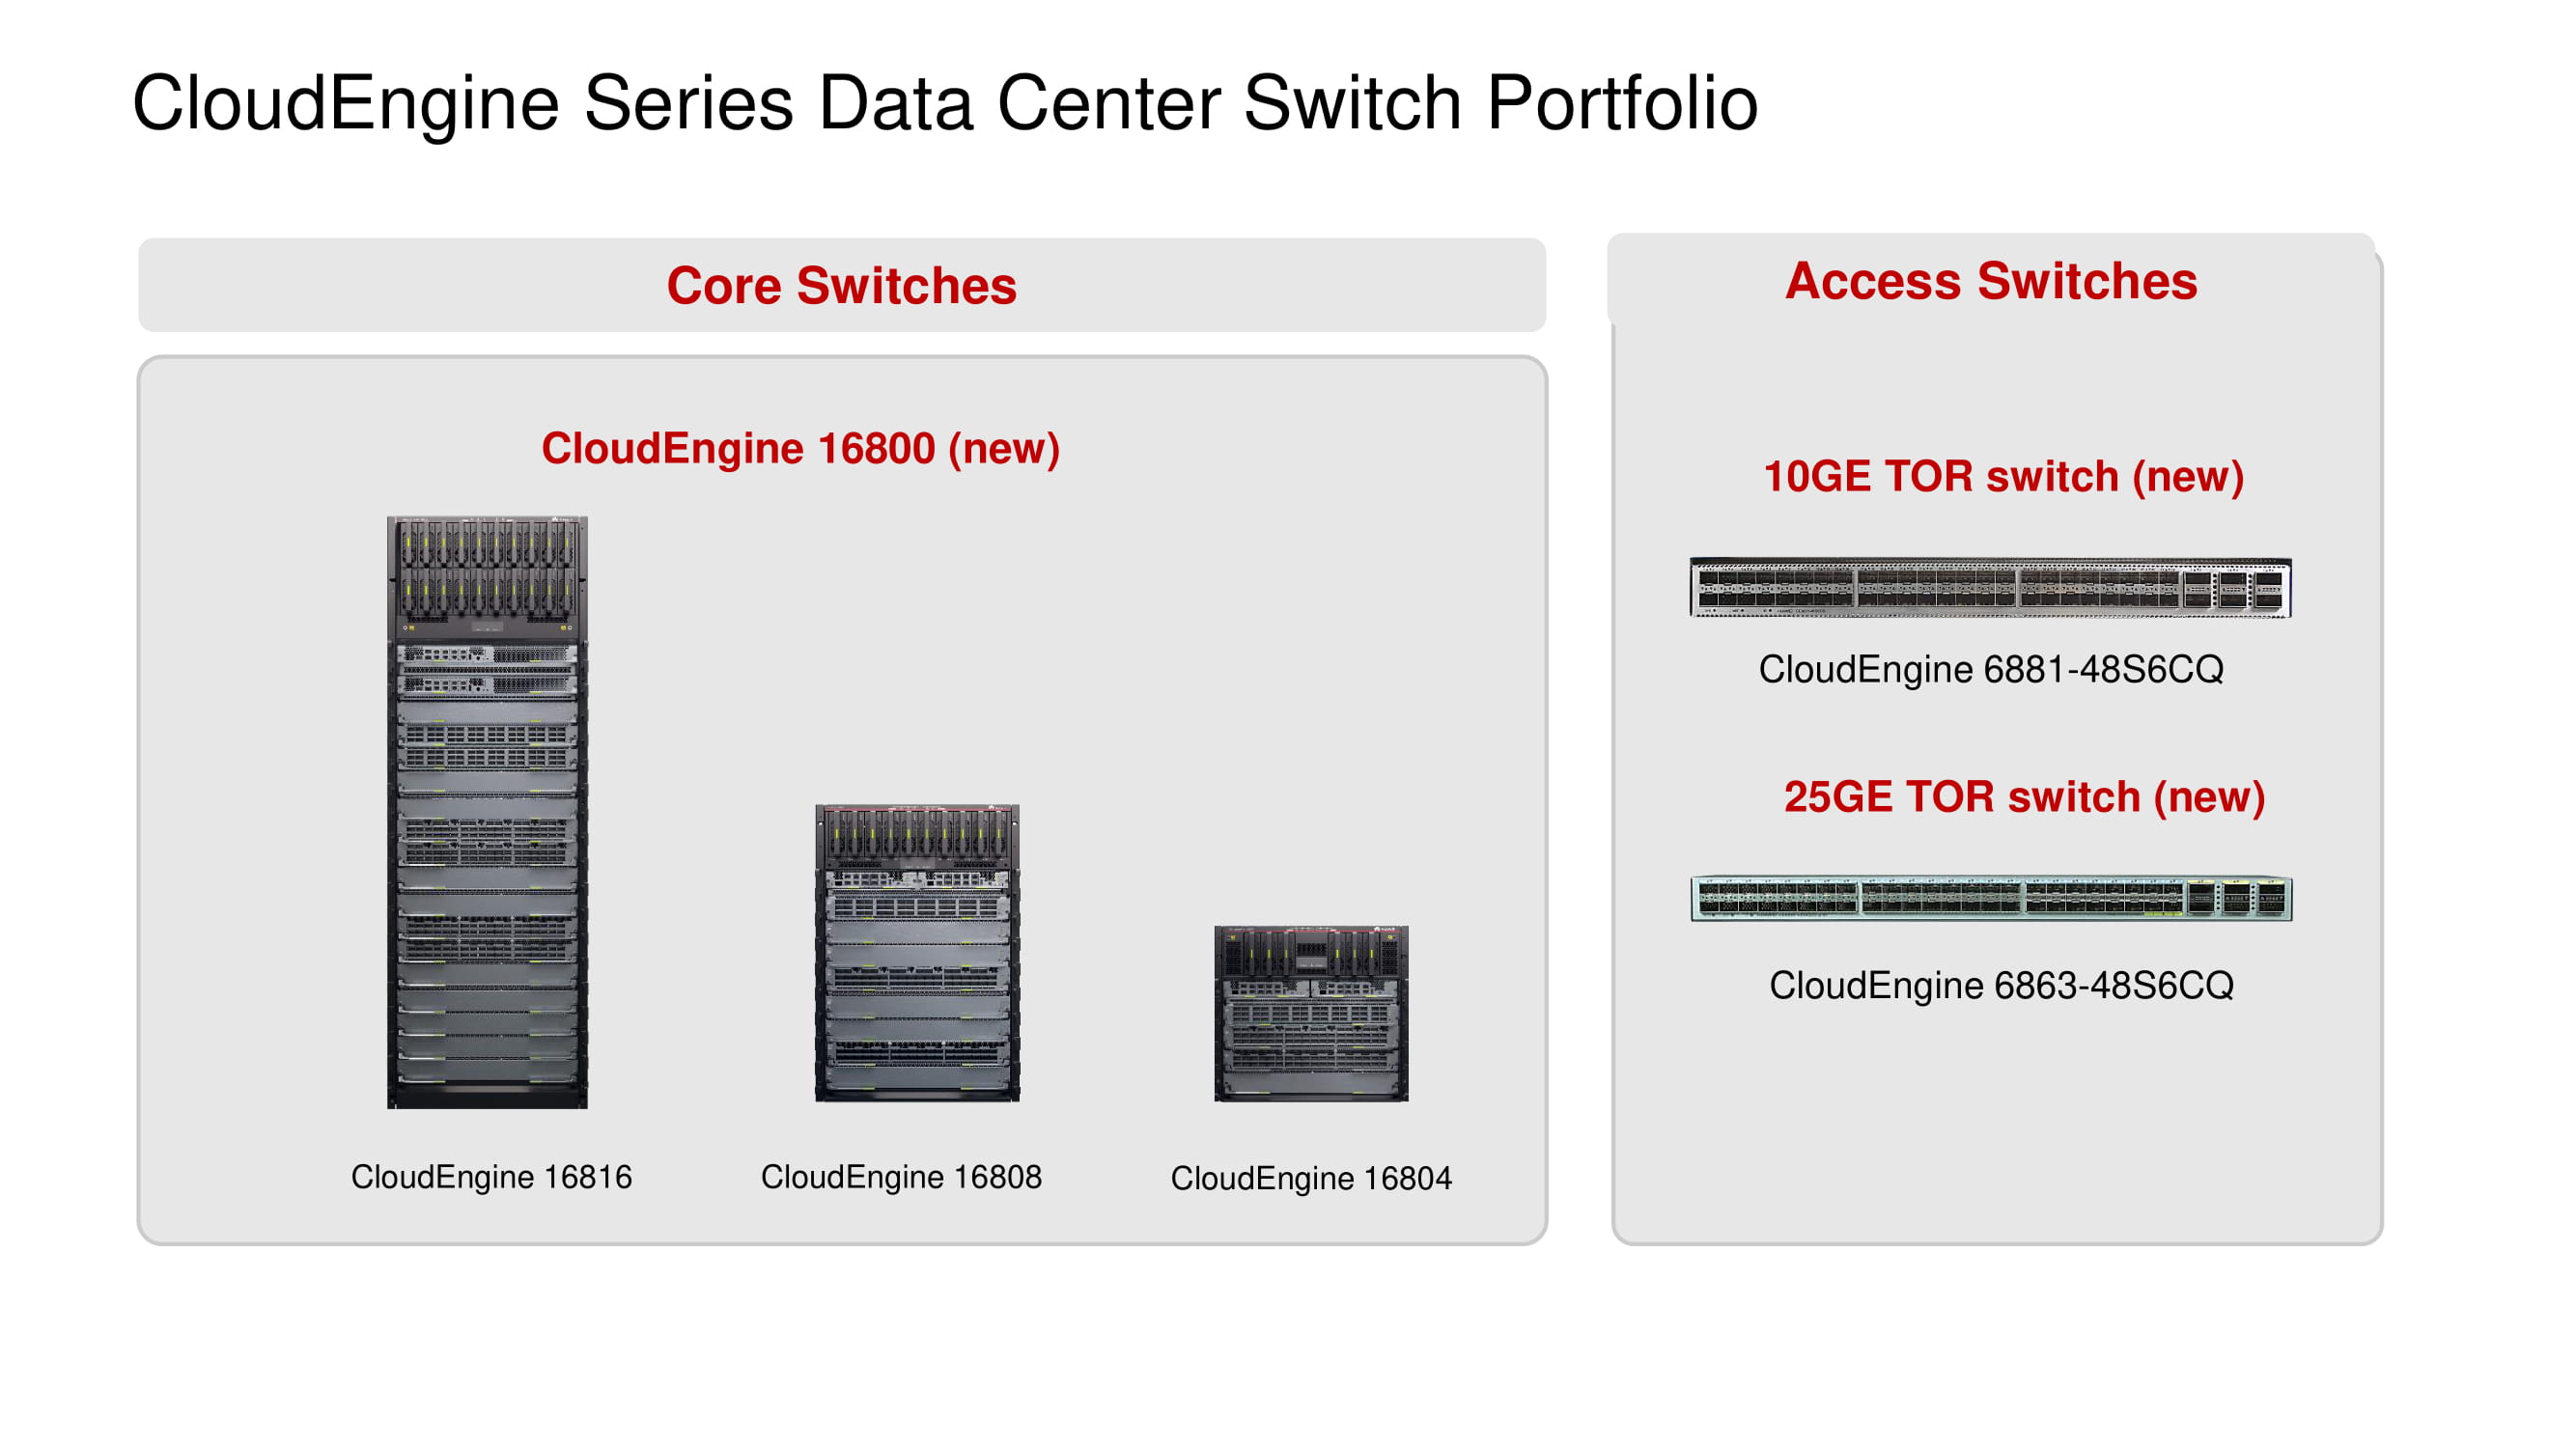
As the main infrastructure network units for building data center networks, Huawei now offers a line of four-, eight- and sixteen-slot CloudEngine 16800 switches with 400 Gbps uplinks; their release is scheduled for the current year. Also, among the new products, we note the CloudEngine 6881 and 6863 ToR switches built on our own element base with 10 and 25 Gbps interfaces, respectively.
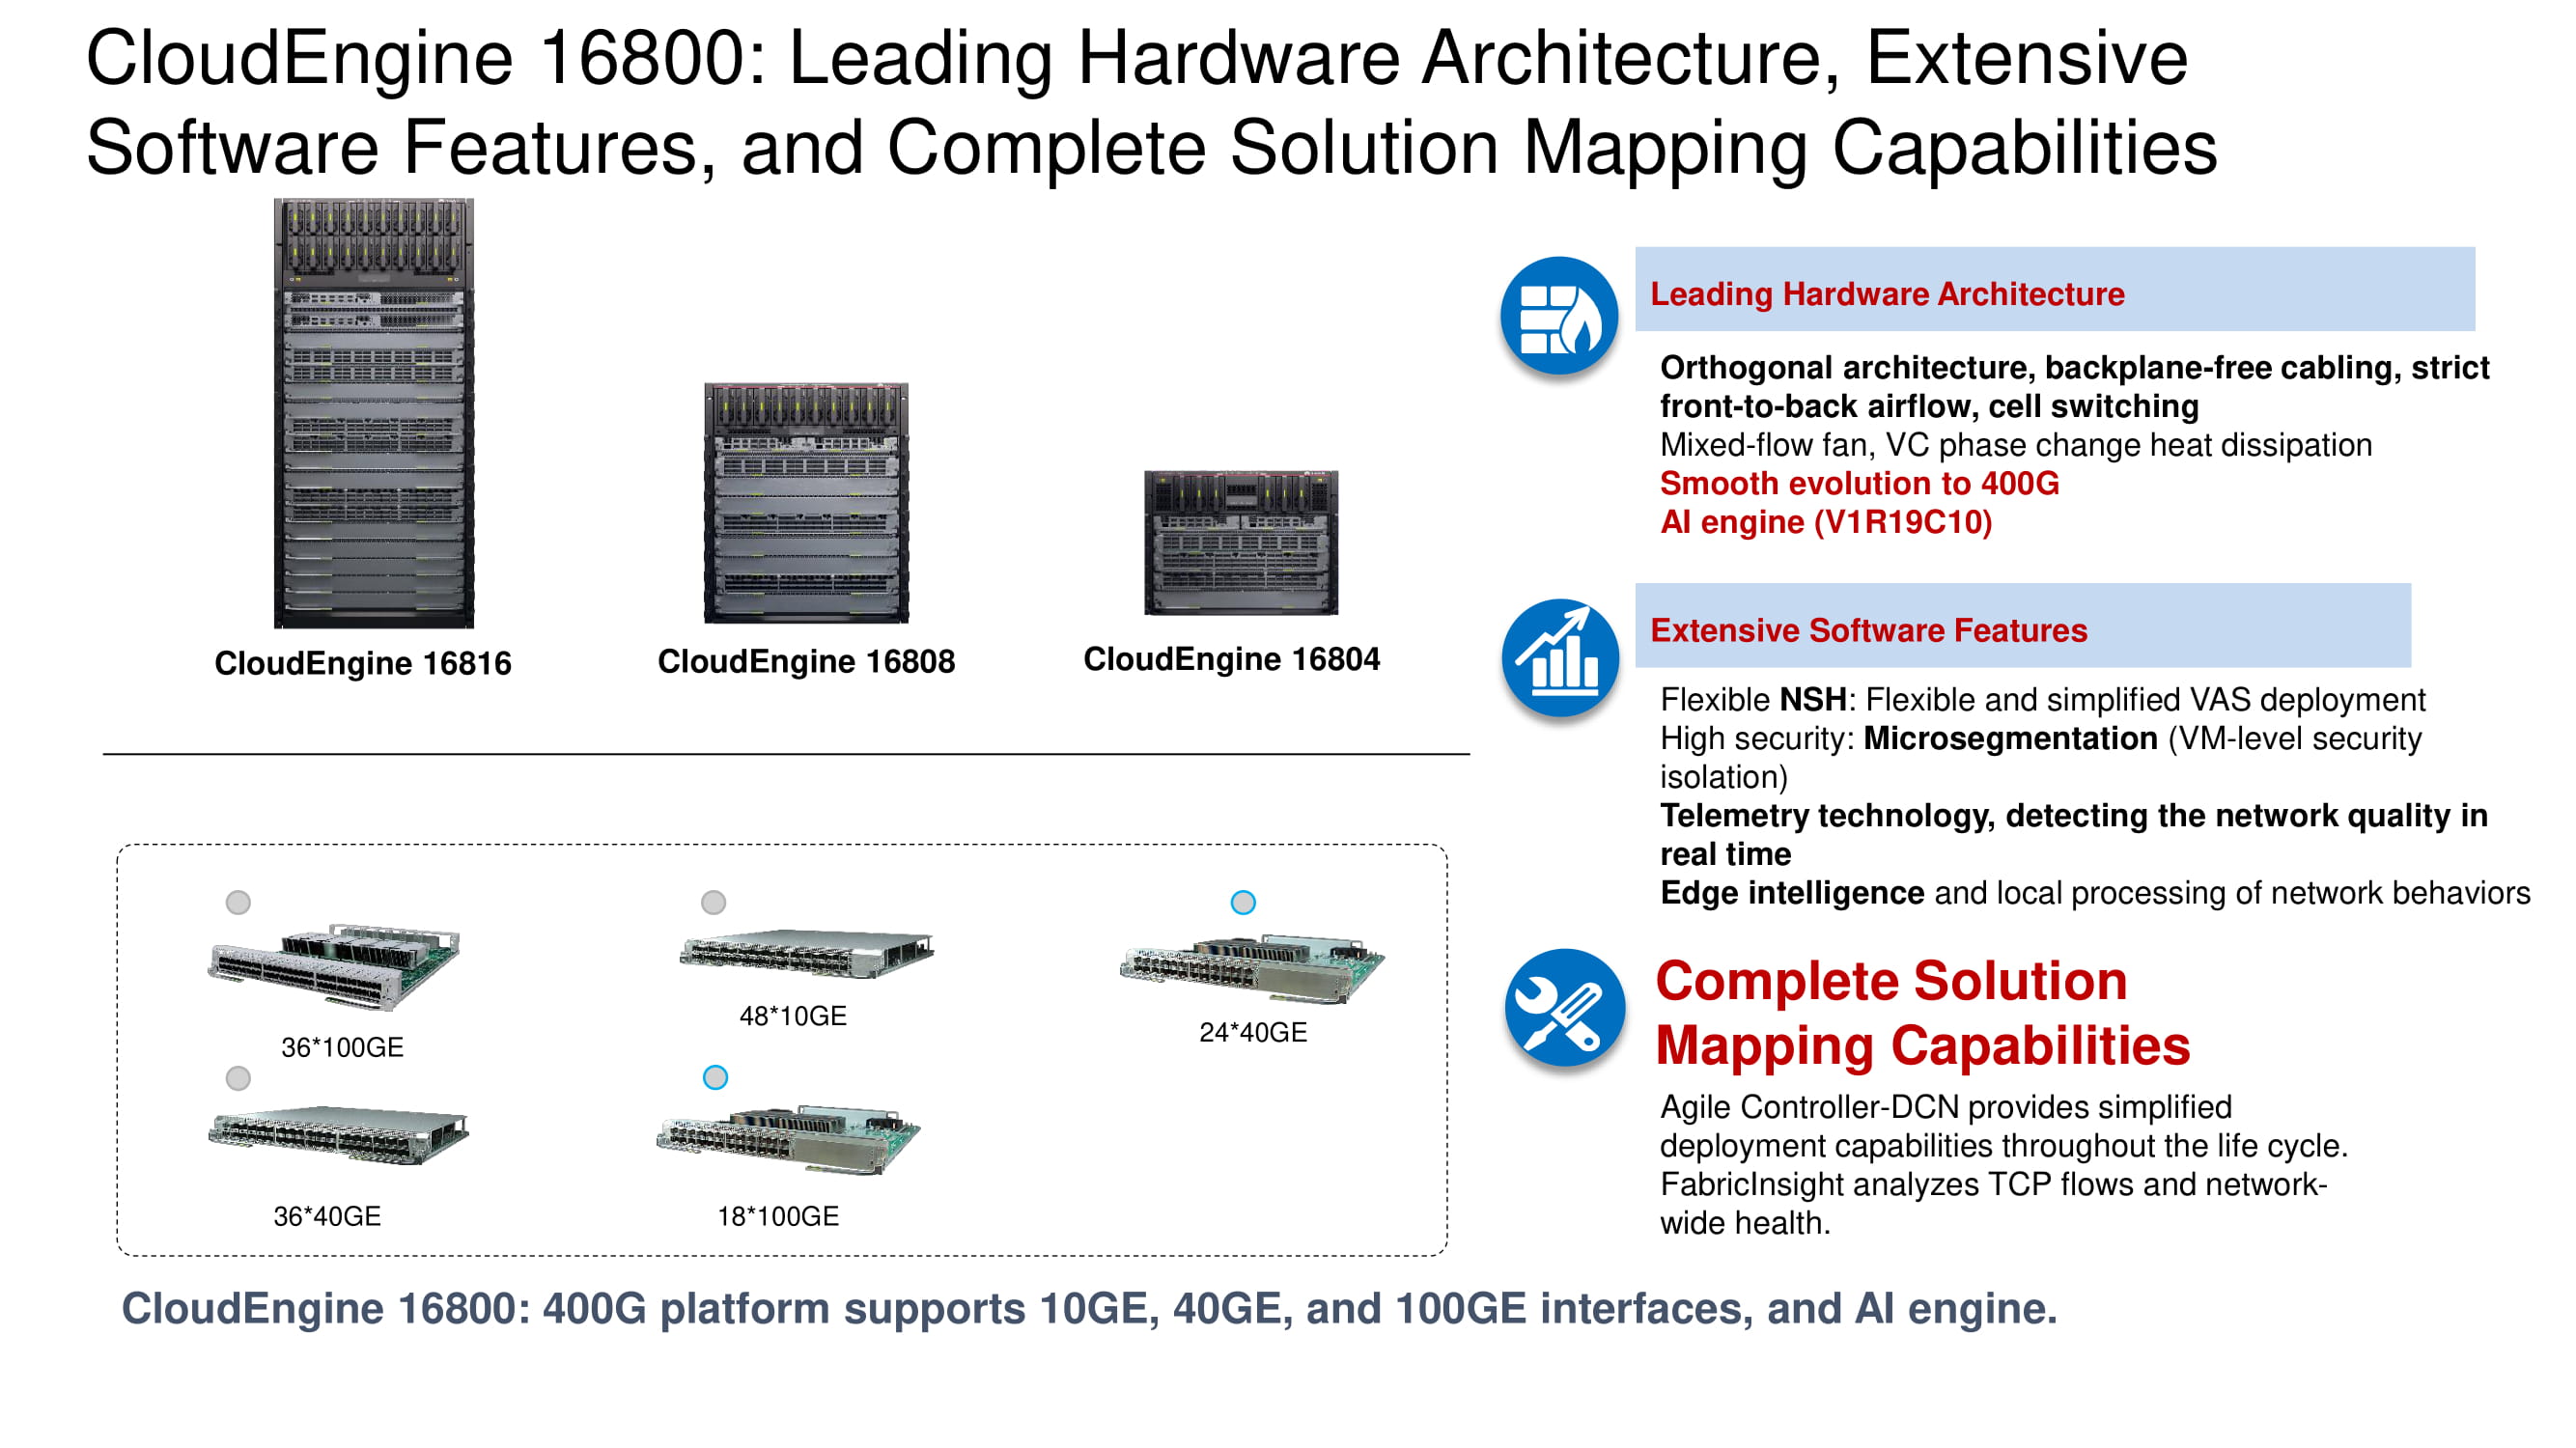
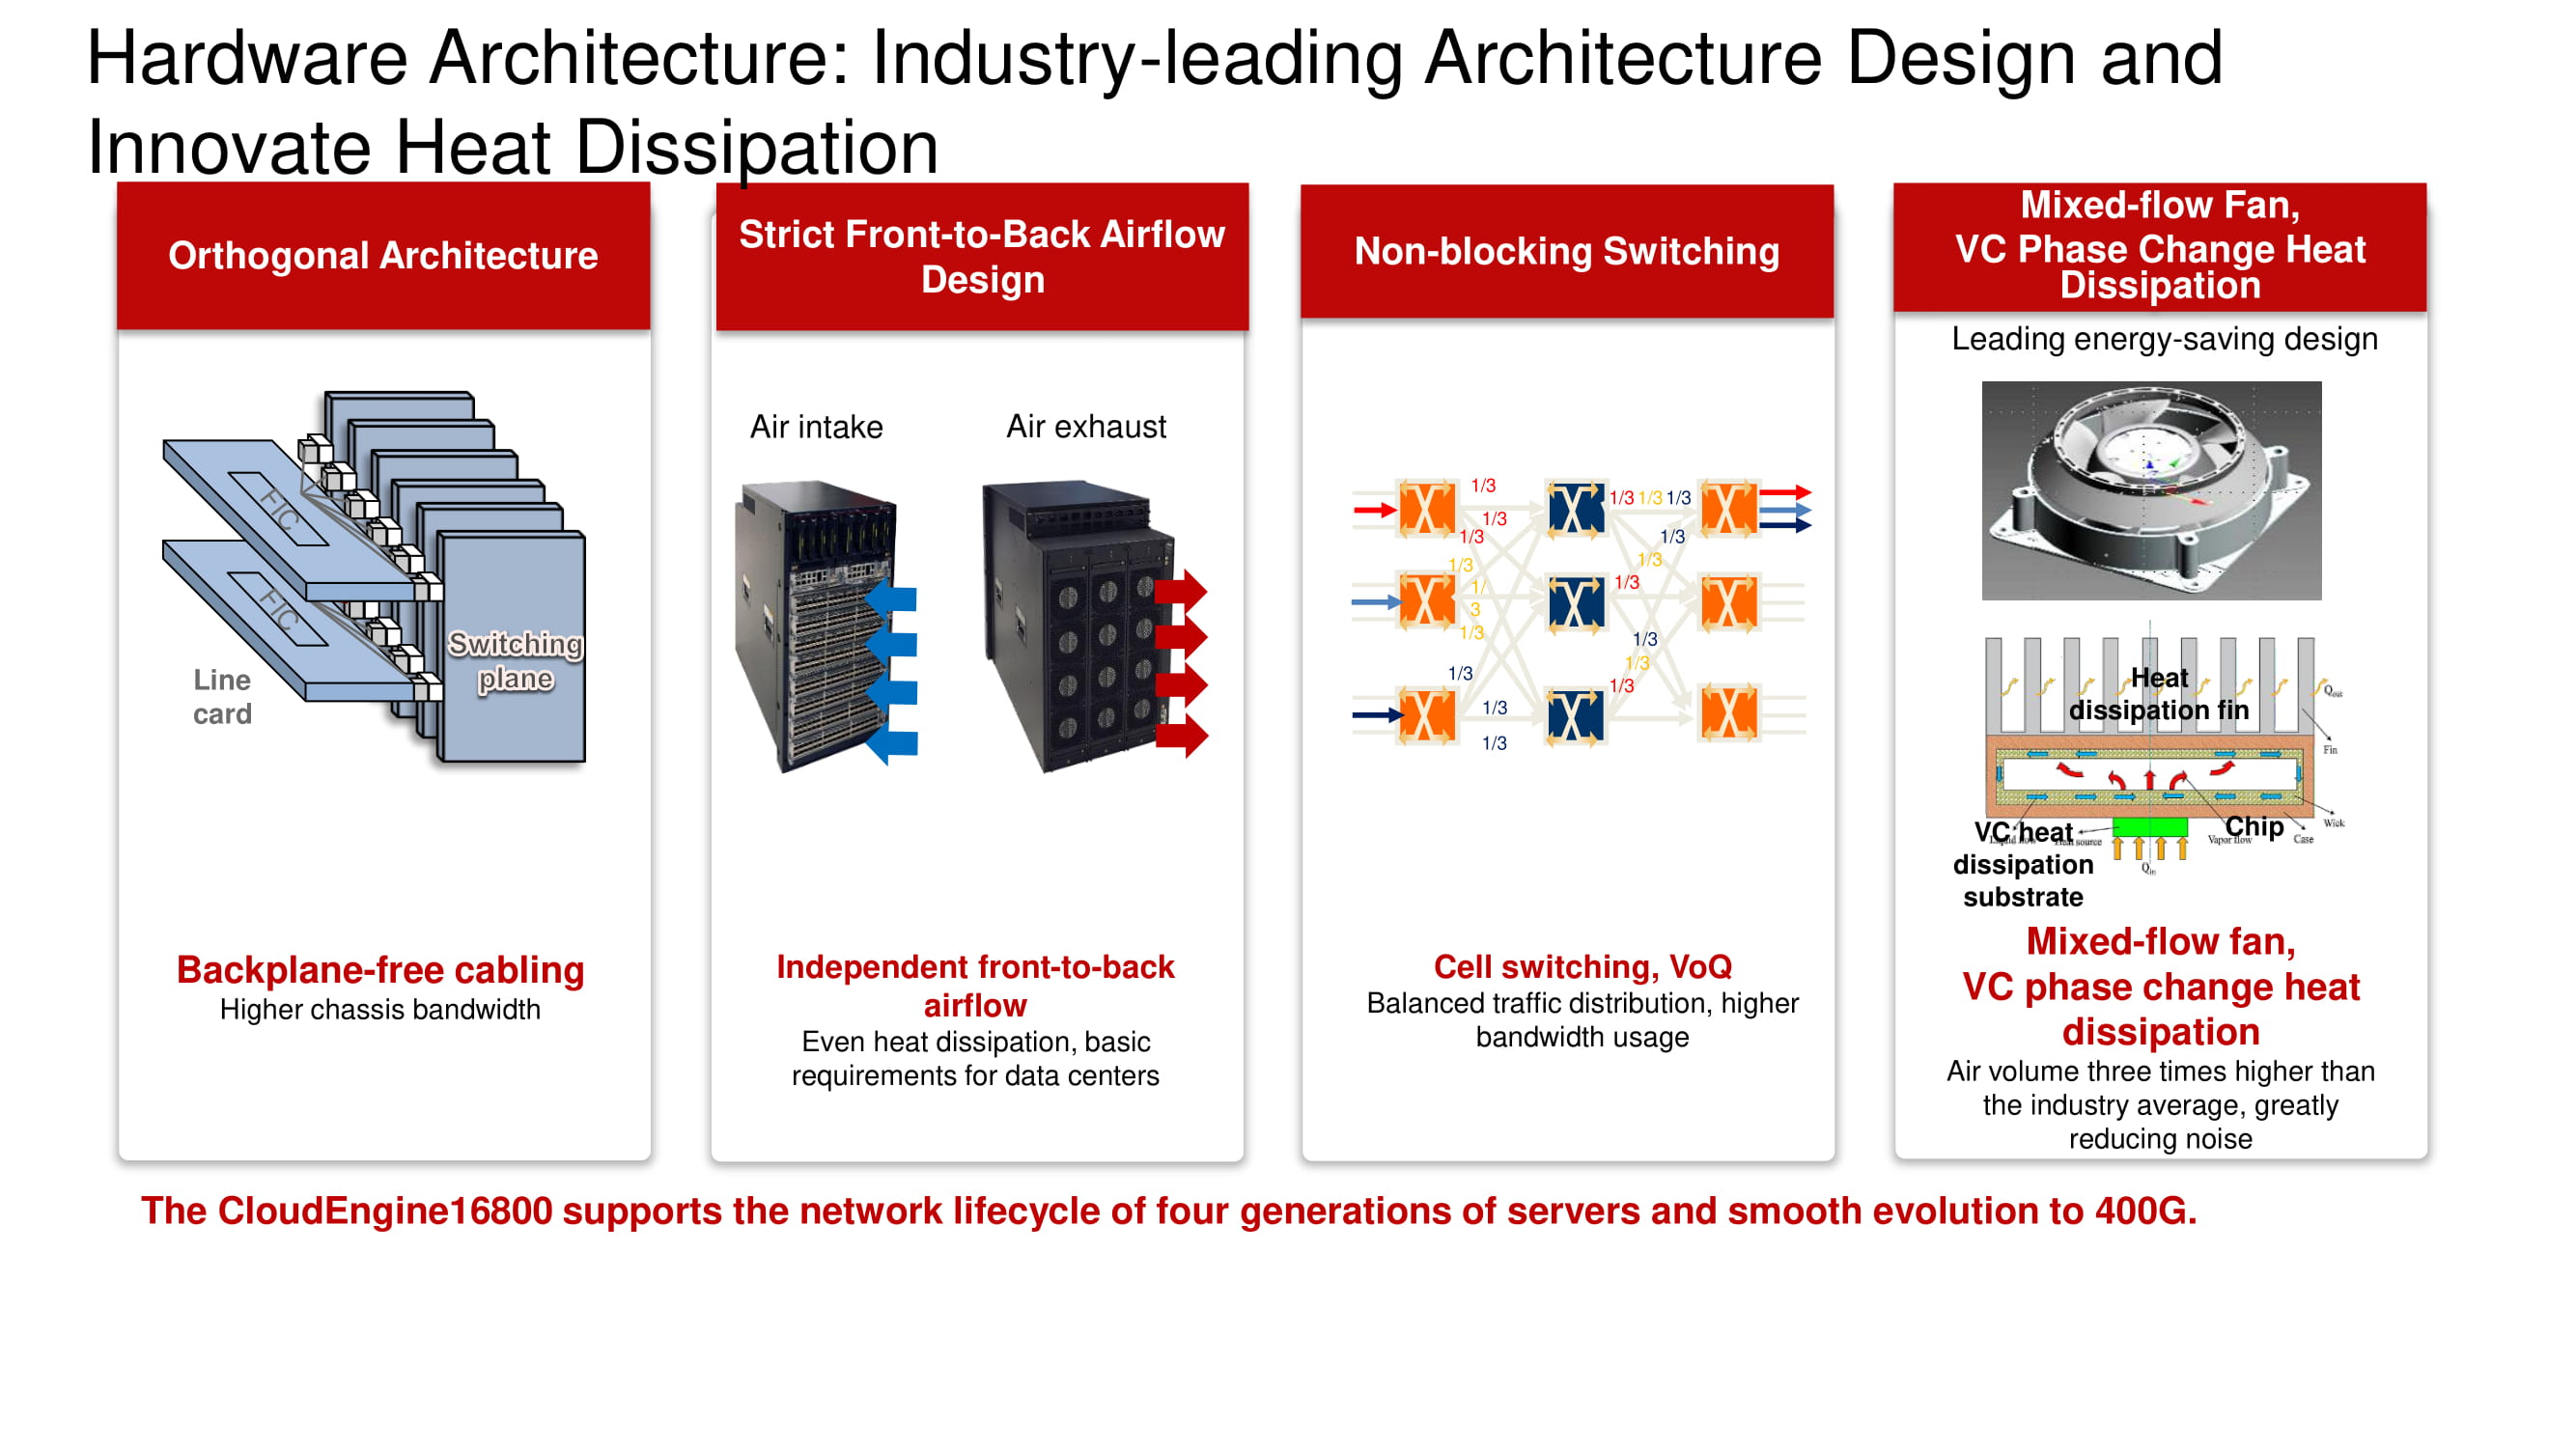
The illustration shows the models of switches from the CloudEngine 16800 line with classic orthogonal architecture, which are equipped with a front-to-back cooling system, as well as compatible line cards equipped with 10, 40 and 100 Gb / s interfaces.
Of the important basic functions of CloudEngine 16800, we highlight its ability to work with NSH (Network Service Header), which allows implementing micro-segmentation distributed across several switches in the data center (isolation at the virtual machine level), providing extensive telemetry capabilities and analyzing traffic at the network edge (edge intelligence ) using artificial intelligence technologies based on Huawei AI chips.
The V1R19C10 will be truly revolutionary. It is in it that many long-awaited functions should be implemented, including EVPN Multihoming without a "jumper" in the form of M-LAG (Multi-Switch Link Aggregation) based on the first and fourth types of routes in EVPN VXLAN routing.
Familiar architecture and new possibilities
The diagram shows the familiar orthogonal architecture of a three-tier "factory" Non-blocking Switching. Its primary advantages include the optimal arrangement of the "factory" boards, line cards, connectors and a blowing system based on variable speed fans.
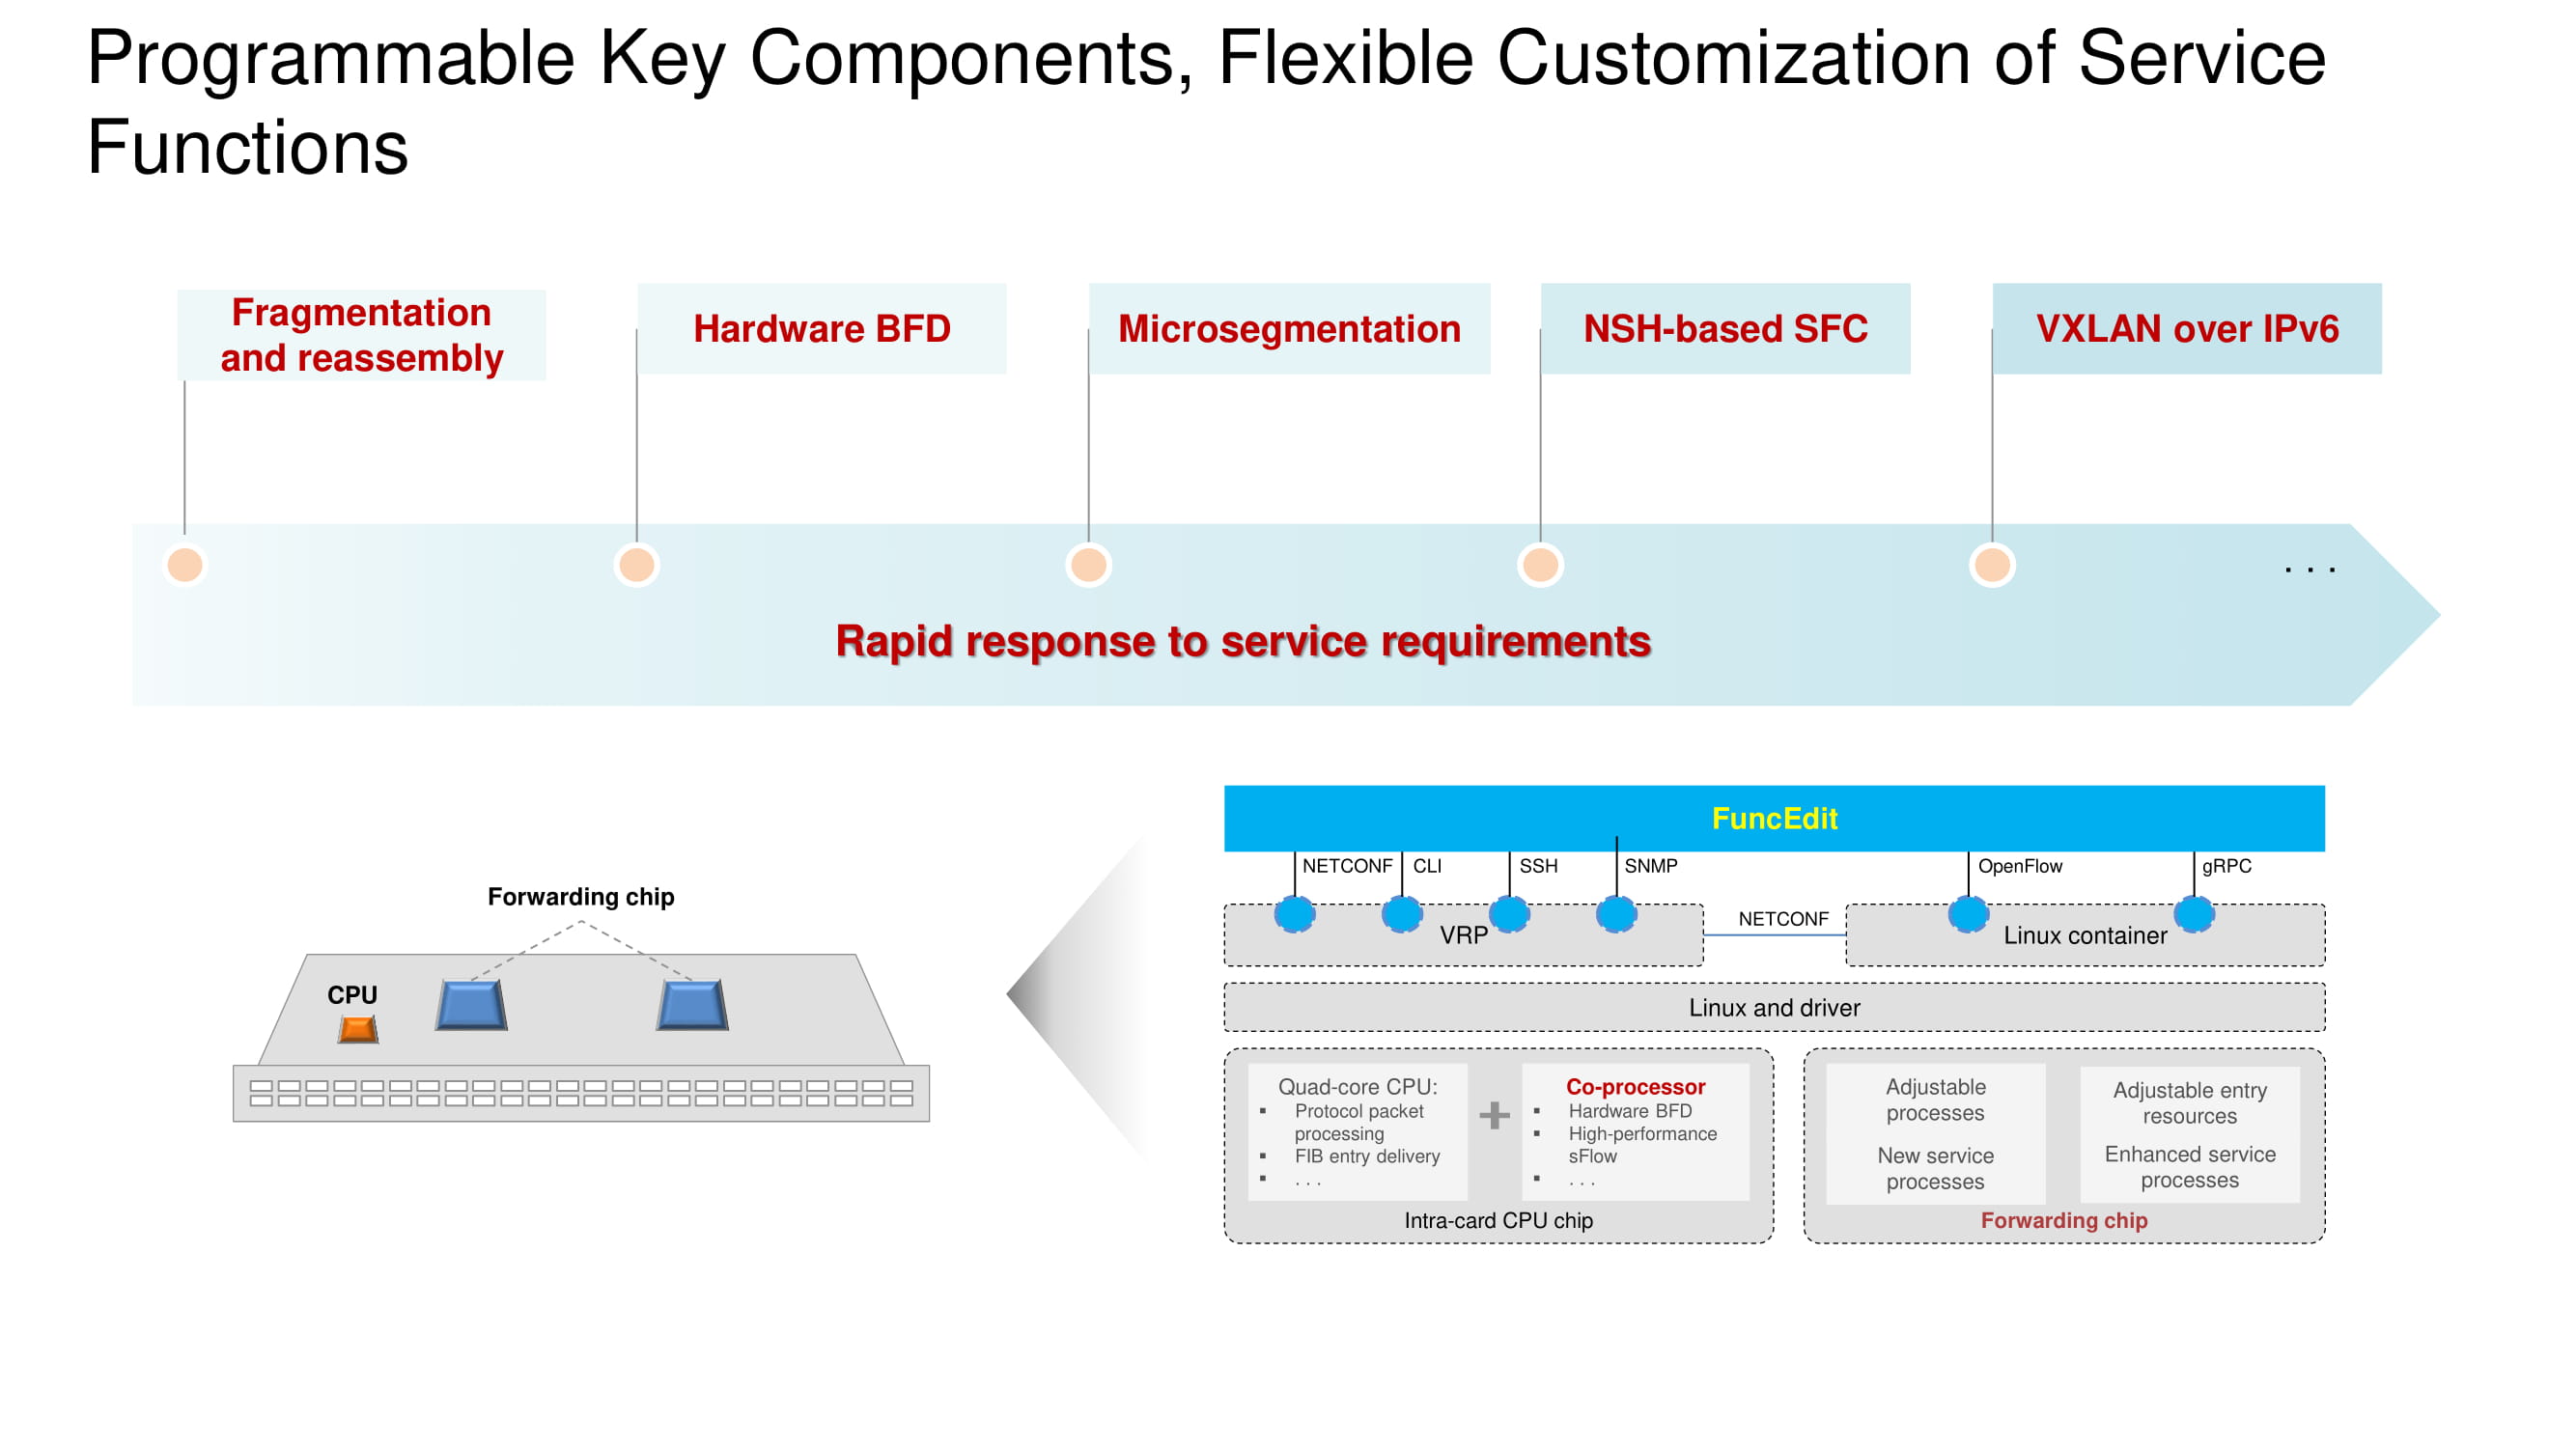
It is important that the BFD (Bidirectional Forwarding Detection) protocol is hardware implemented on the new switch models and it is possible to configure VXLAN in the IPv6 address space. The basic architecture remains the same and is based on a processor, coprocessor and forwarding chip. The functionality of each of the nodes is shown in the diagram. The main change in 2020 is the transition to Huawei's own chips in flagship switches, fully competing with their counterparts from Broadcom.
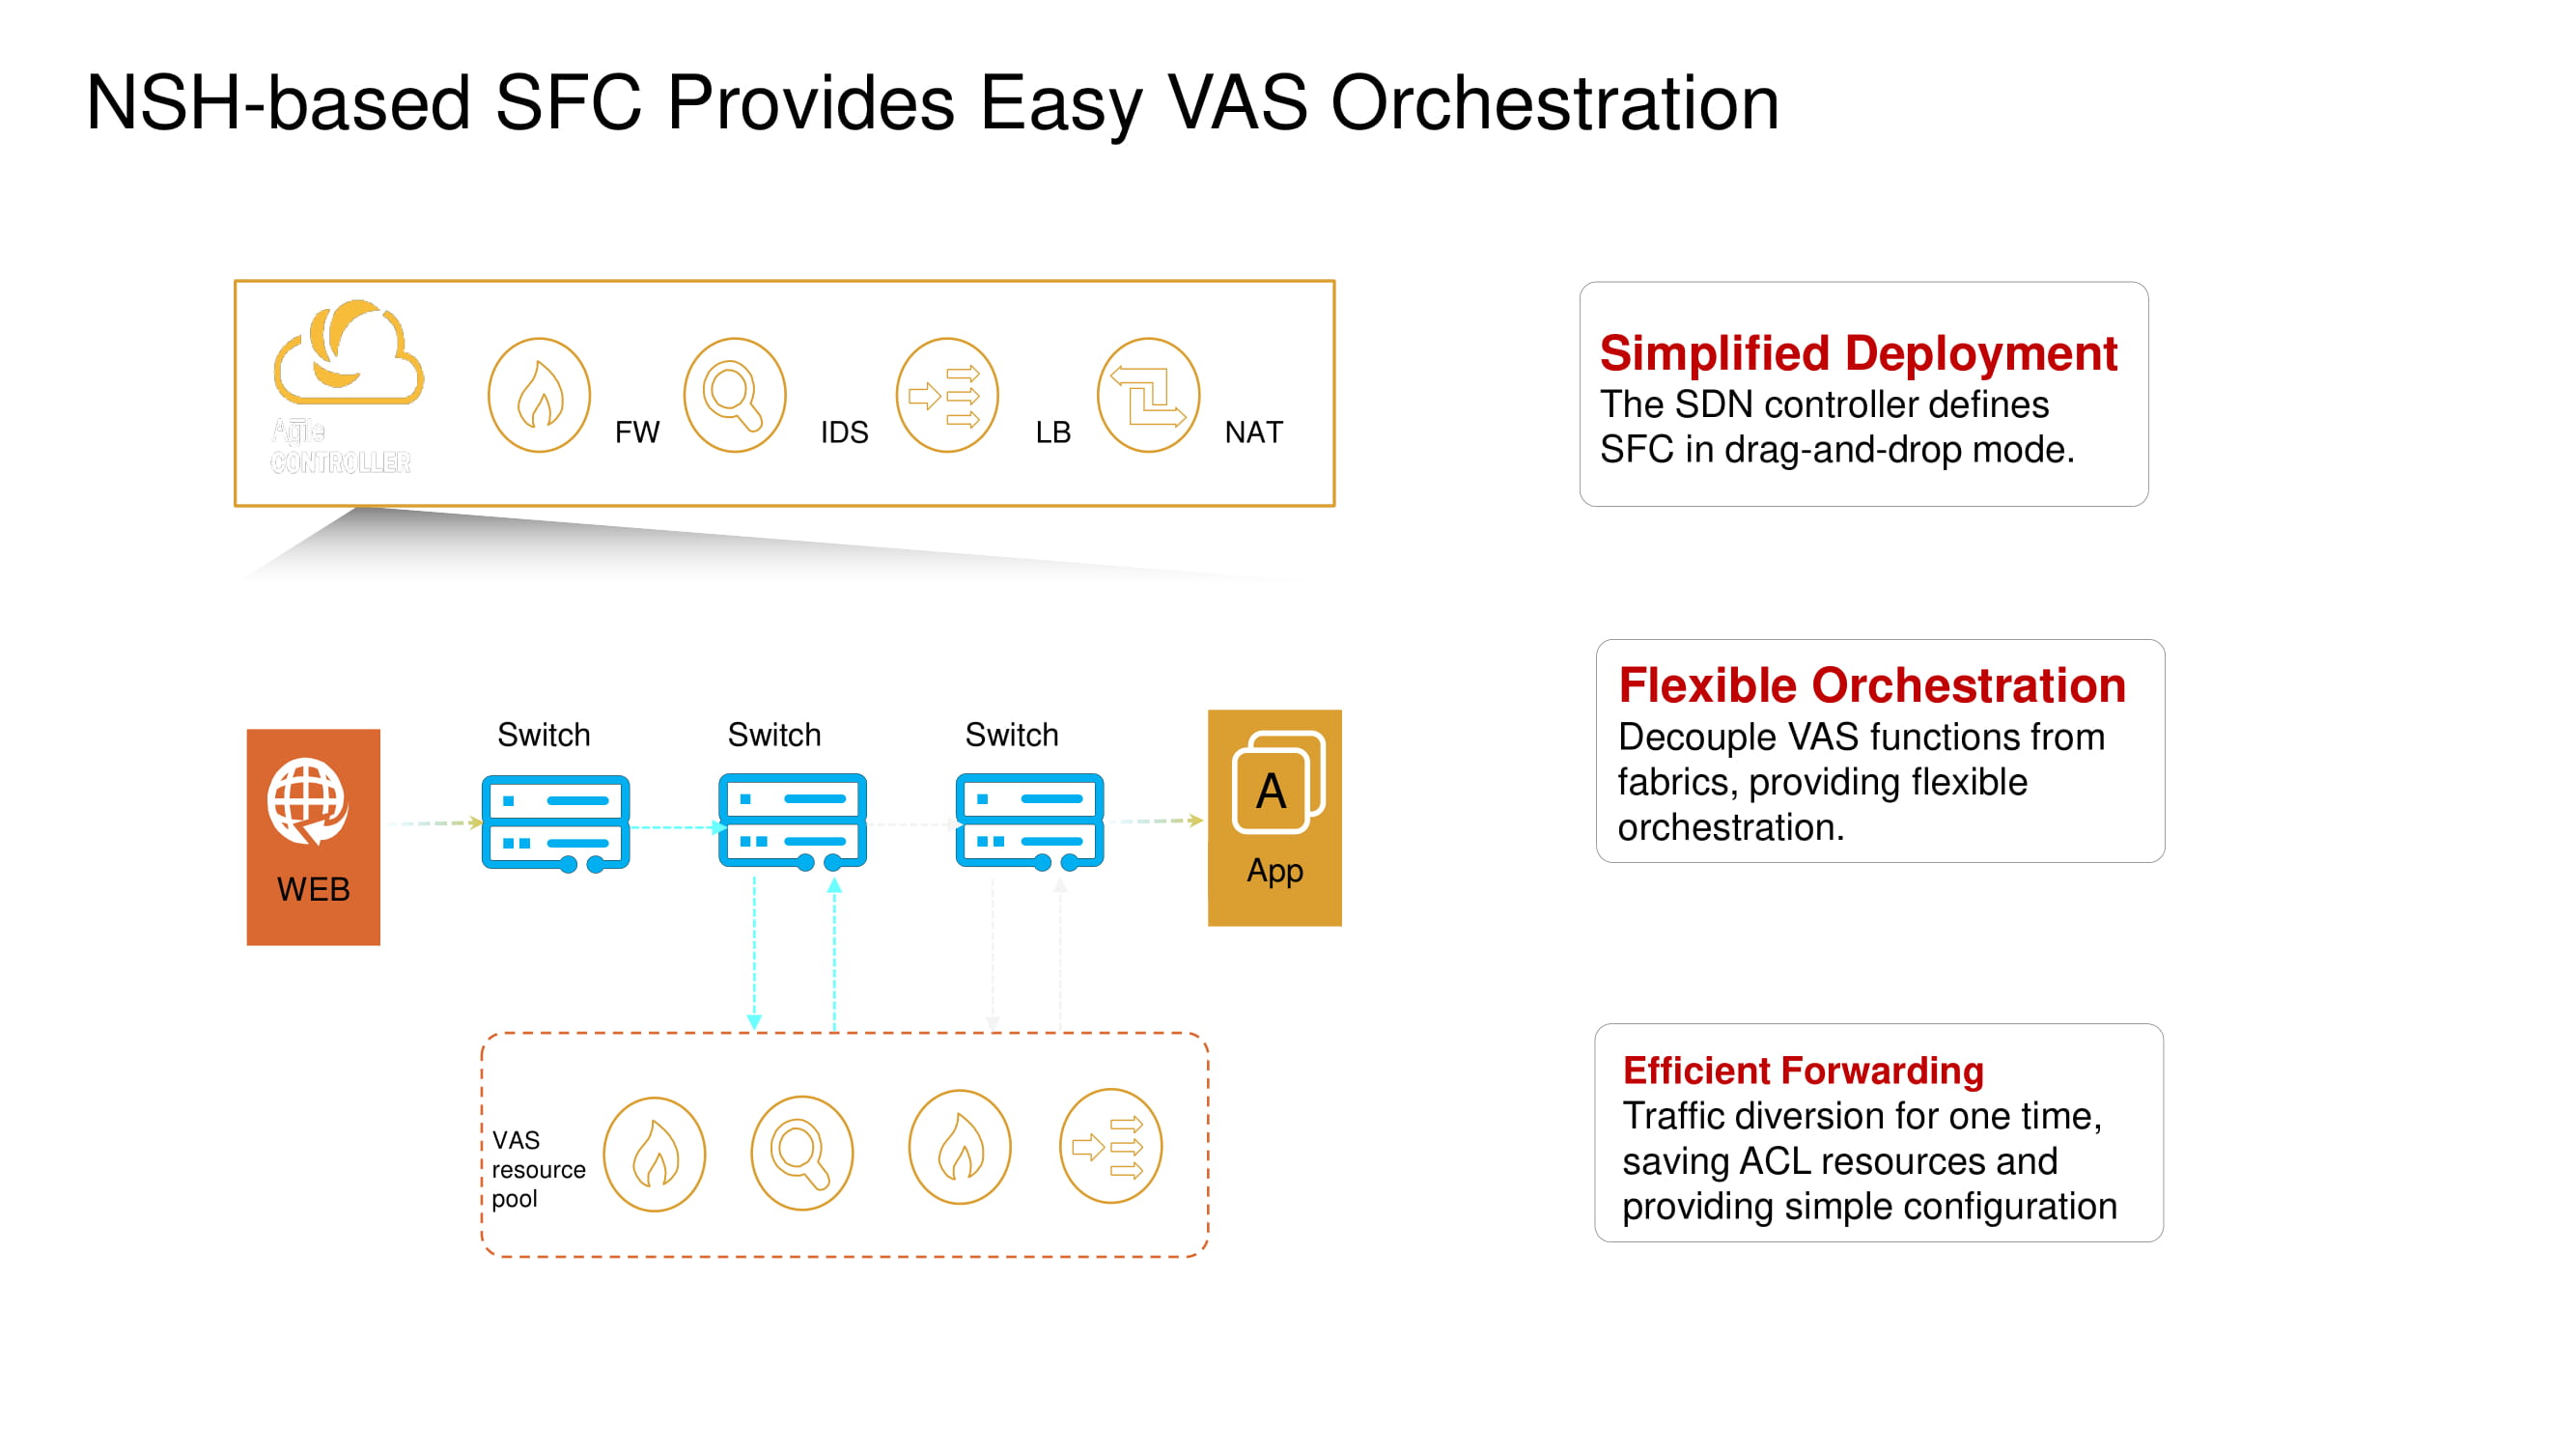
Support for Network Service Header operations allows new switches to change the default VXLAN packet routes and enable services such as firewalls (FW), intrusion detection systems (IDS), load balancers (SLB), and NAT.
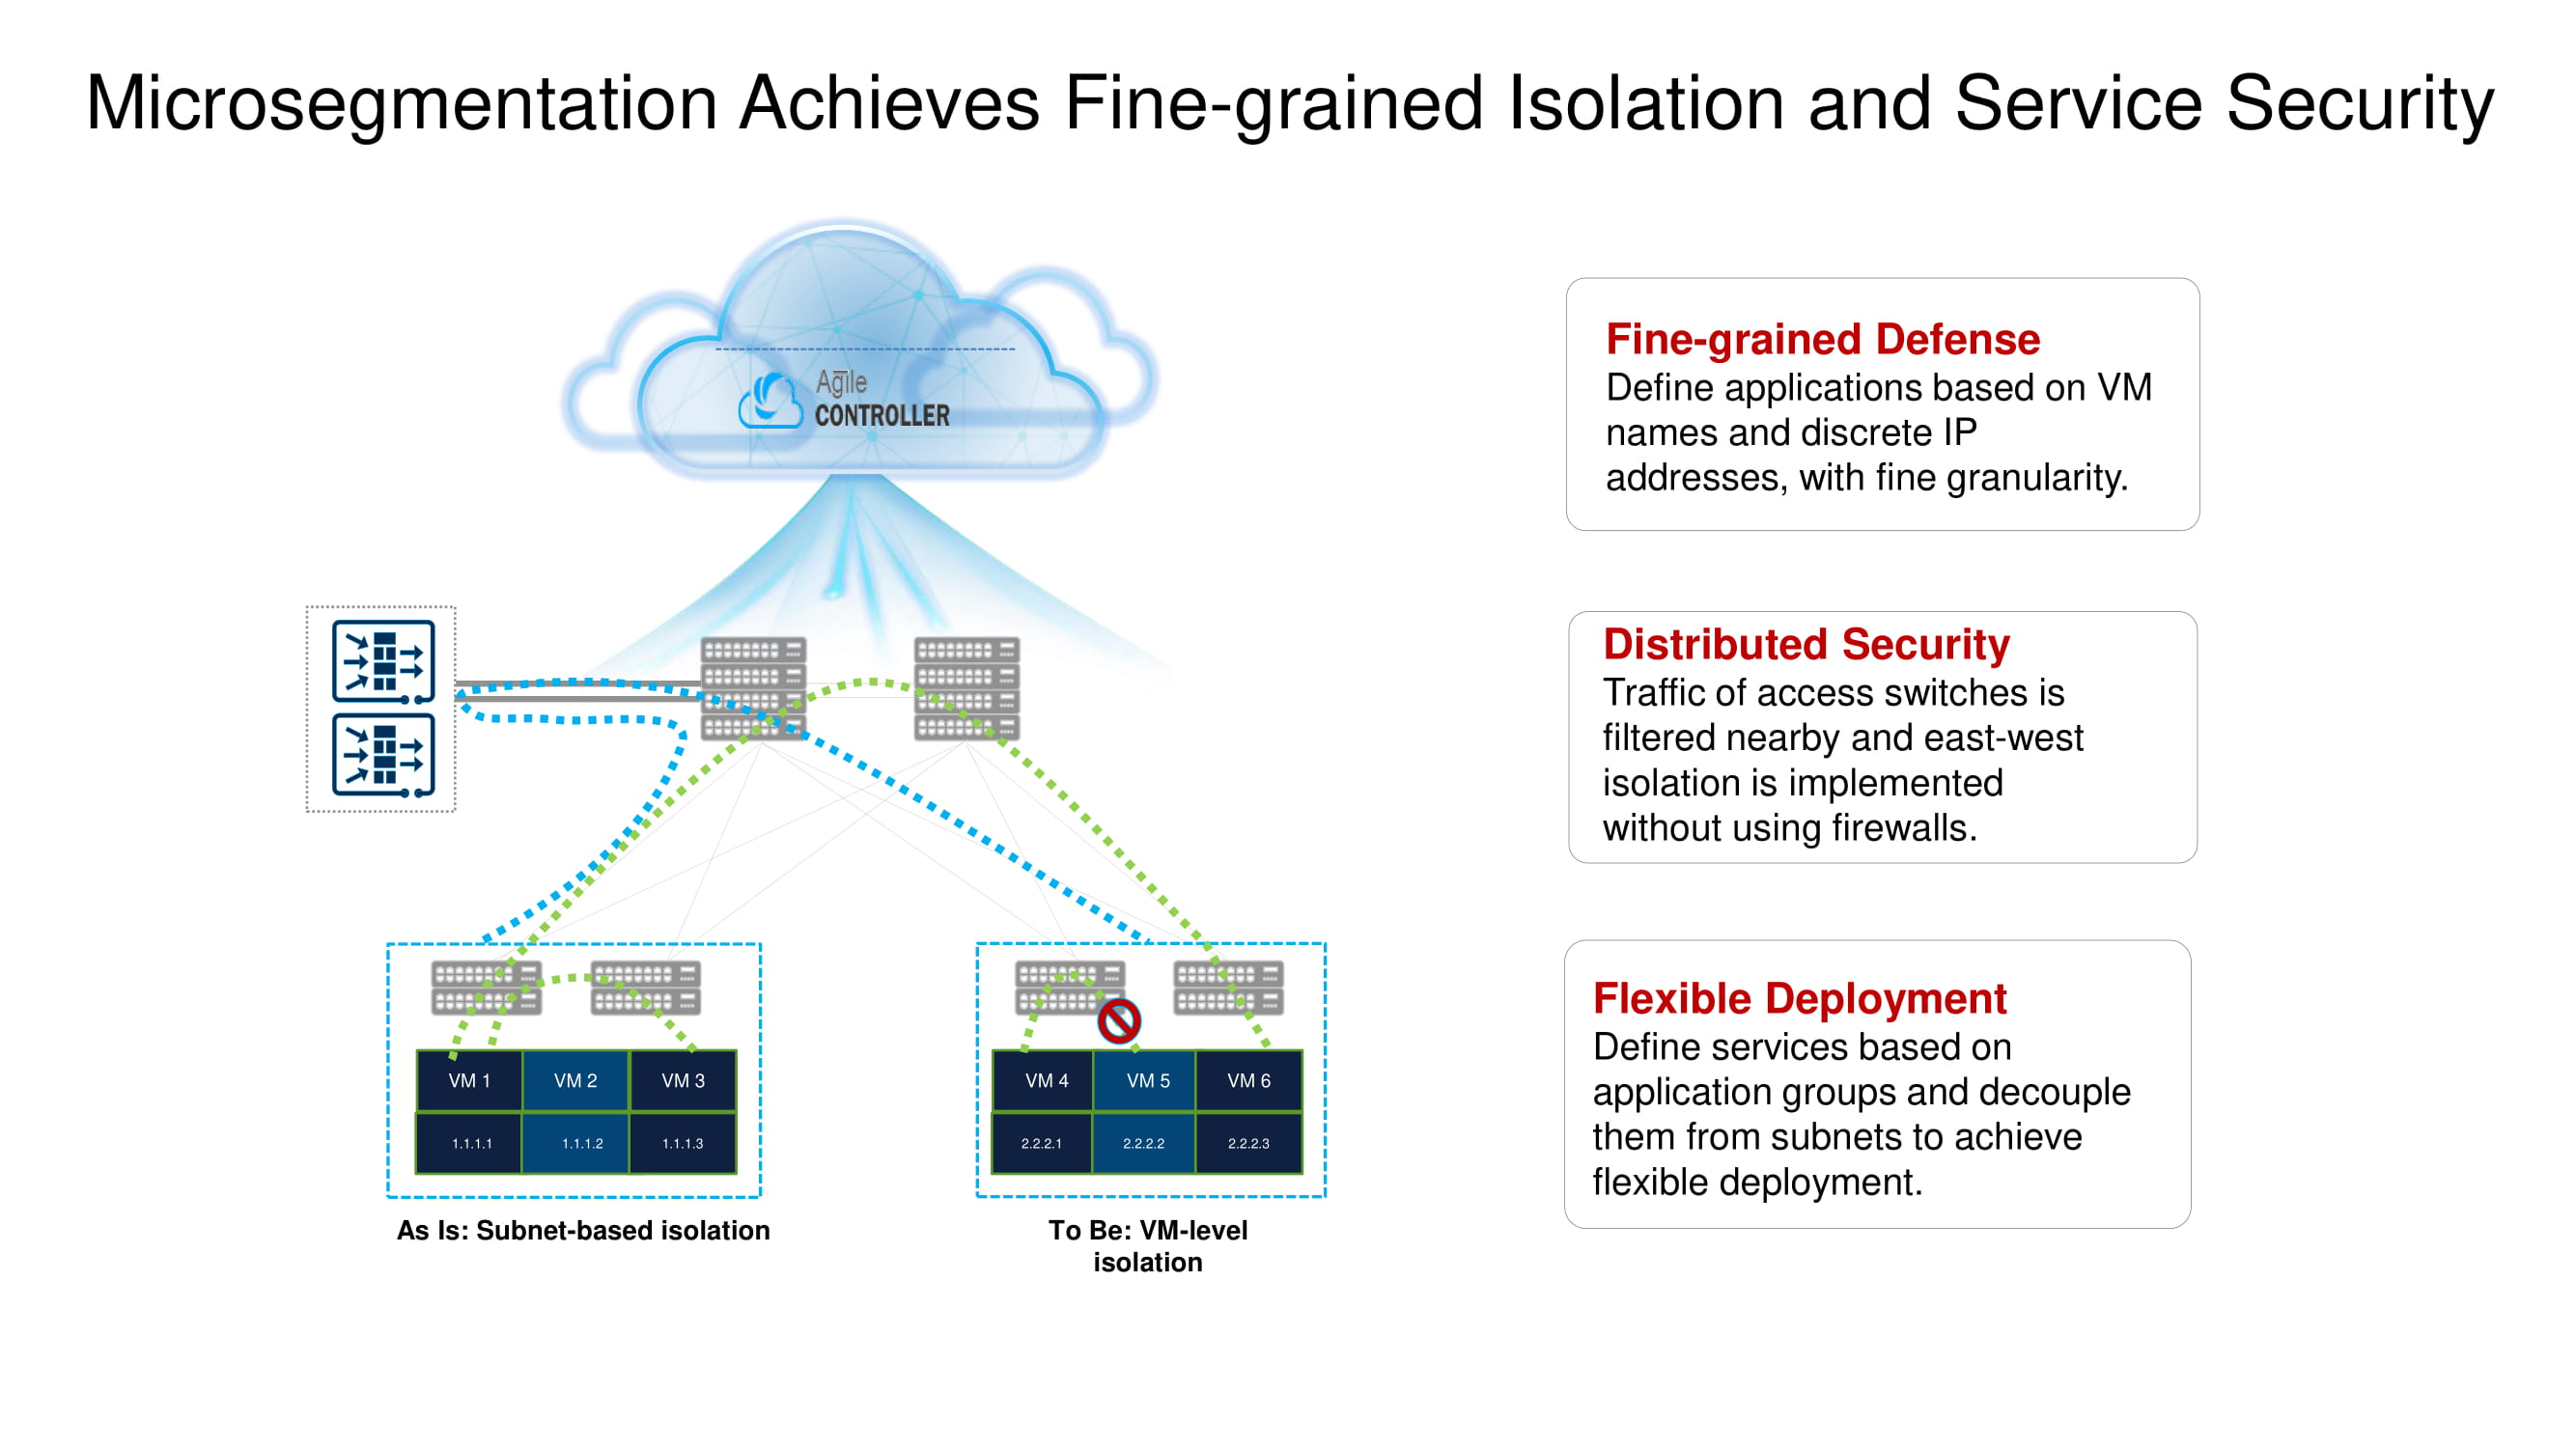
Let's return briefly to the previously mentioned split micro-segmentation. New Huawei ToR switches with the help of the same NSH allow you to isolate workloads at the level of virtual machine names. These machines can be further grouped at the subnet level based on port numbers, superior protocols, etc., thus forming application groups.
Full range of telemetry data
Information from devices is collected in real time using several major protocols. The task of ERSPAN + is to collect TCP headers for the subsequent detailed analysis of TCP streams in the data center. Additional data is mined using the gRPC protocol and the flow table. All this is collected with Protobuf over UDP.
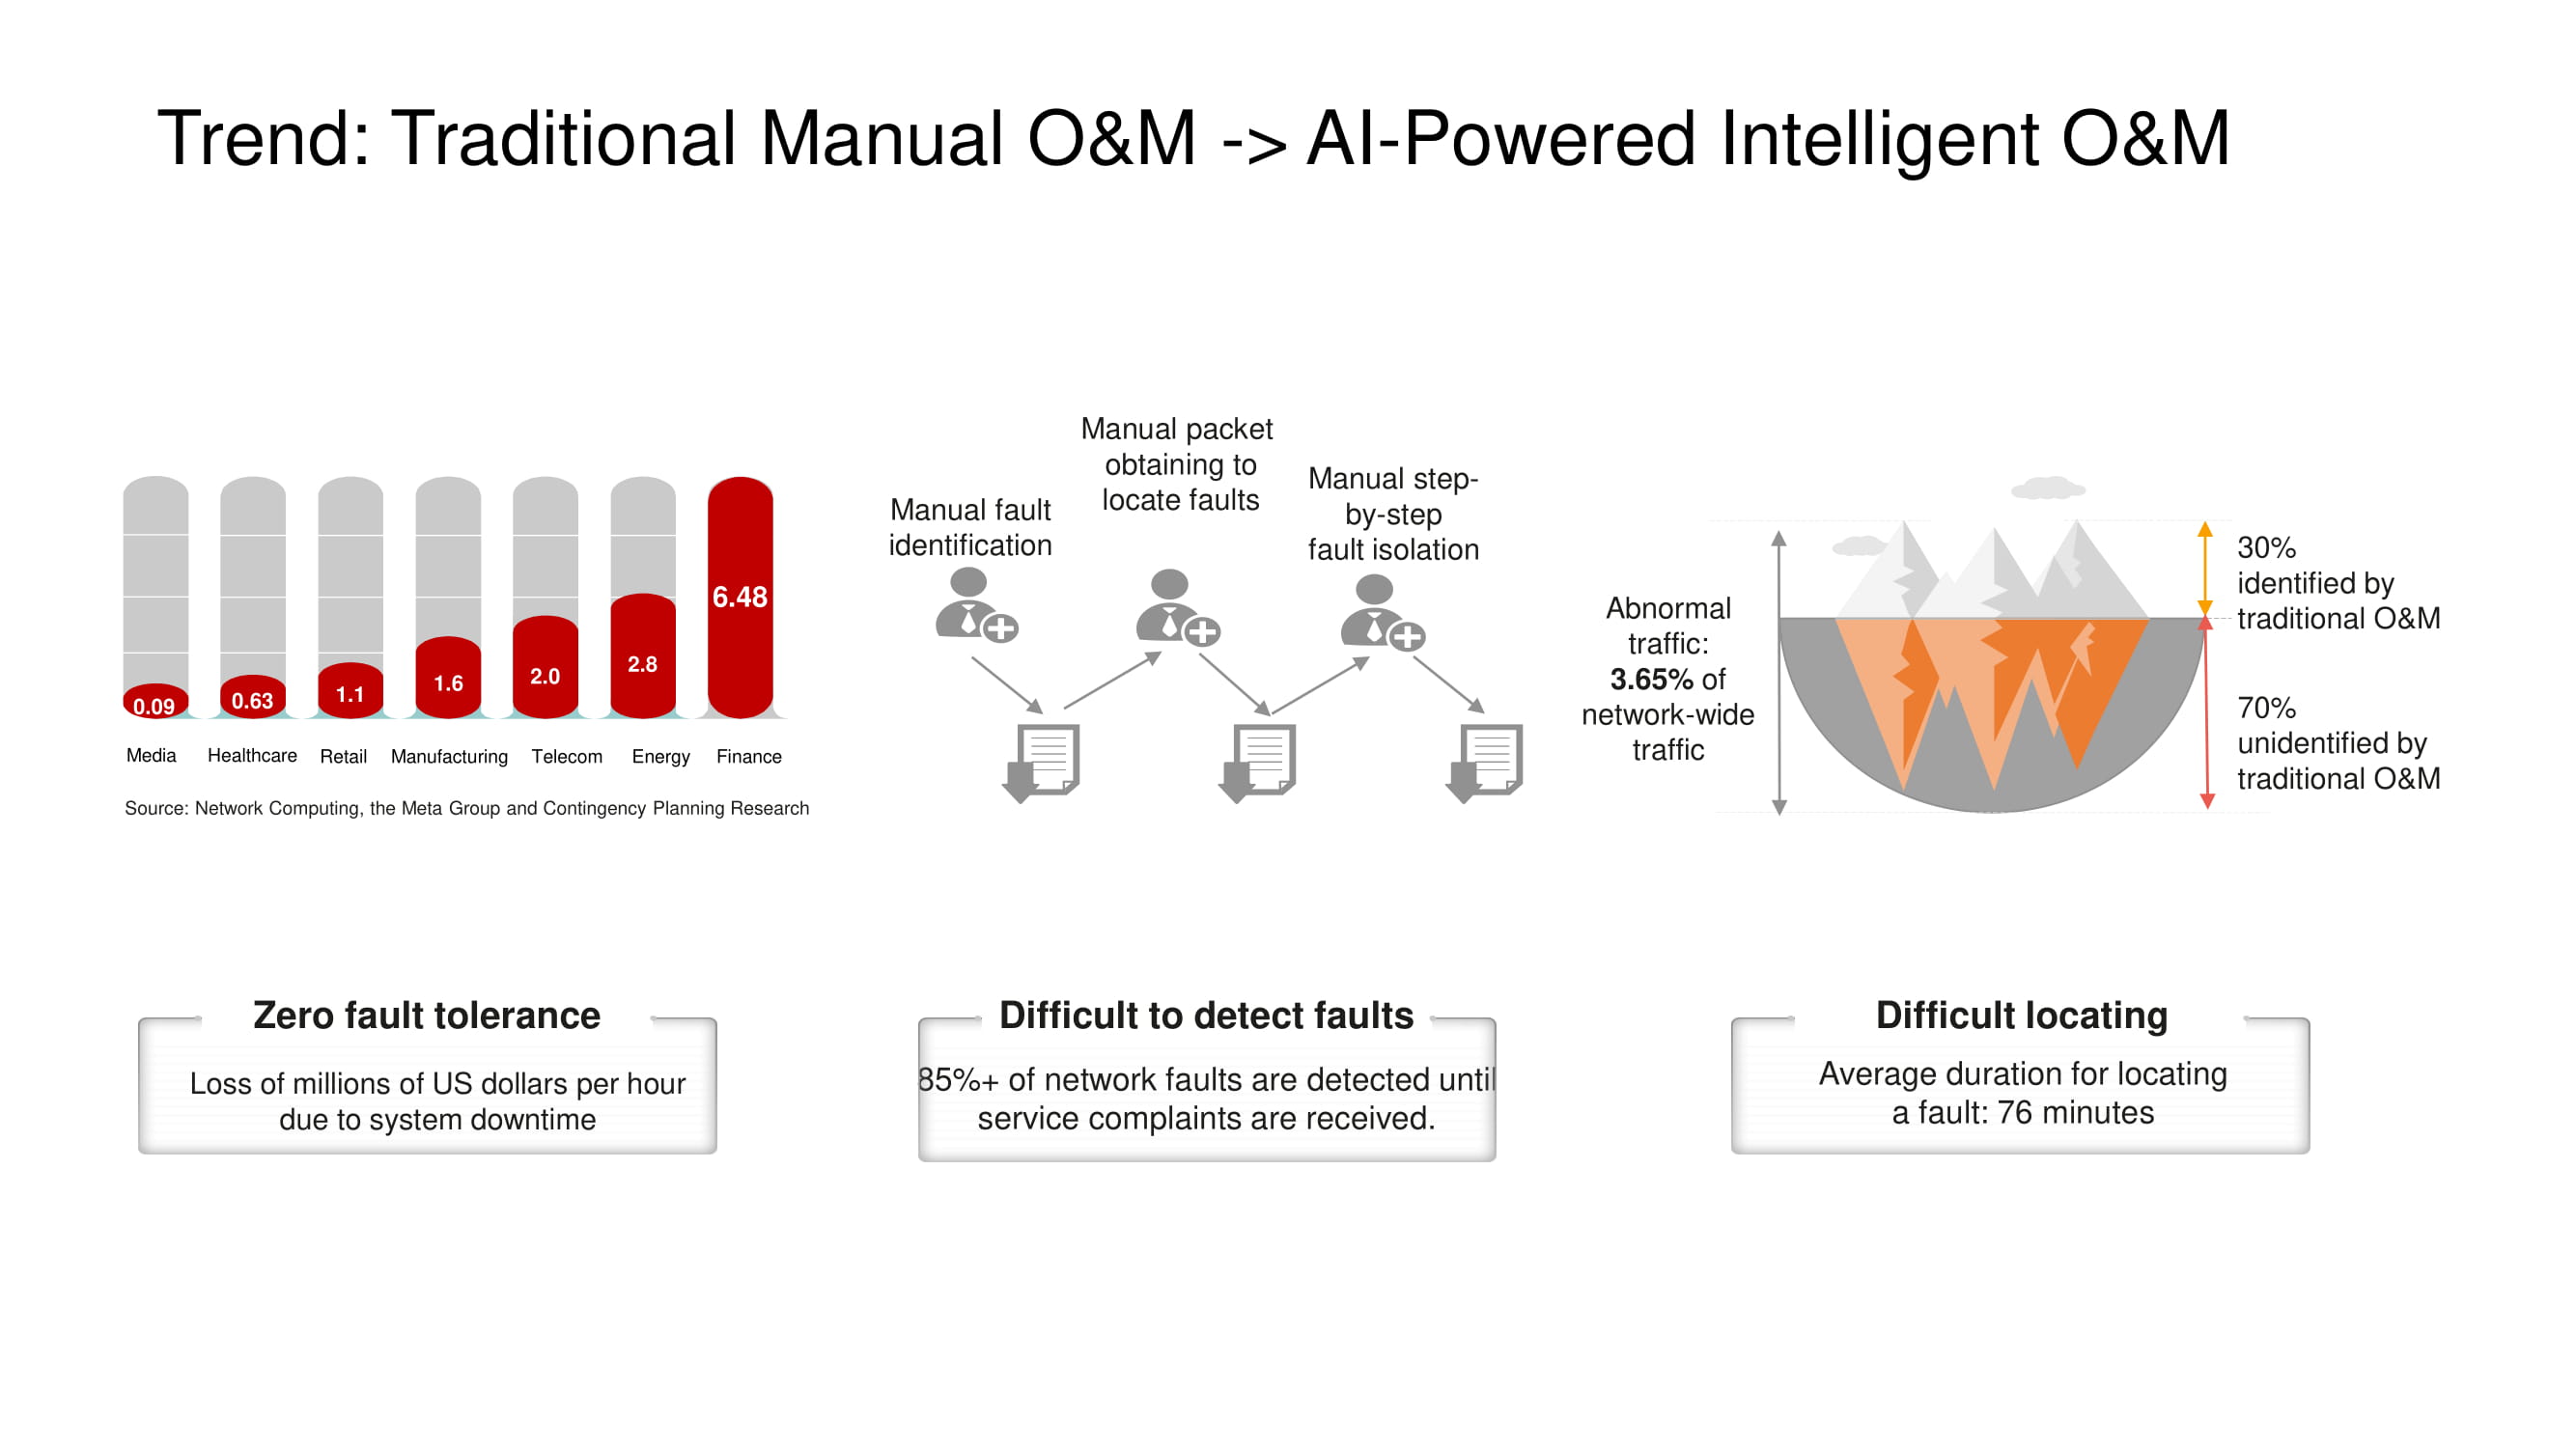
The main direction of development of O&M tools at Huawei is the transition from manual or semi-automatic network control to fully automatic , based on artificial intelligence technologies. An all-encompassing telemetry system of a fairly large site produces huge amounts of data, the analysis of which in a short time is possible only with the use of AI. This is especially important in those data centers, where failures and downtime are simply unacceptable.
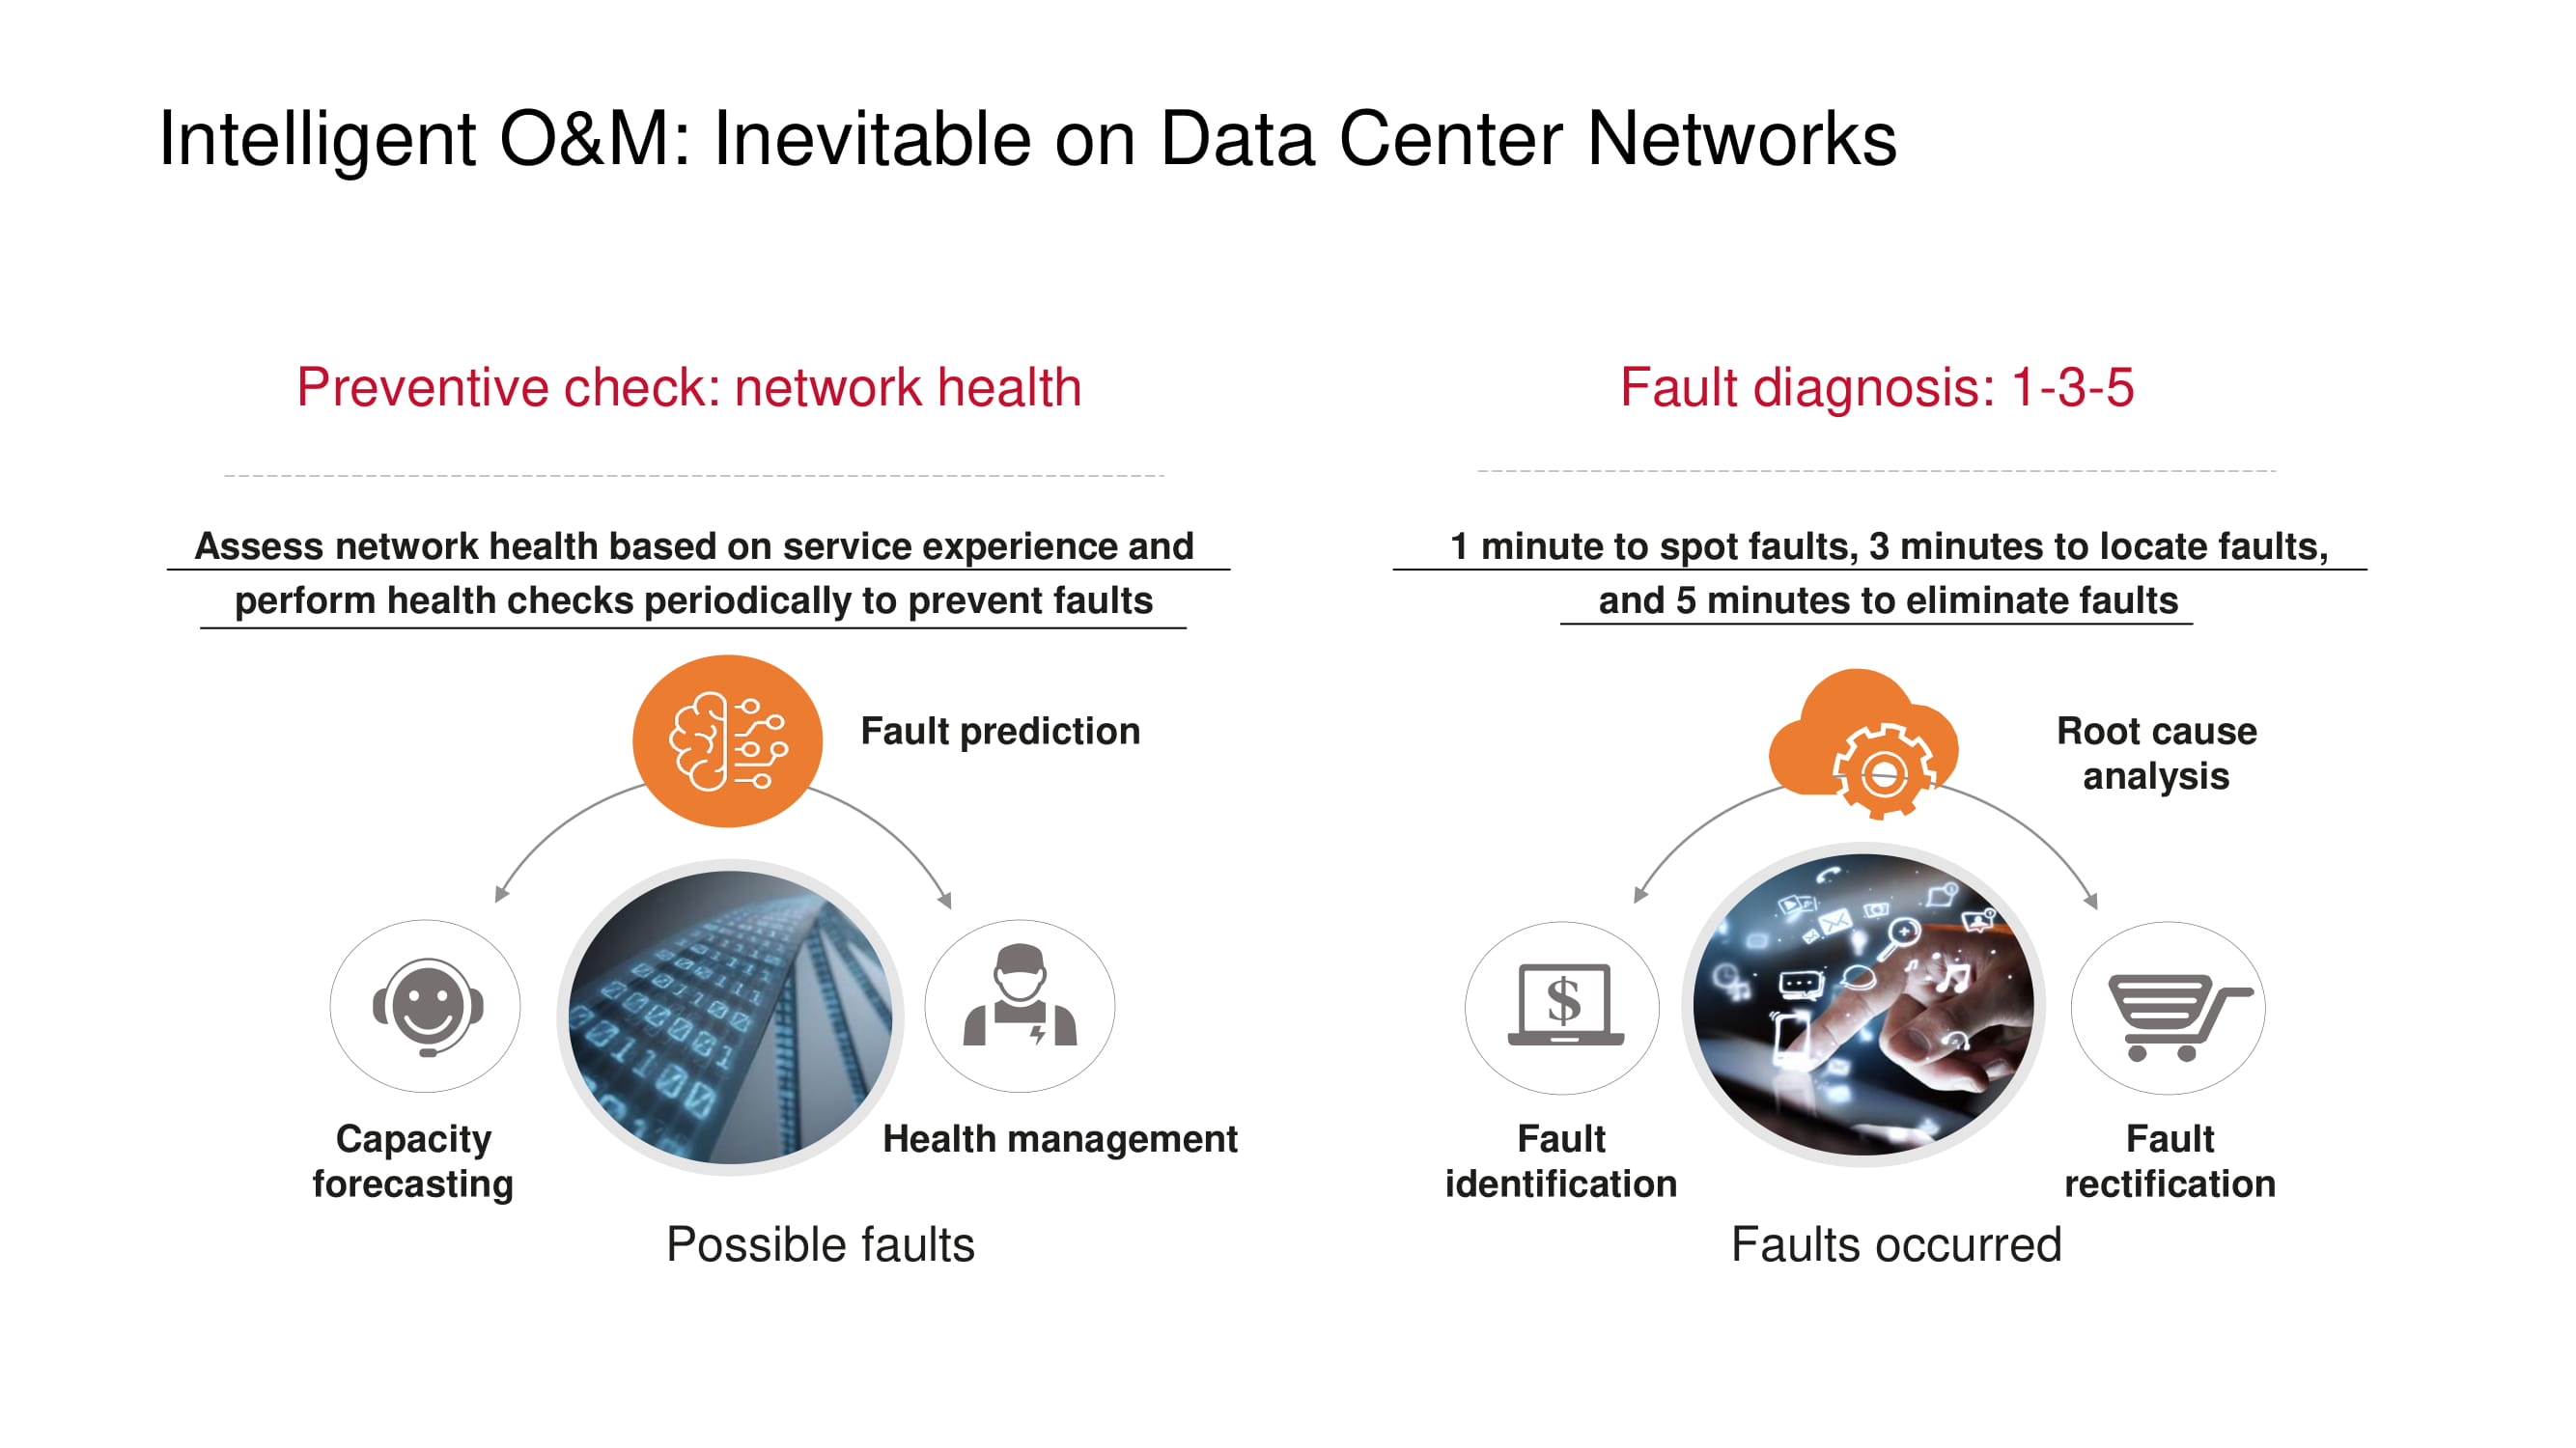
Preventive measures designed to prevent network problems from occurring, first of all, include monitoring the "health" of the network: monitoring channel load, identifying the causes of packet loss (for example, looking for a correlation with the time of day or the periods of operation of an application), detecting " bottlenecks (capacity forecasting), etc.
If problems are still observed, the 1-3-5 principle put forward by Huawei helps to minimize the diagnostic and recovery time: a minute to search, three minutes to localize, five minutes to eliminate the problem. In order to keep within this framework, Huawei products support an ever-expanding list of typical faults that are automatically detected.

Model V100R019C10 for small data centers
One of the main innovations in V100R019C10 is support for visualization based on telemetry data in all types of scenarios. In fact, we are talking about a visual display of any changes in the network. In addition, the device is now able to identify more than 75 root causes of certain problems and helps to outline actions to eliminate them (launching scripts, etc.).
In important news, the Standalone version, which includes both the iMaster NCE and FabricInsight, is available primarily for small data centers that do not require multiple servers to manage the network.
Changes in the licensing system
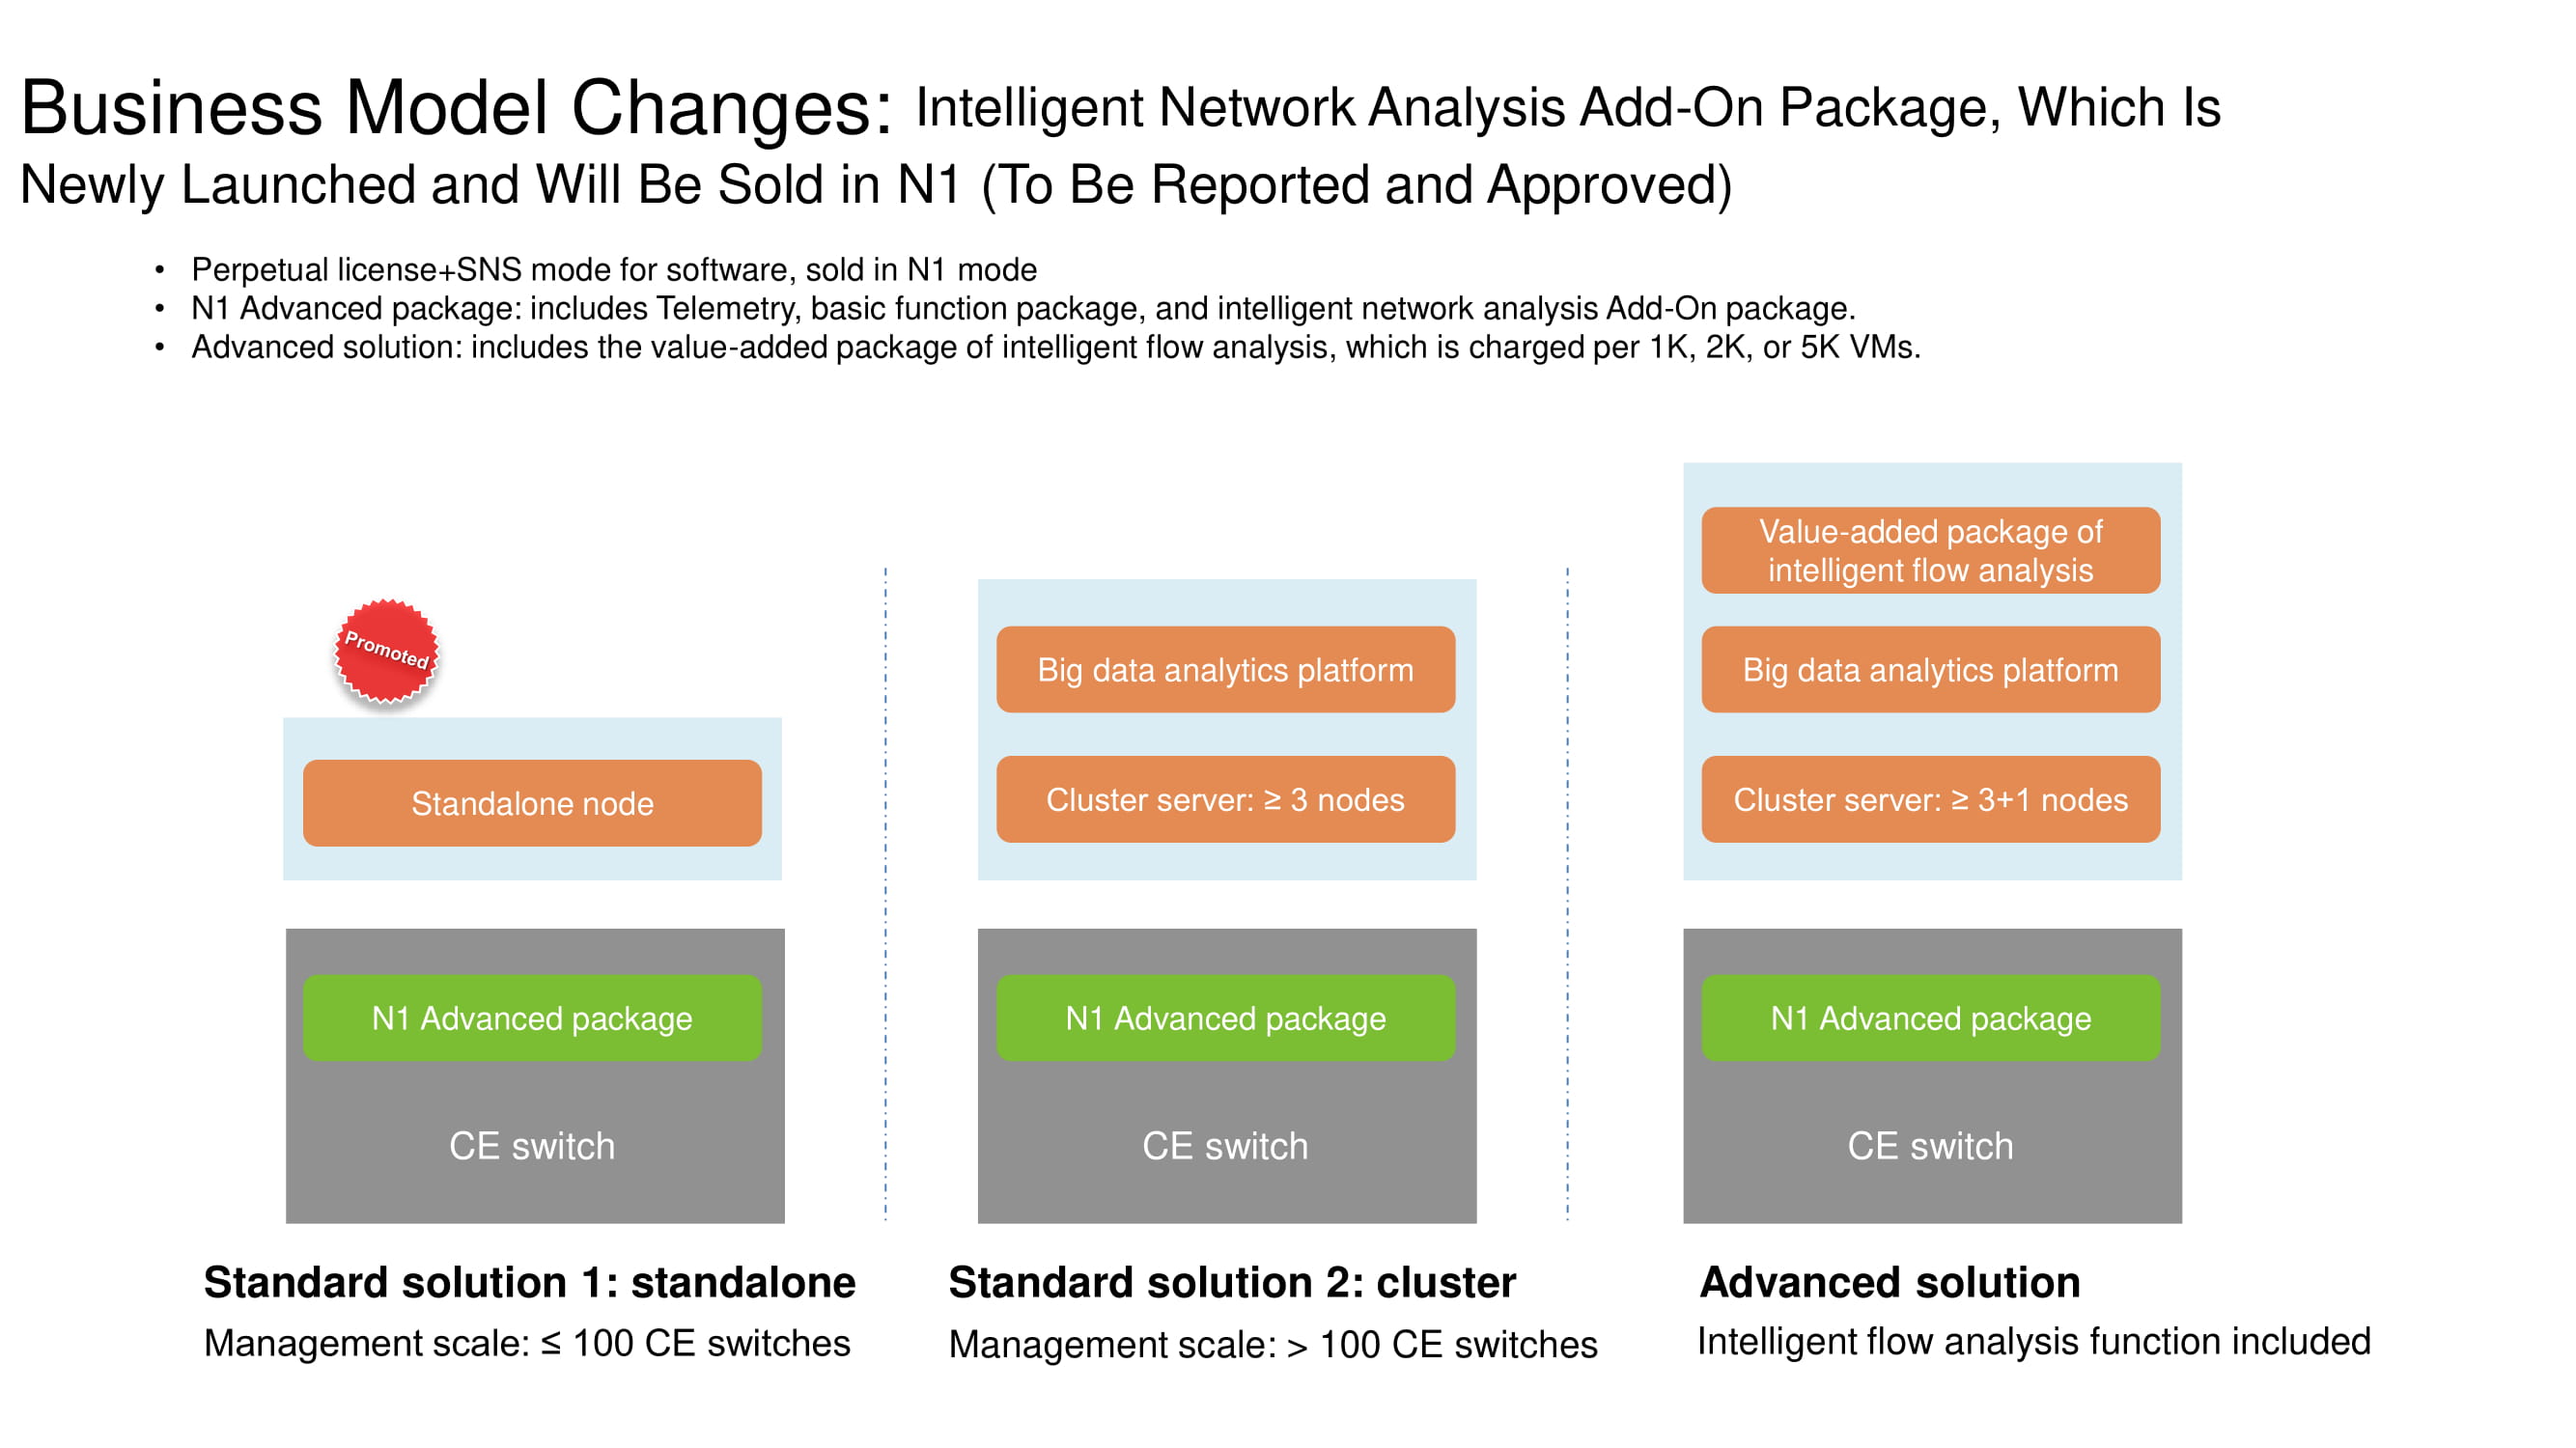
For a better understanding of the functional features of FabricInsight, it should be explained what changes have occurred in the business model for the distribution of Huawei network products. If the number of switches does not reach hundreds, this option is classified as standalone edition and implies a N1 license. A cluster of three or more servers already comes bundled with a big data analytics platform. The Advanced solution, which includes several hundred switches, is recommended to be used in conjunction with tools for analyzing network flows. All three options allow FabricInsight capabilities with an N1 license.
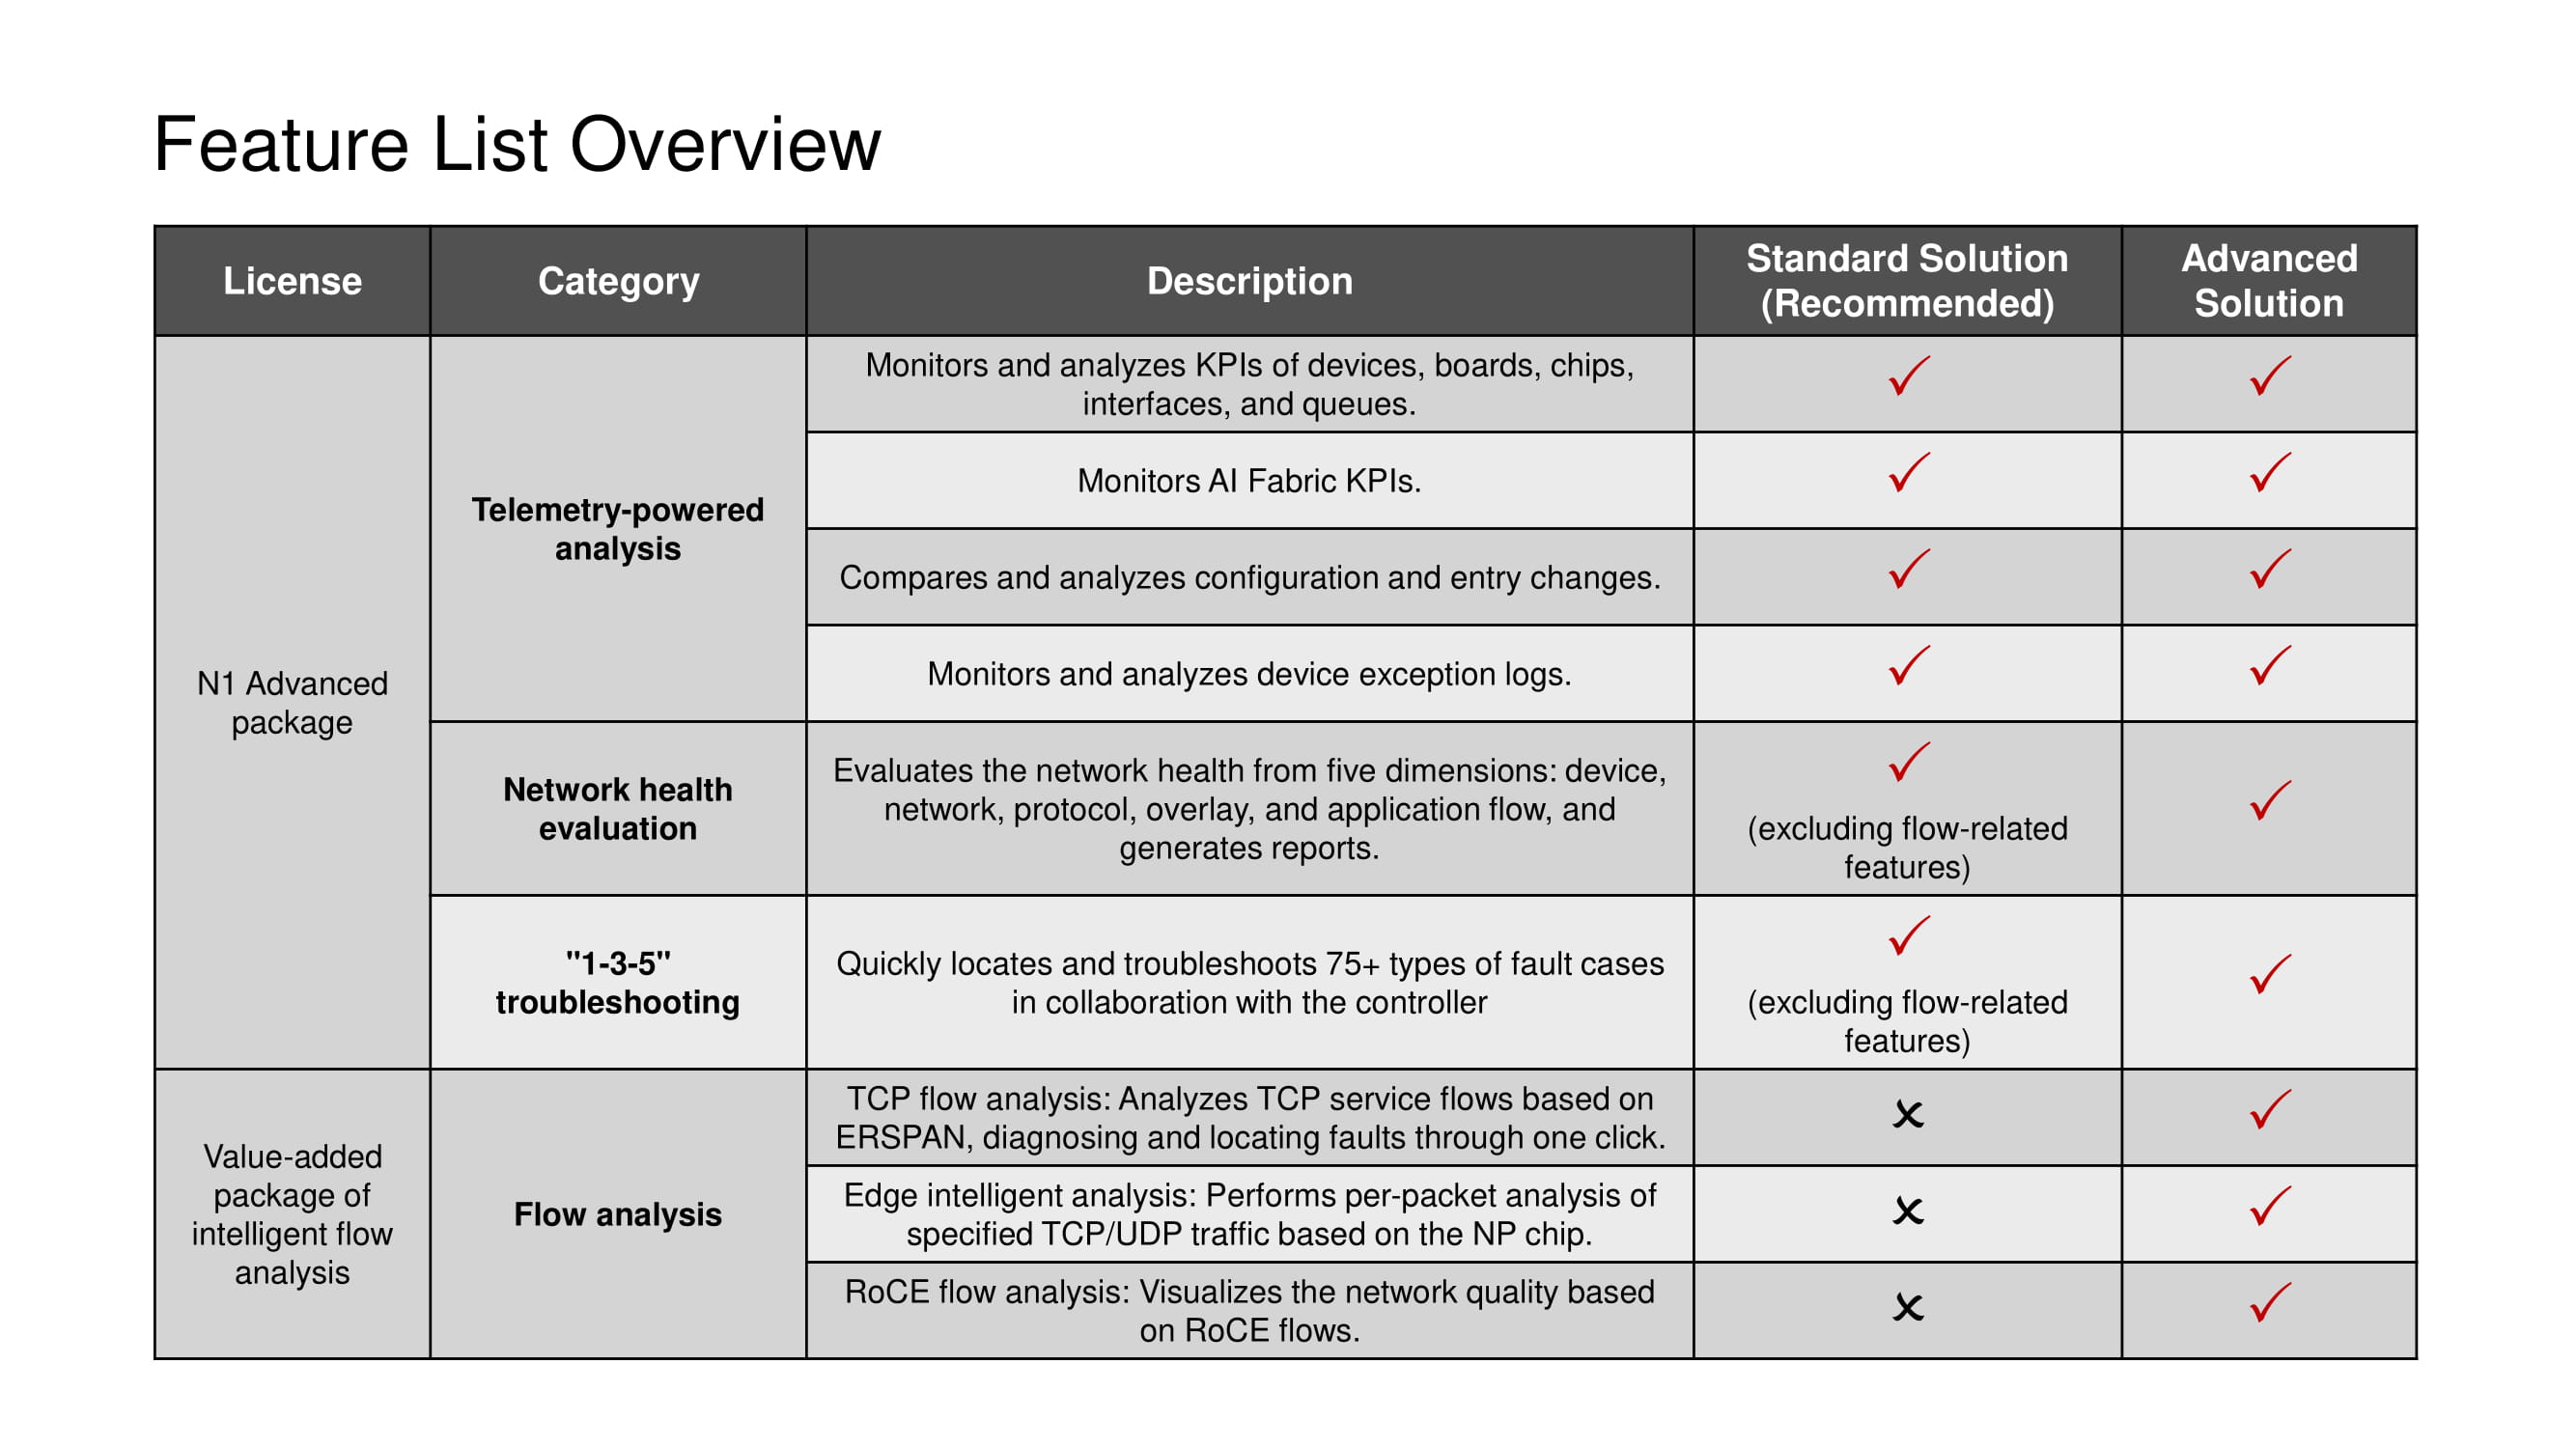
Any license implies the use of the entire set of telemetry tools and scenarios 1-3-5, with the exception of TCP-stream analysis tools available only in Advanced solution.
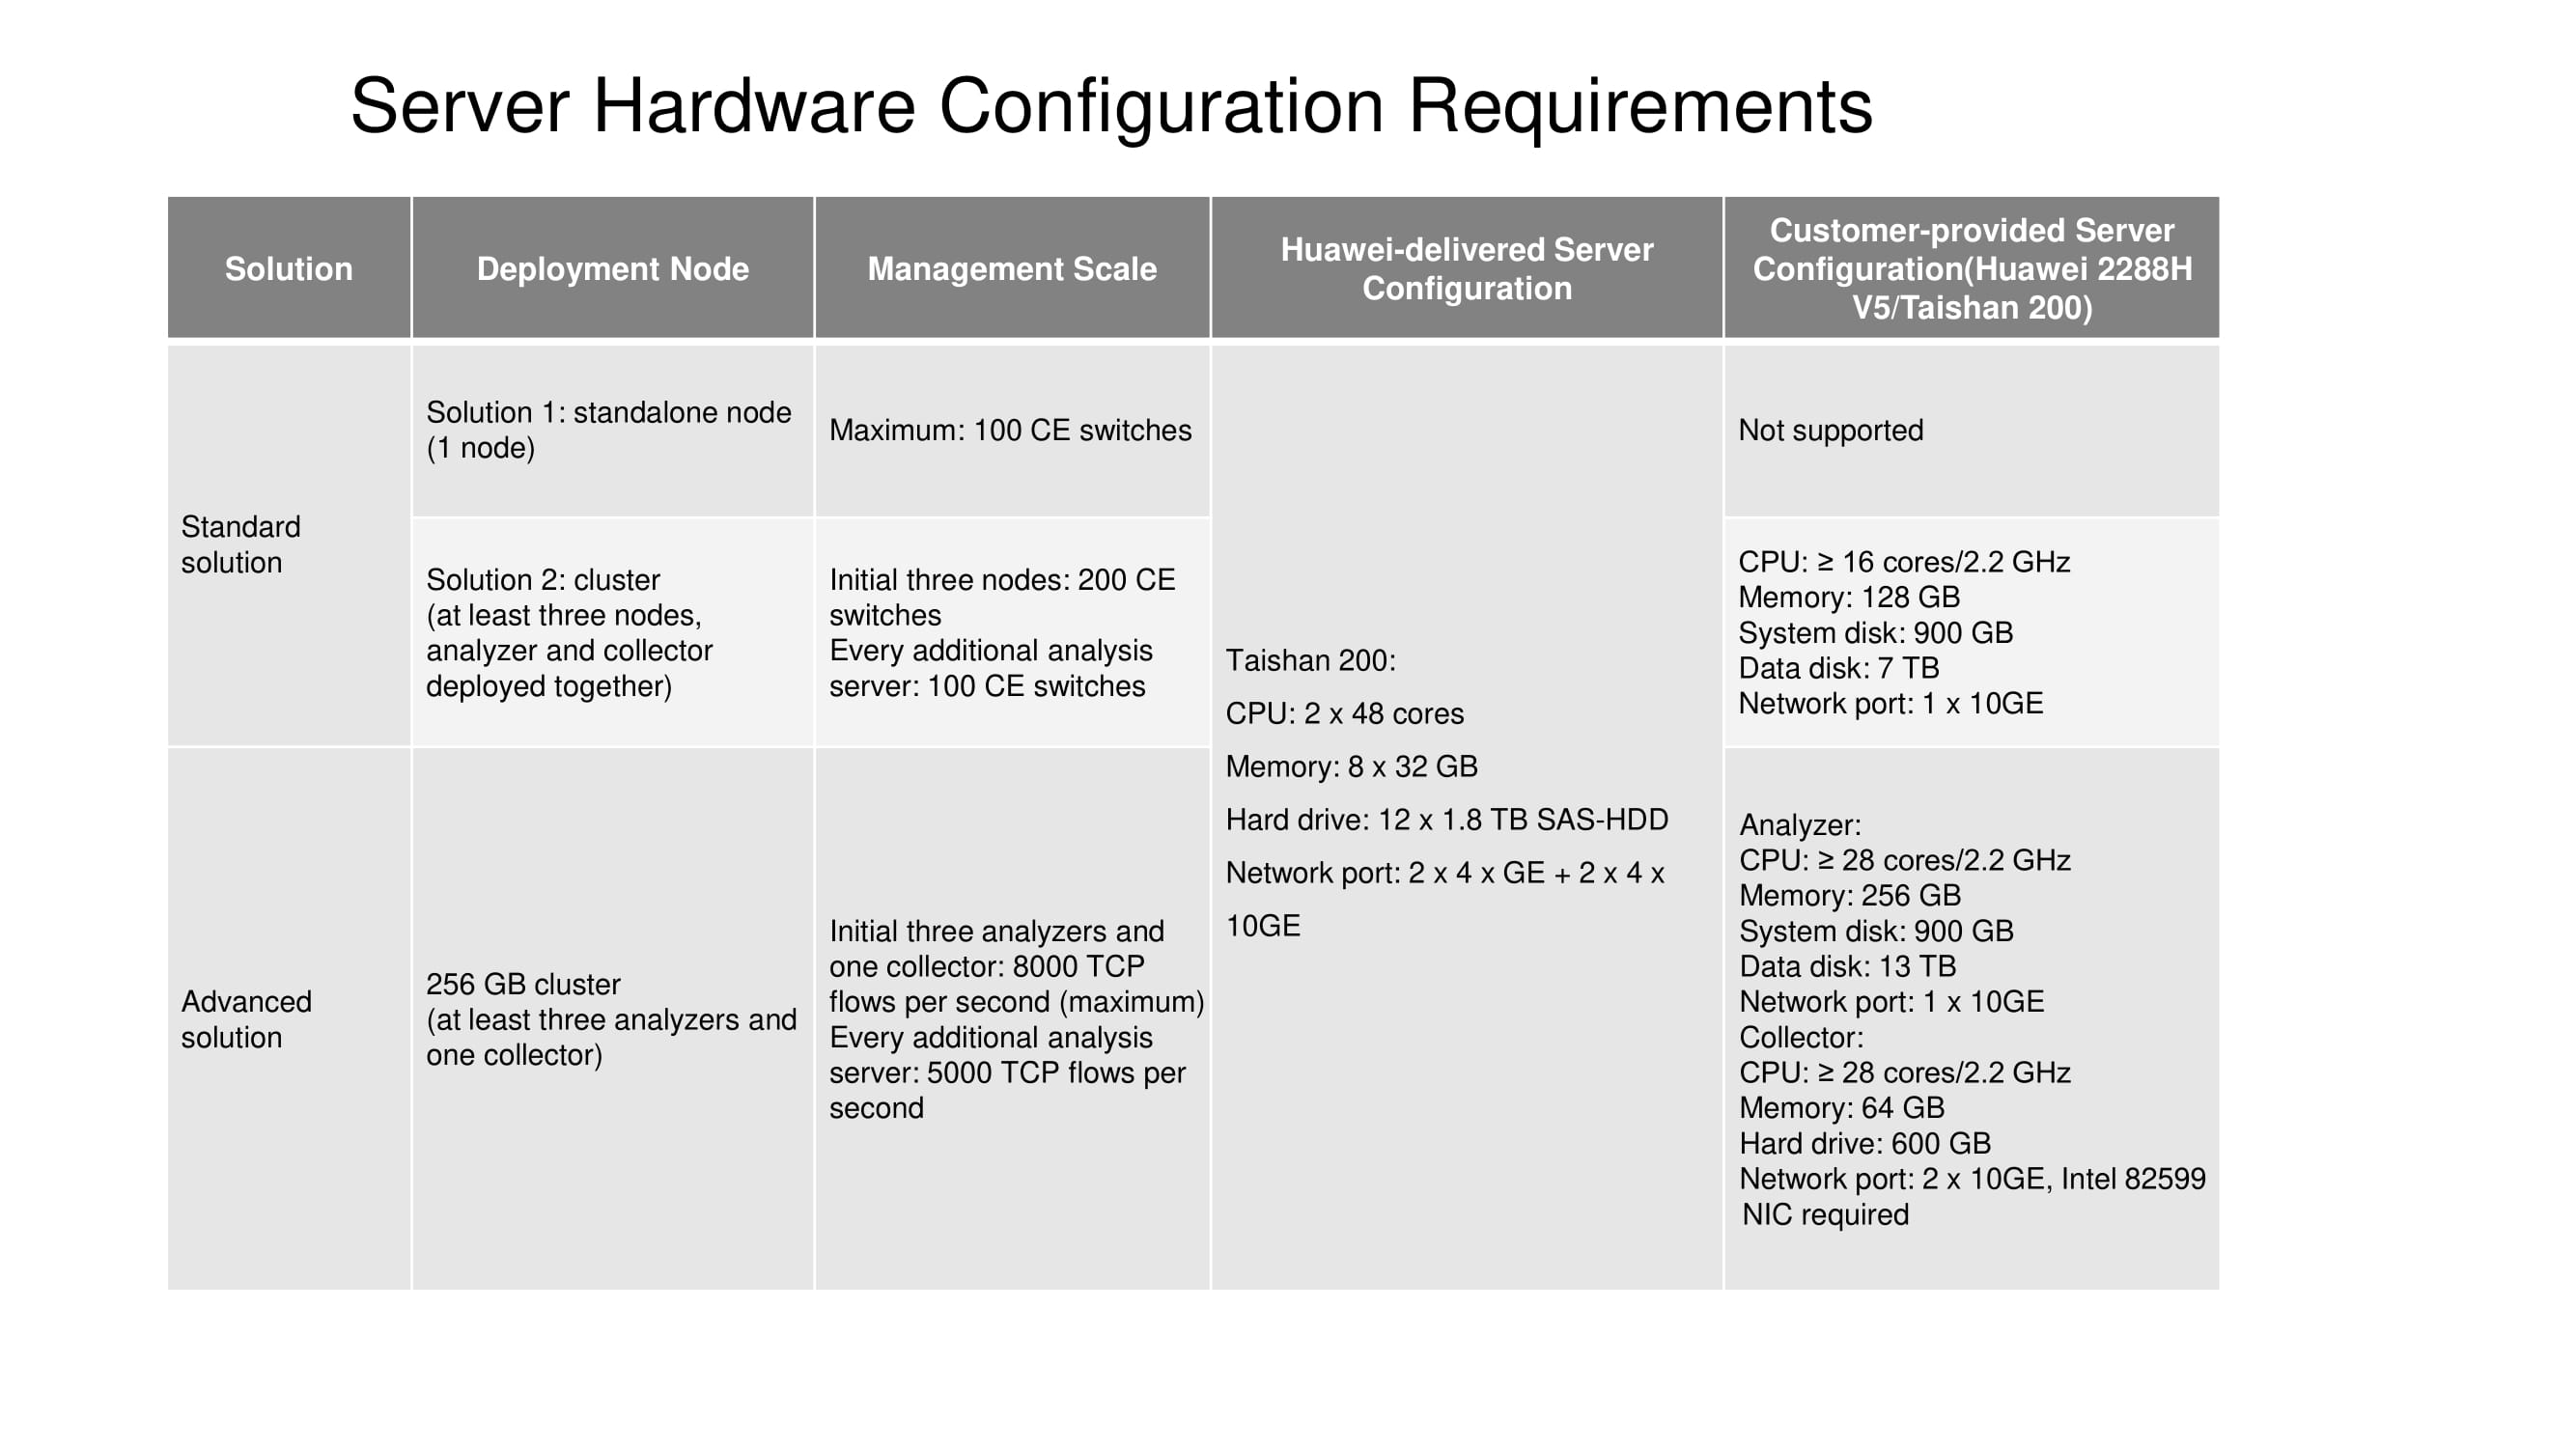
It remains to tell you about the server configurations designed for Standard and Advanced solutions. Currently, a standalone node (one node) is available only on the Taishan 200 server. A three-node cluster requires 16 or more computing cores, 128 GB of RAM, etc. (see diagram). The size of the data disk directly depends on how long the statistics should be stored.
KPI monitoring
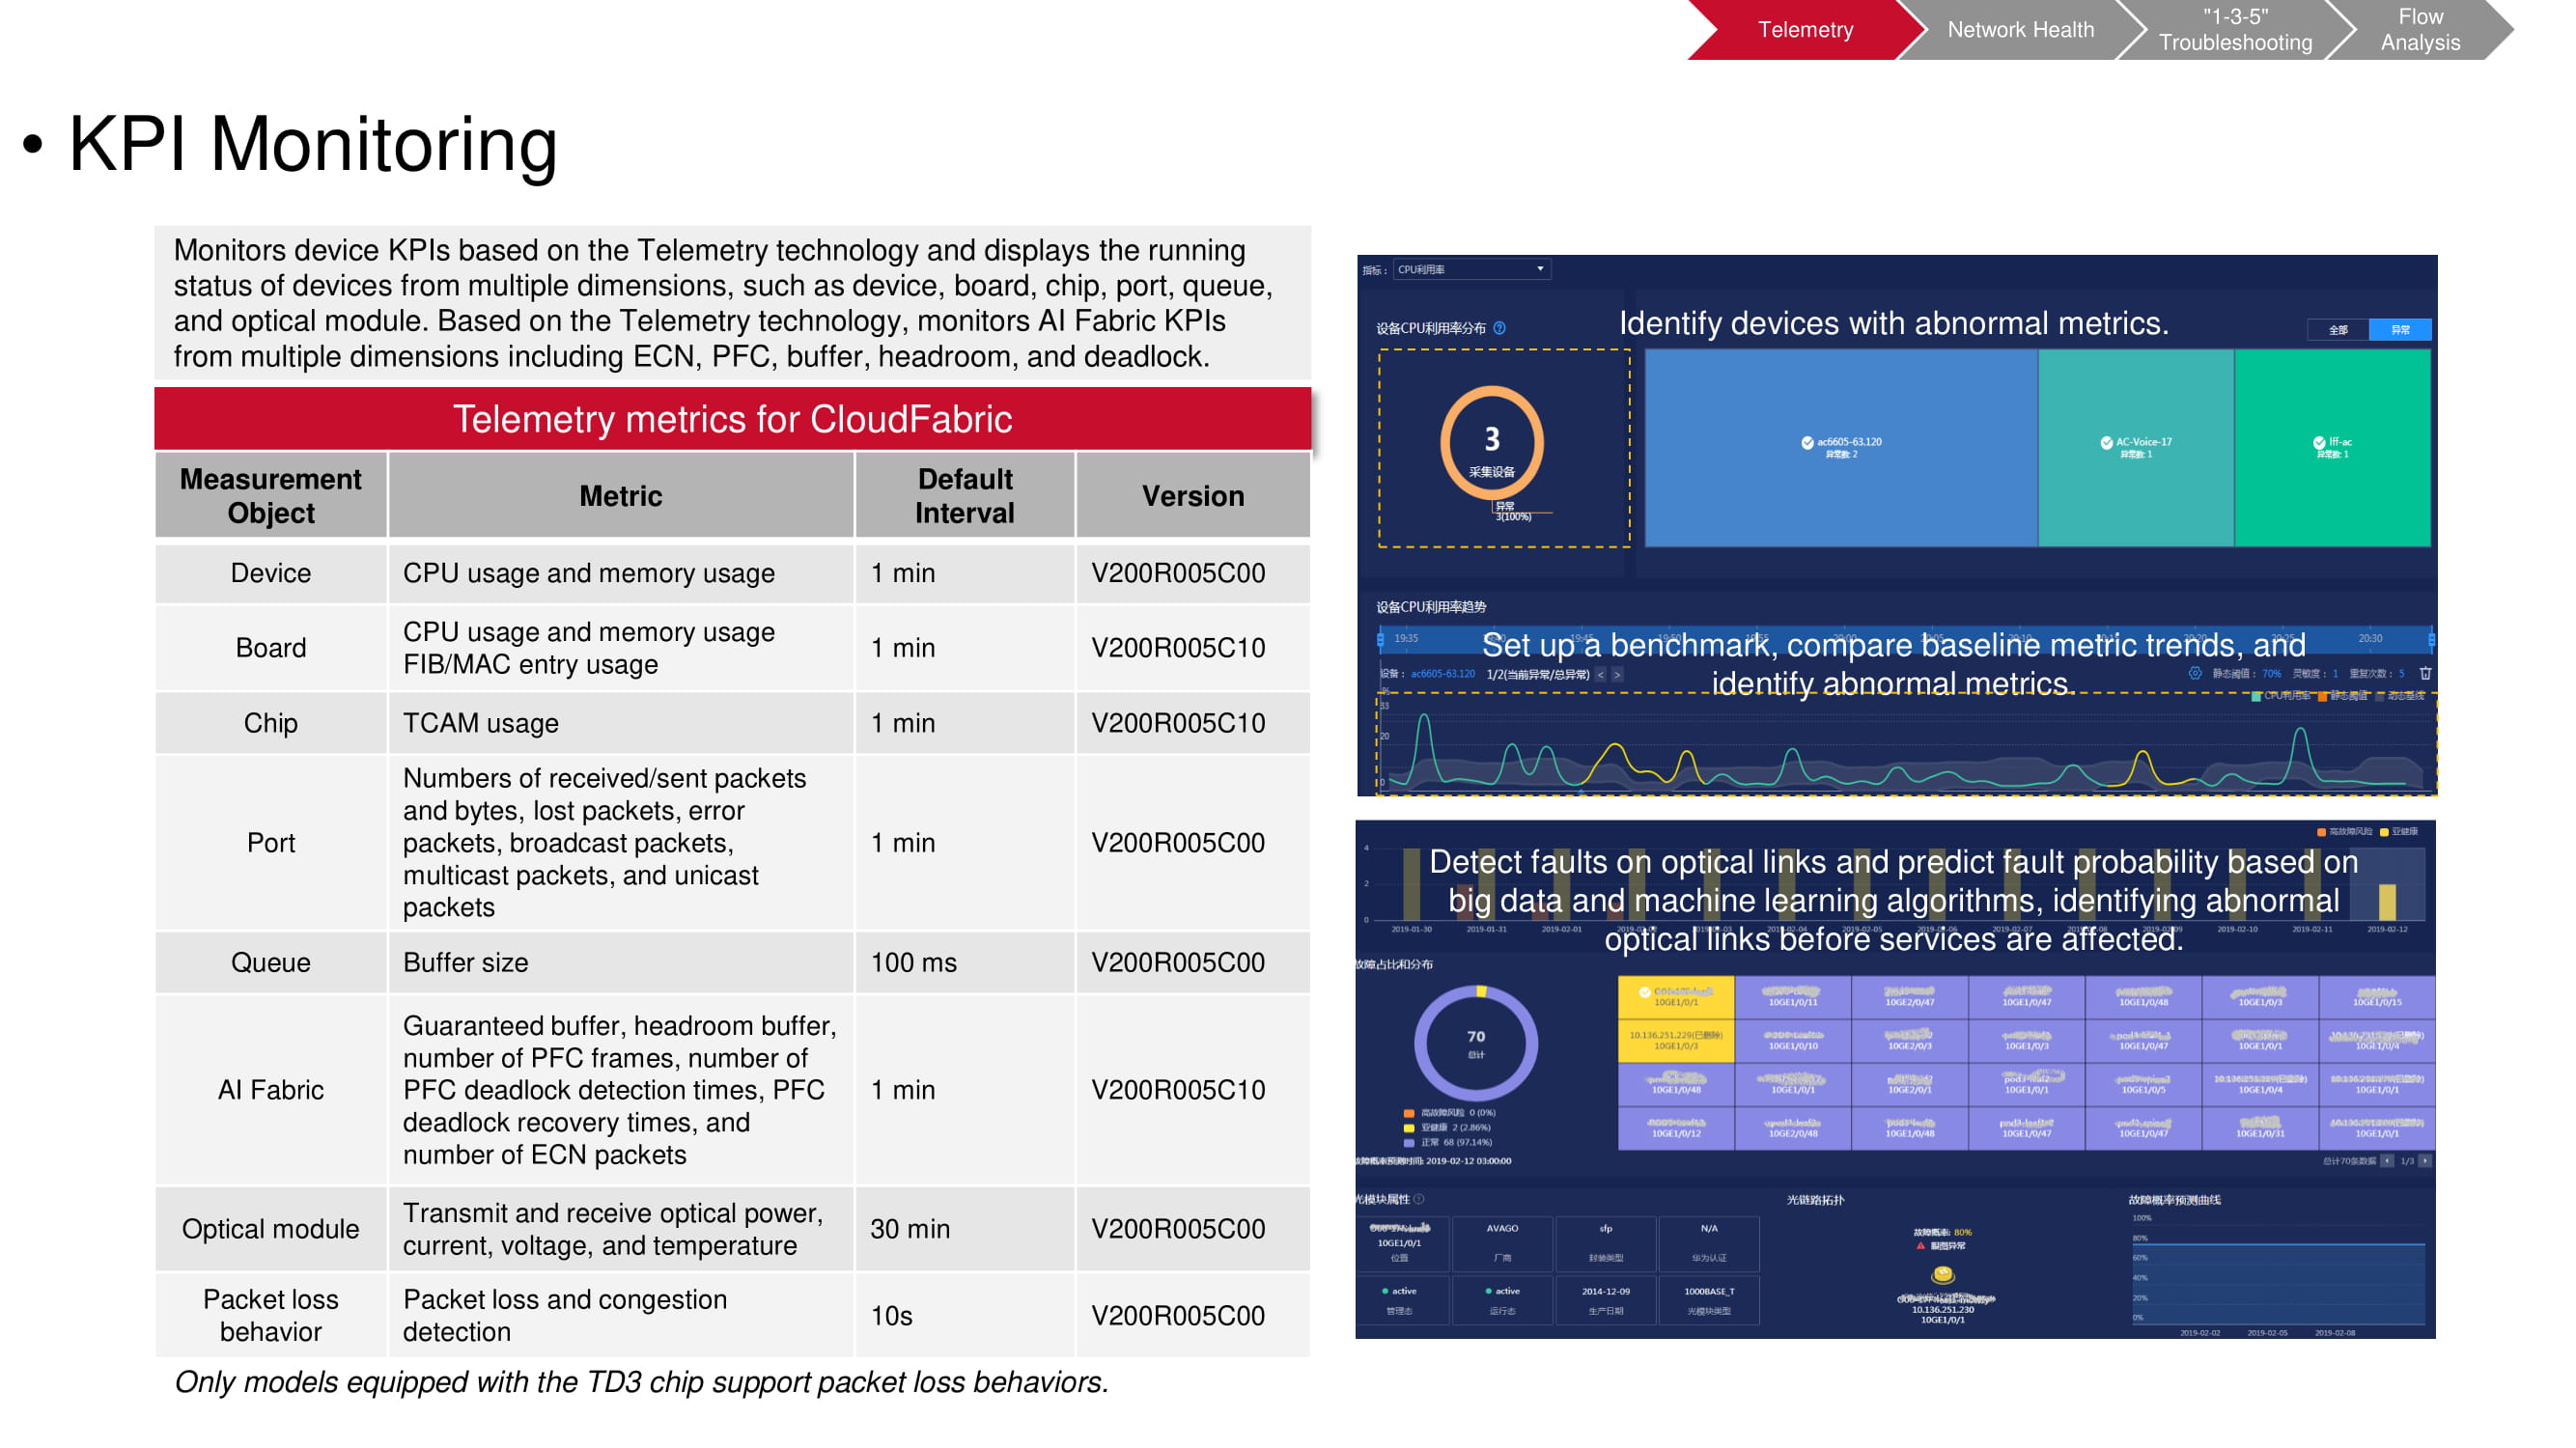
Let's take a closer look at KPI monitoring. To use it, it is enough to set a time interval and specific threshold values, the achievement of which will be checked based on the received telemetry data. There are many types of metrics available, including:
- CPU and memory usage;
- use of FIB / MAC;
- use of ternary associative memory (TCAM) of the chip;
- port parameters;
- the size of the buffer for the queue;
- different AI Fabric metrics;
- signal level, temperature and other parameters of the optical module;
- packet loss.
Preliminary check
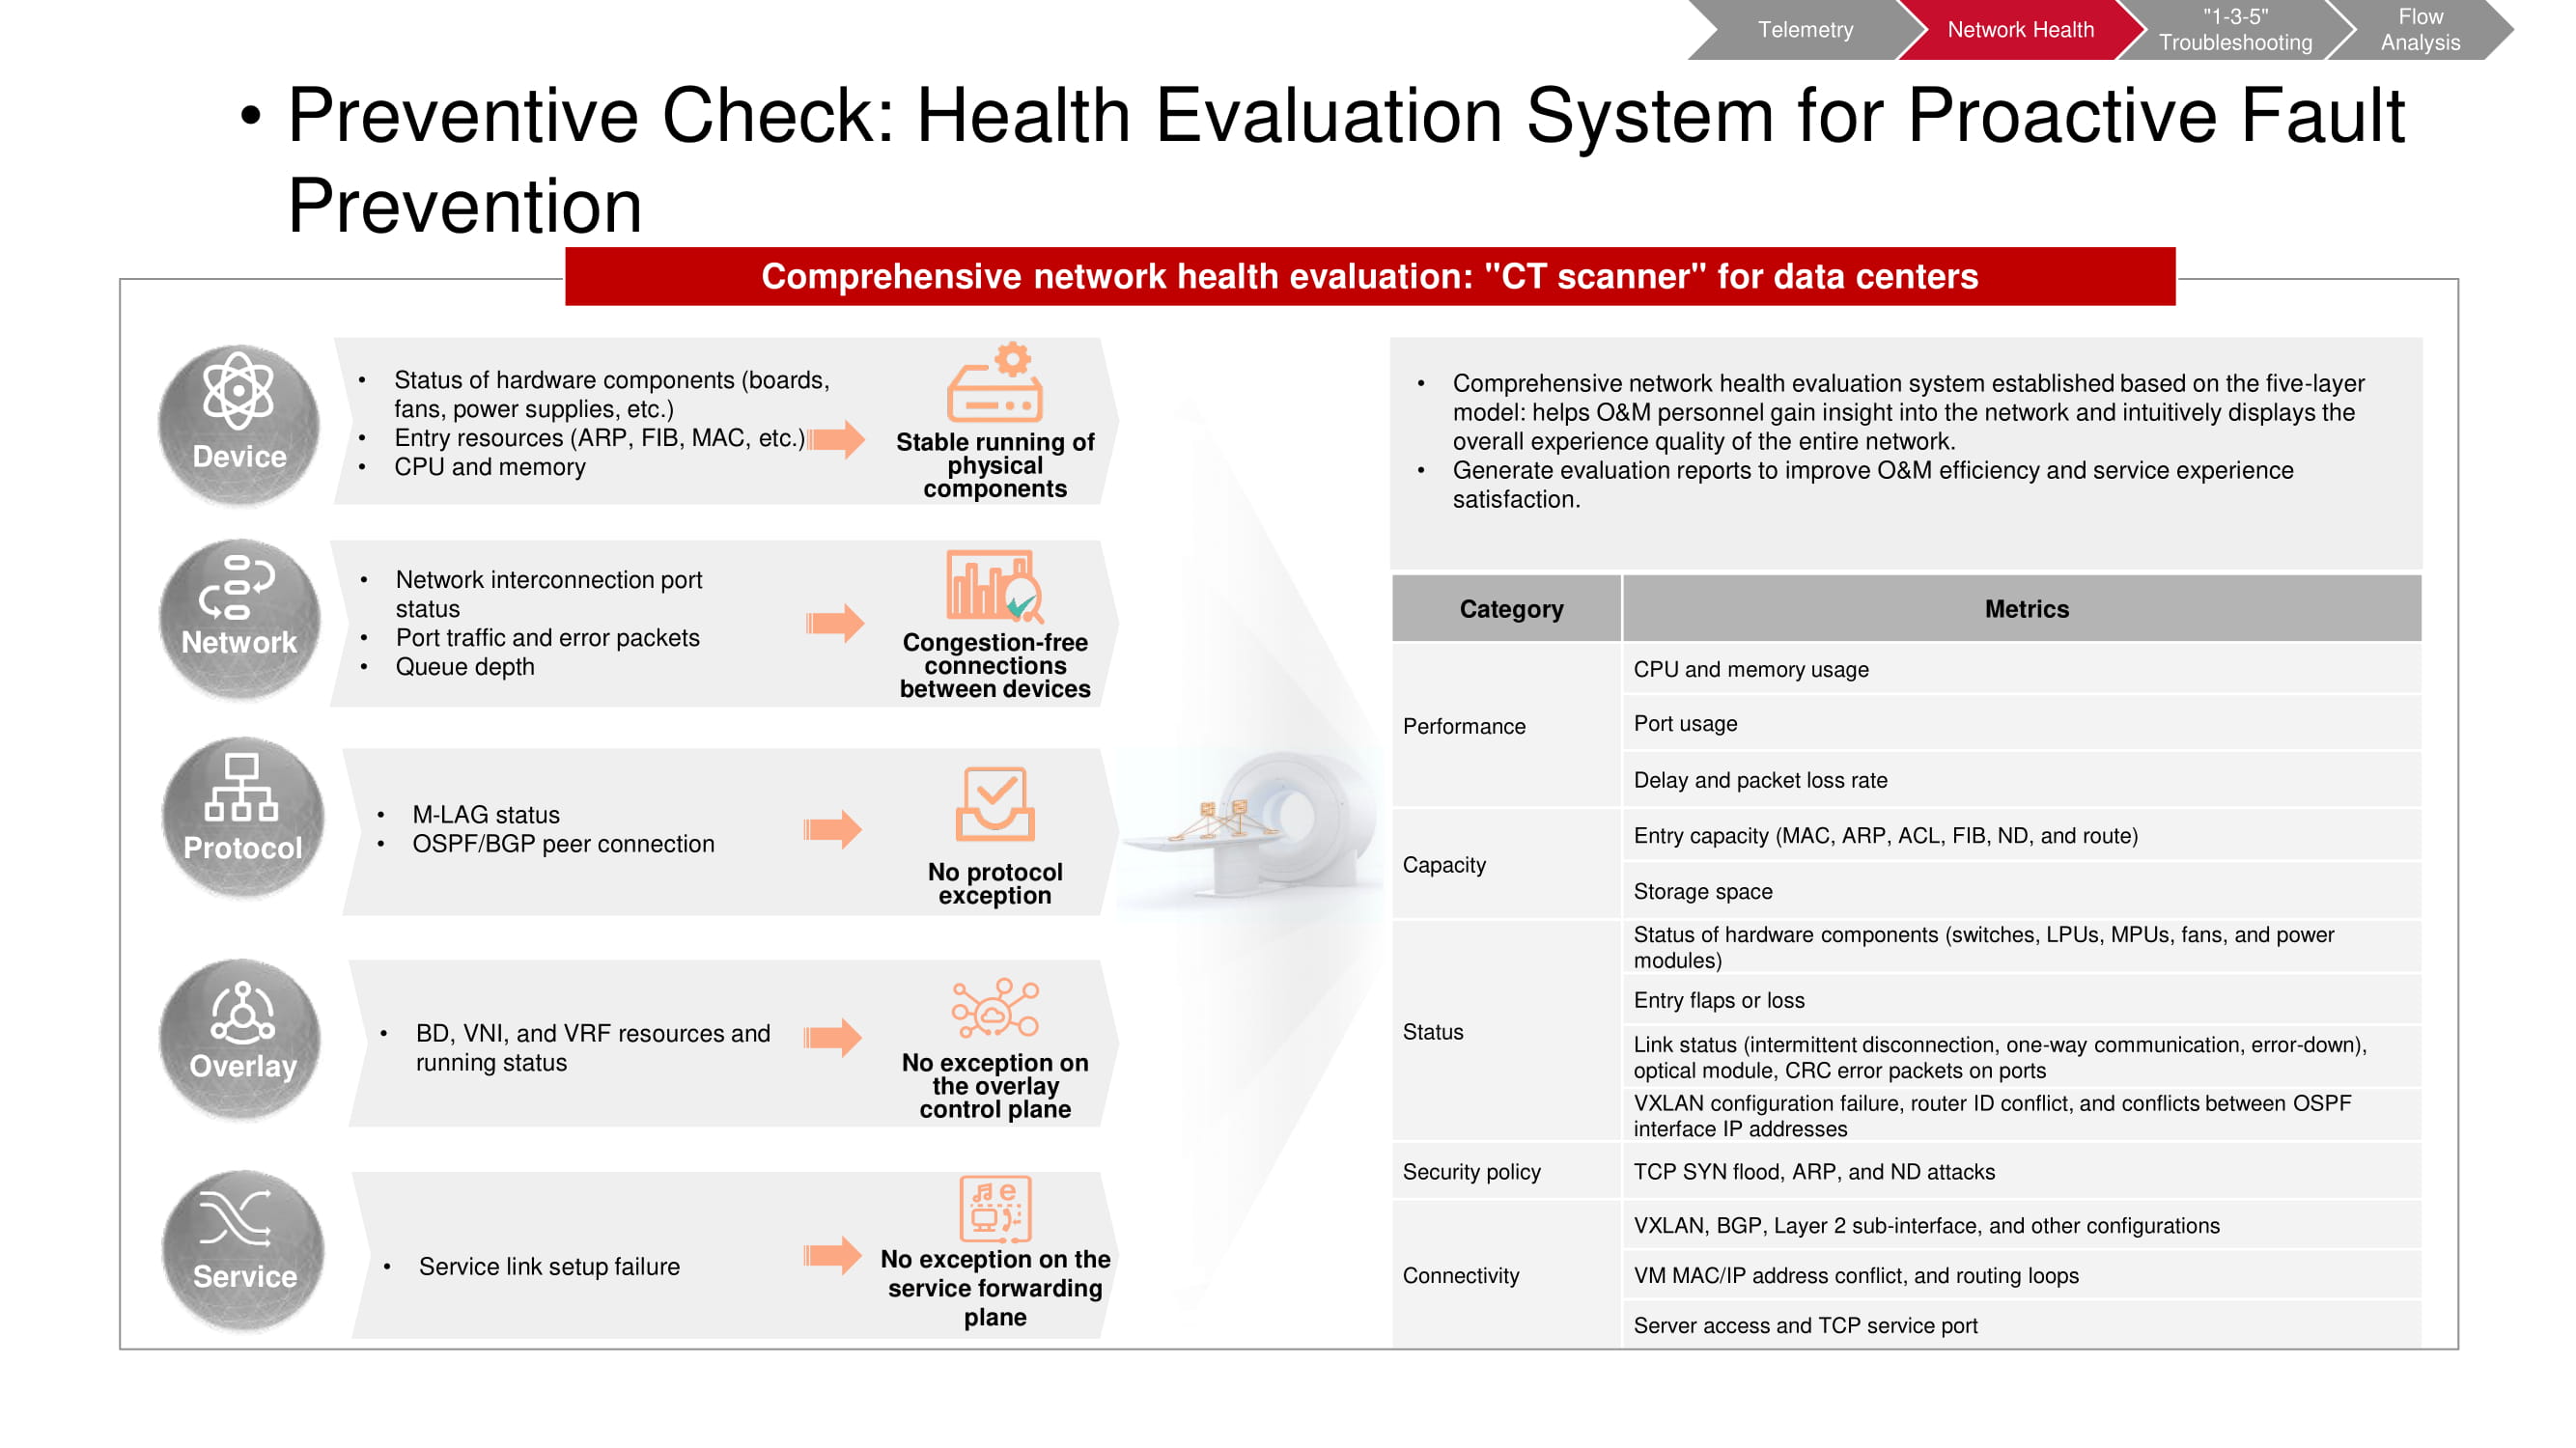
The pre-validation tool also operates on telemetry data. CT scanner allows you to understand whether certain unwanted events have occurred on the network. Some of the metrics coincide with the KPI-monitoring metrics of the "factory" (mainly related to capacity and performance). The rest are based on the results of top-level analysis (VXLAN, BGP, etc.) and configuration analysis. After starting the CT scanner, it collects the necessary information and generates a comprehensive report on the state of the network.
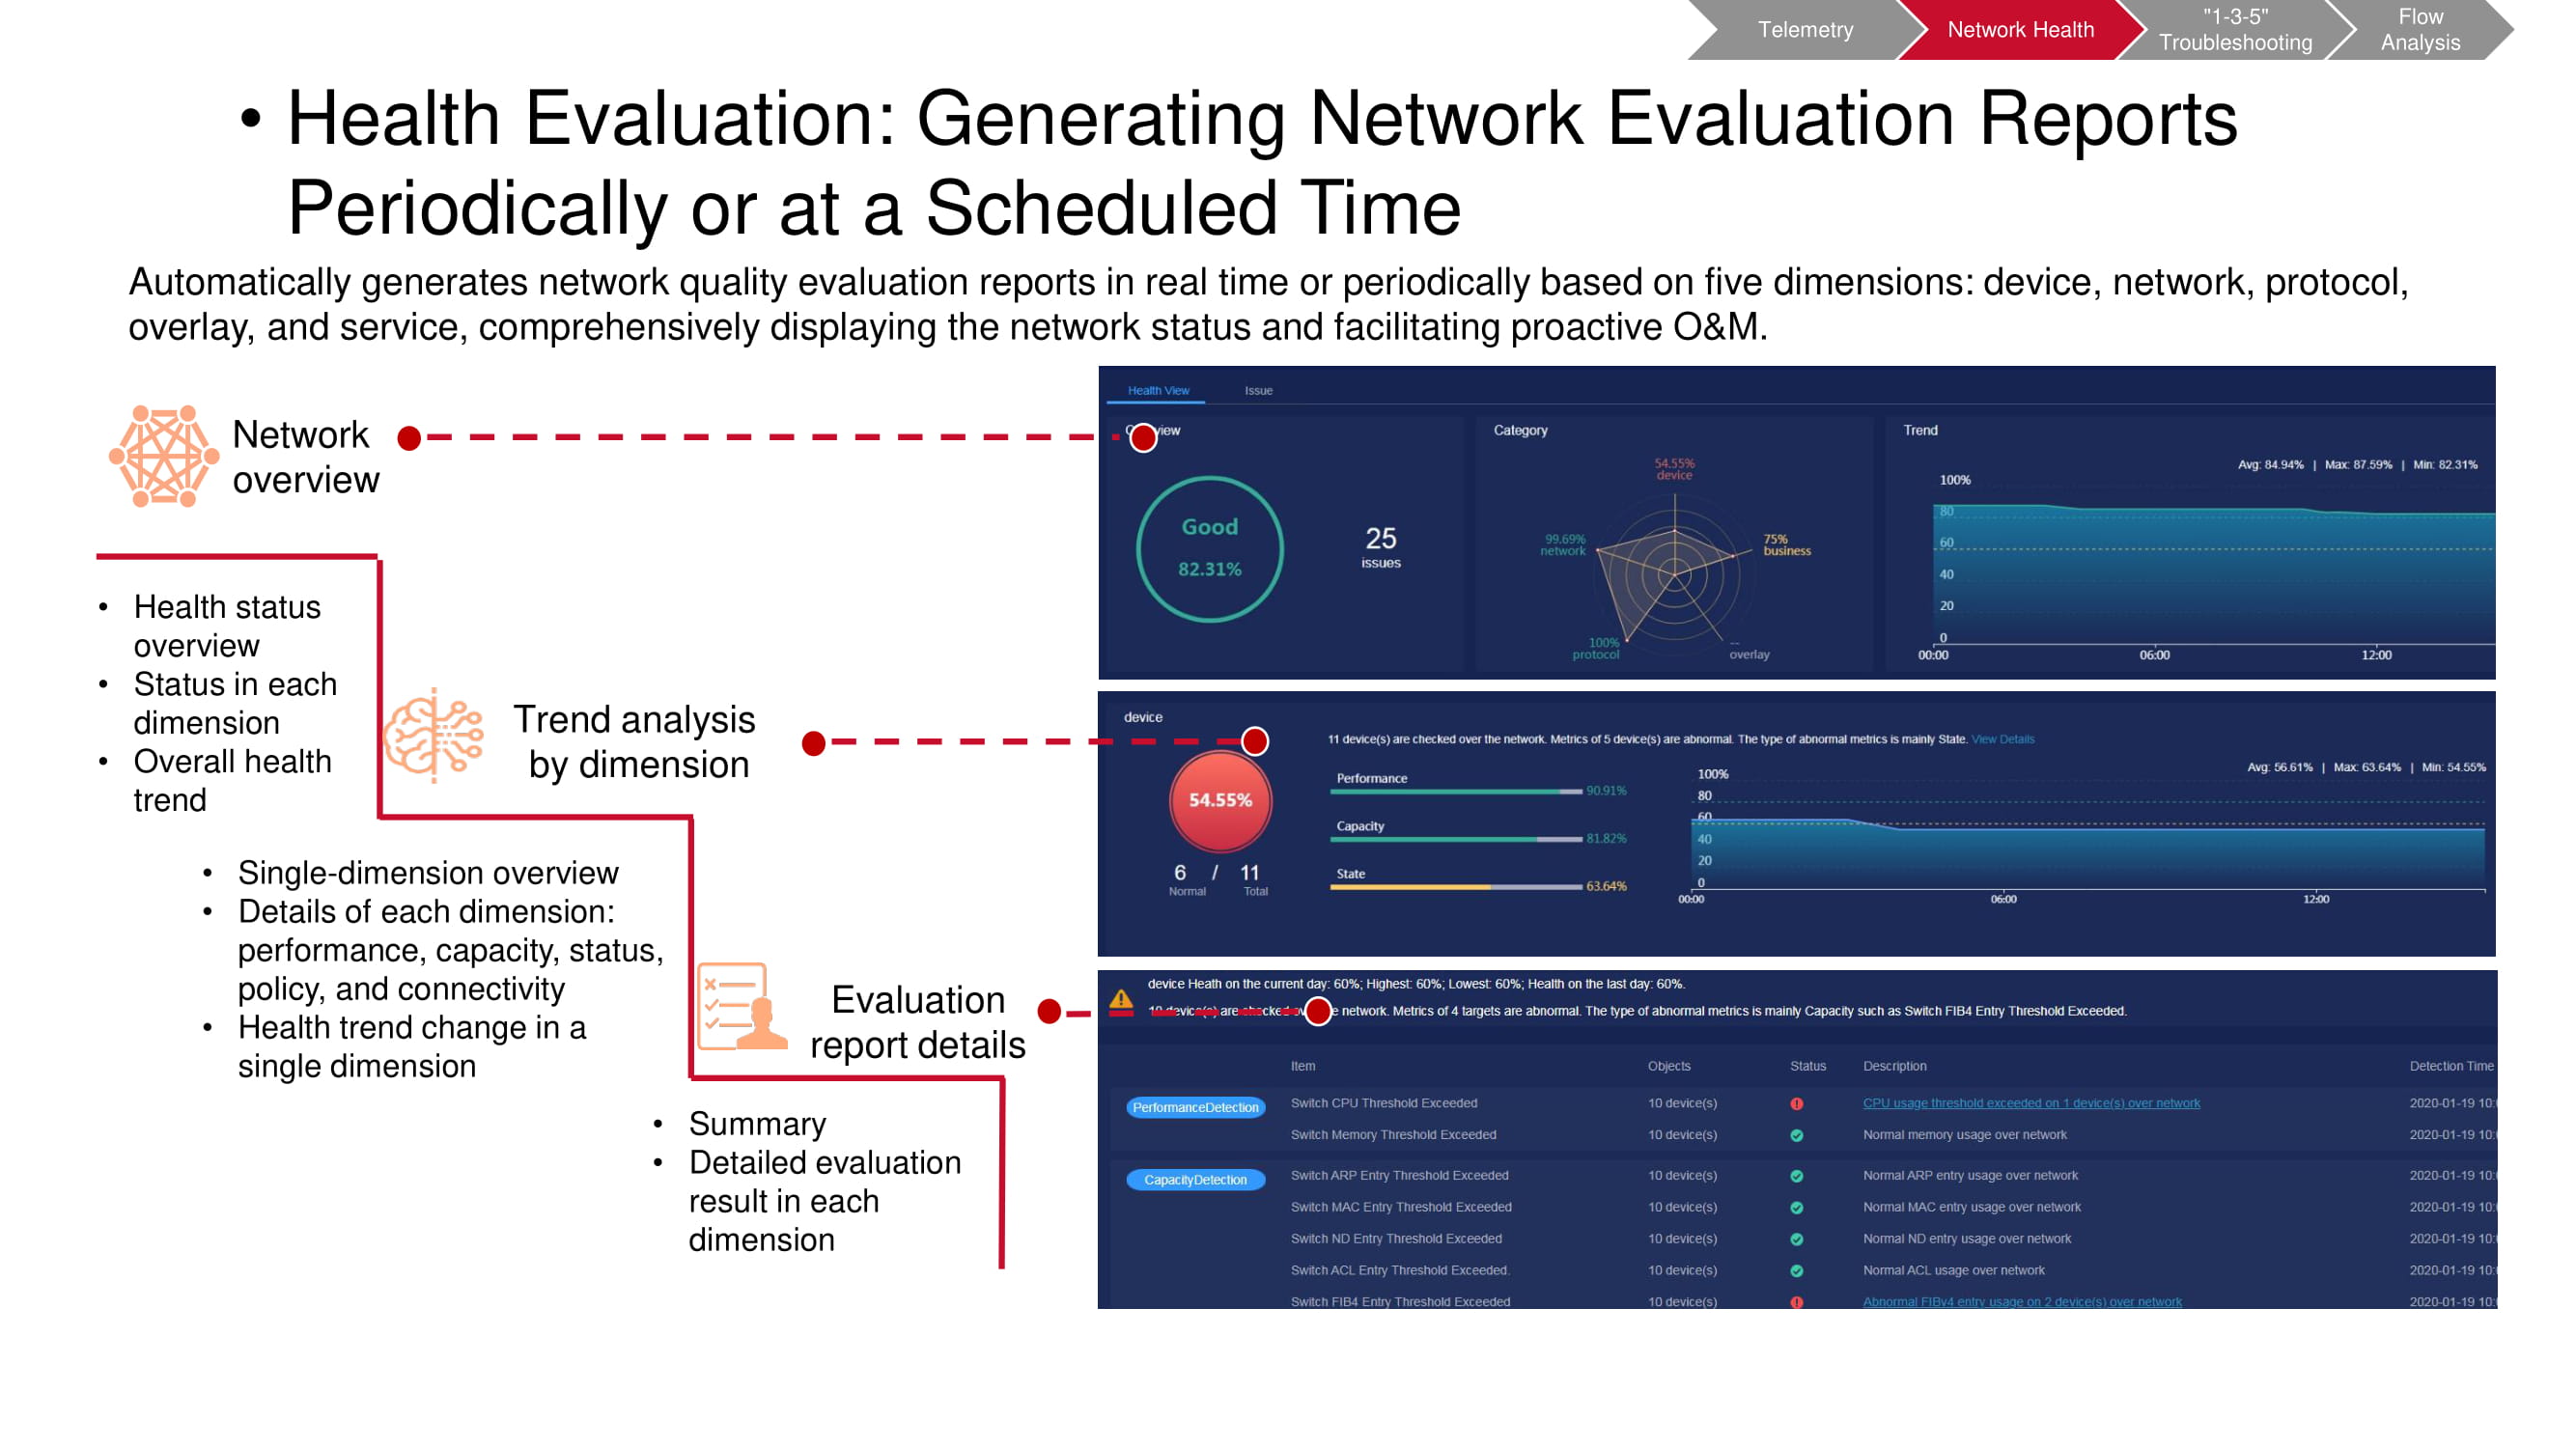
It is necessary to carry out such checks regularly, having predetermined the time intervals between them. This makes it easier to spot trends emerging in the network in time, including both periodic and non-periodic changes. This allows you to understand much more fully and quickly what exactly is happening. Moreover, any parameter of particular interest can be selected for more detailed monitoring.
Device problems
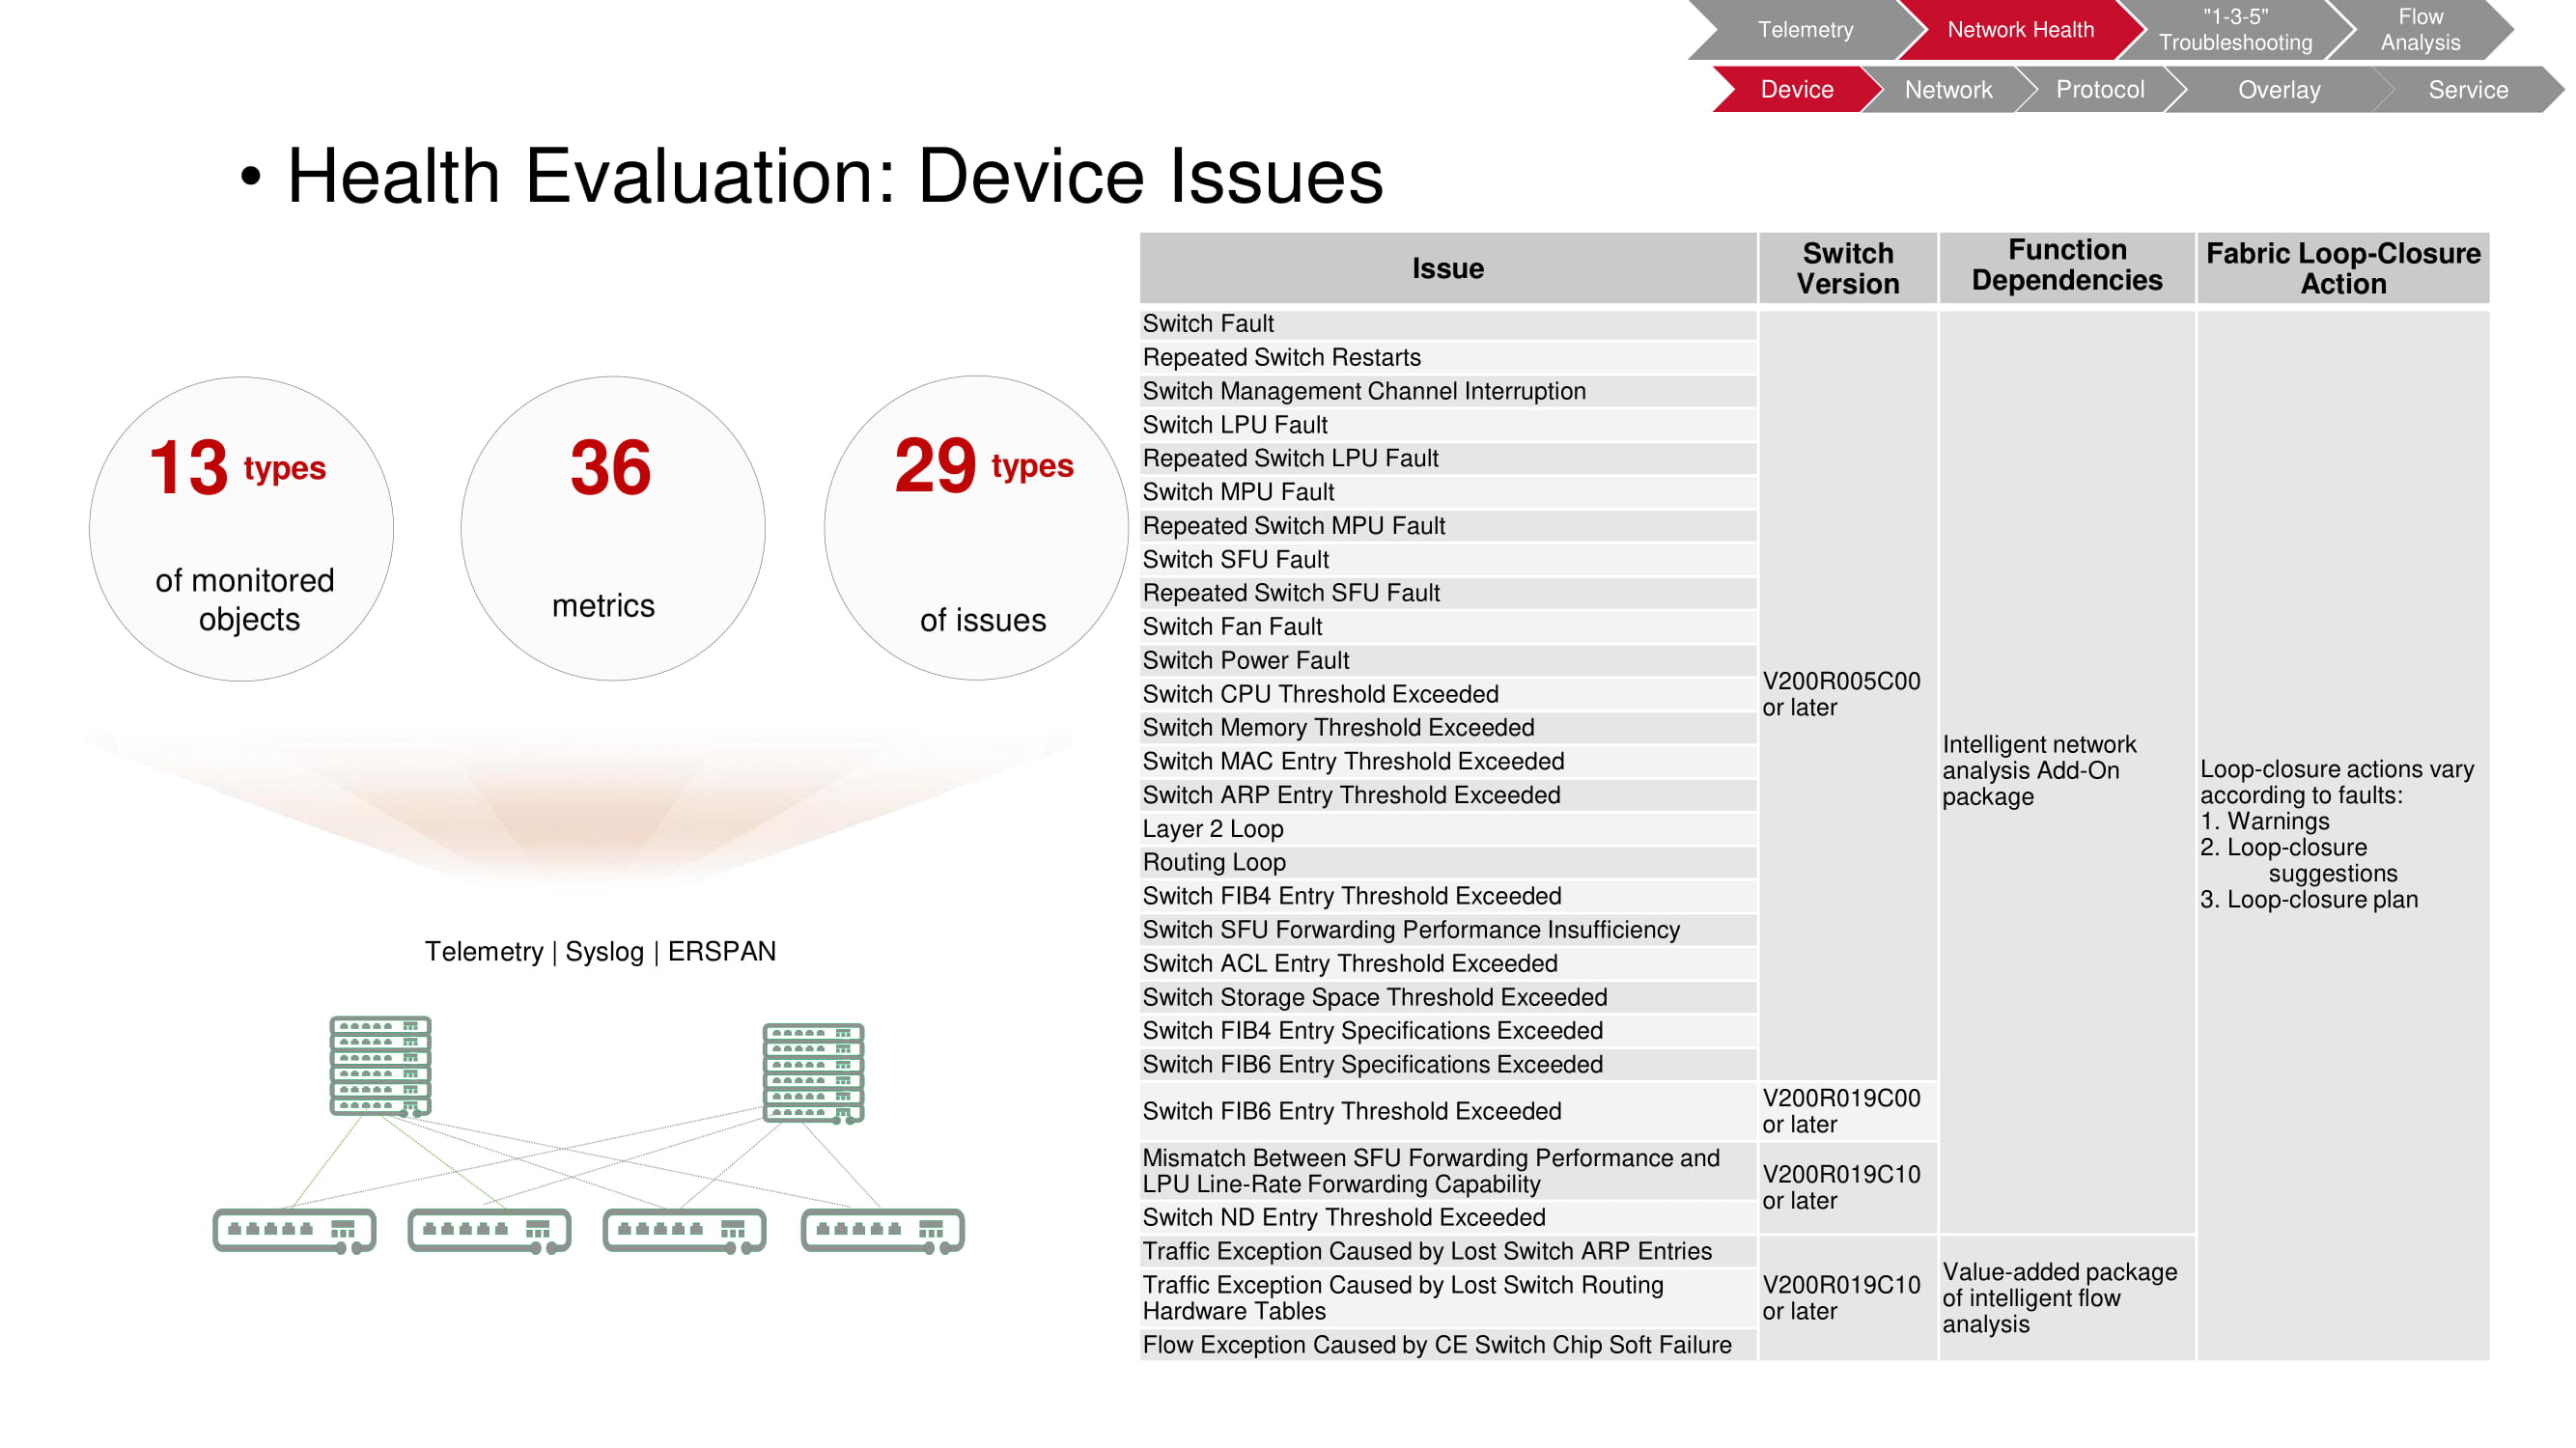
Monitoring allows you to identify a wide variety of problems that arise at the device level. In this case, the object of verification is a switch, 36 registered parameters of which make it possible to detect 29 types of faults.
The table on the diagram lists the types of faults; switch models that enable FabricInsight to detect the problem; functions used by FabricInsight; automatic actions taken when problems are detected (warnings, recommendations, script launch).
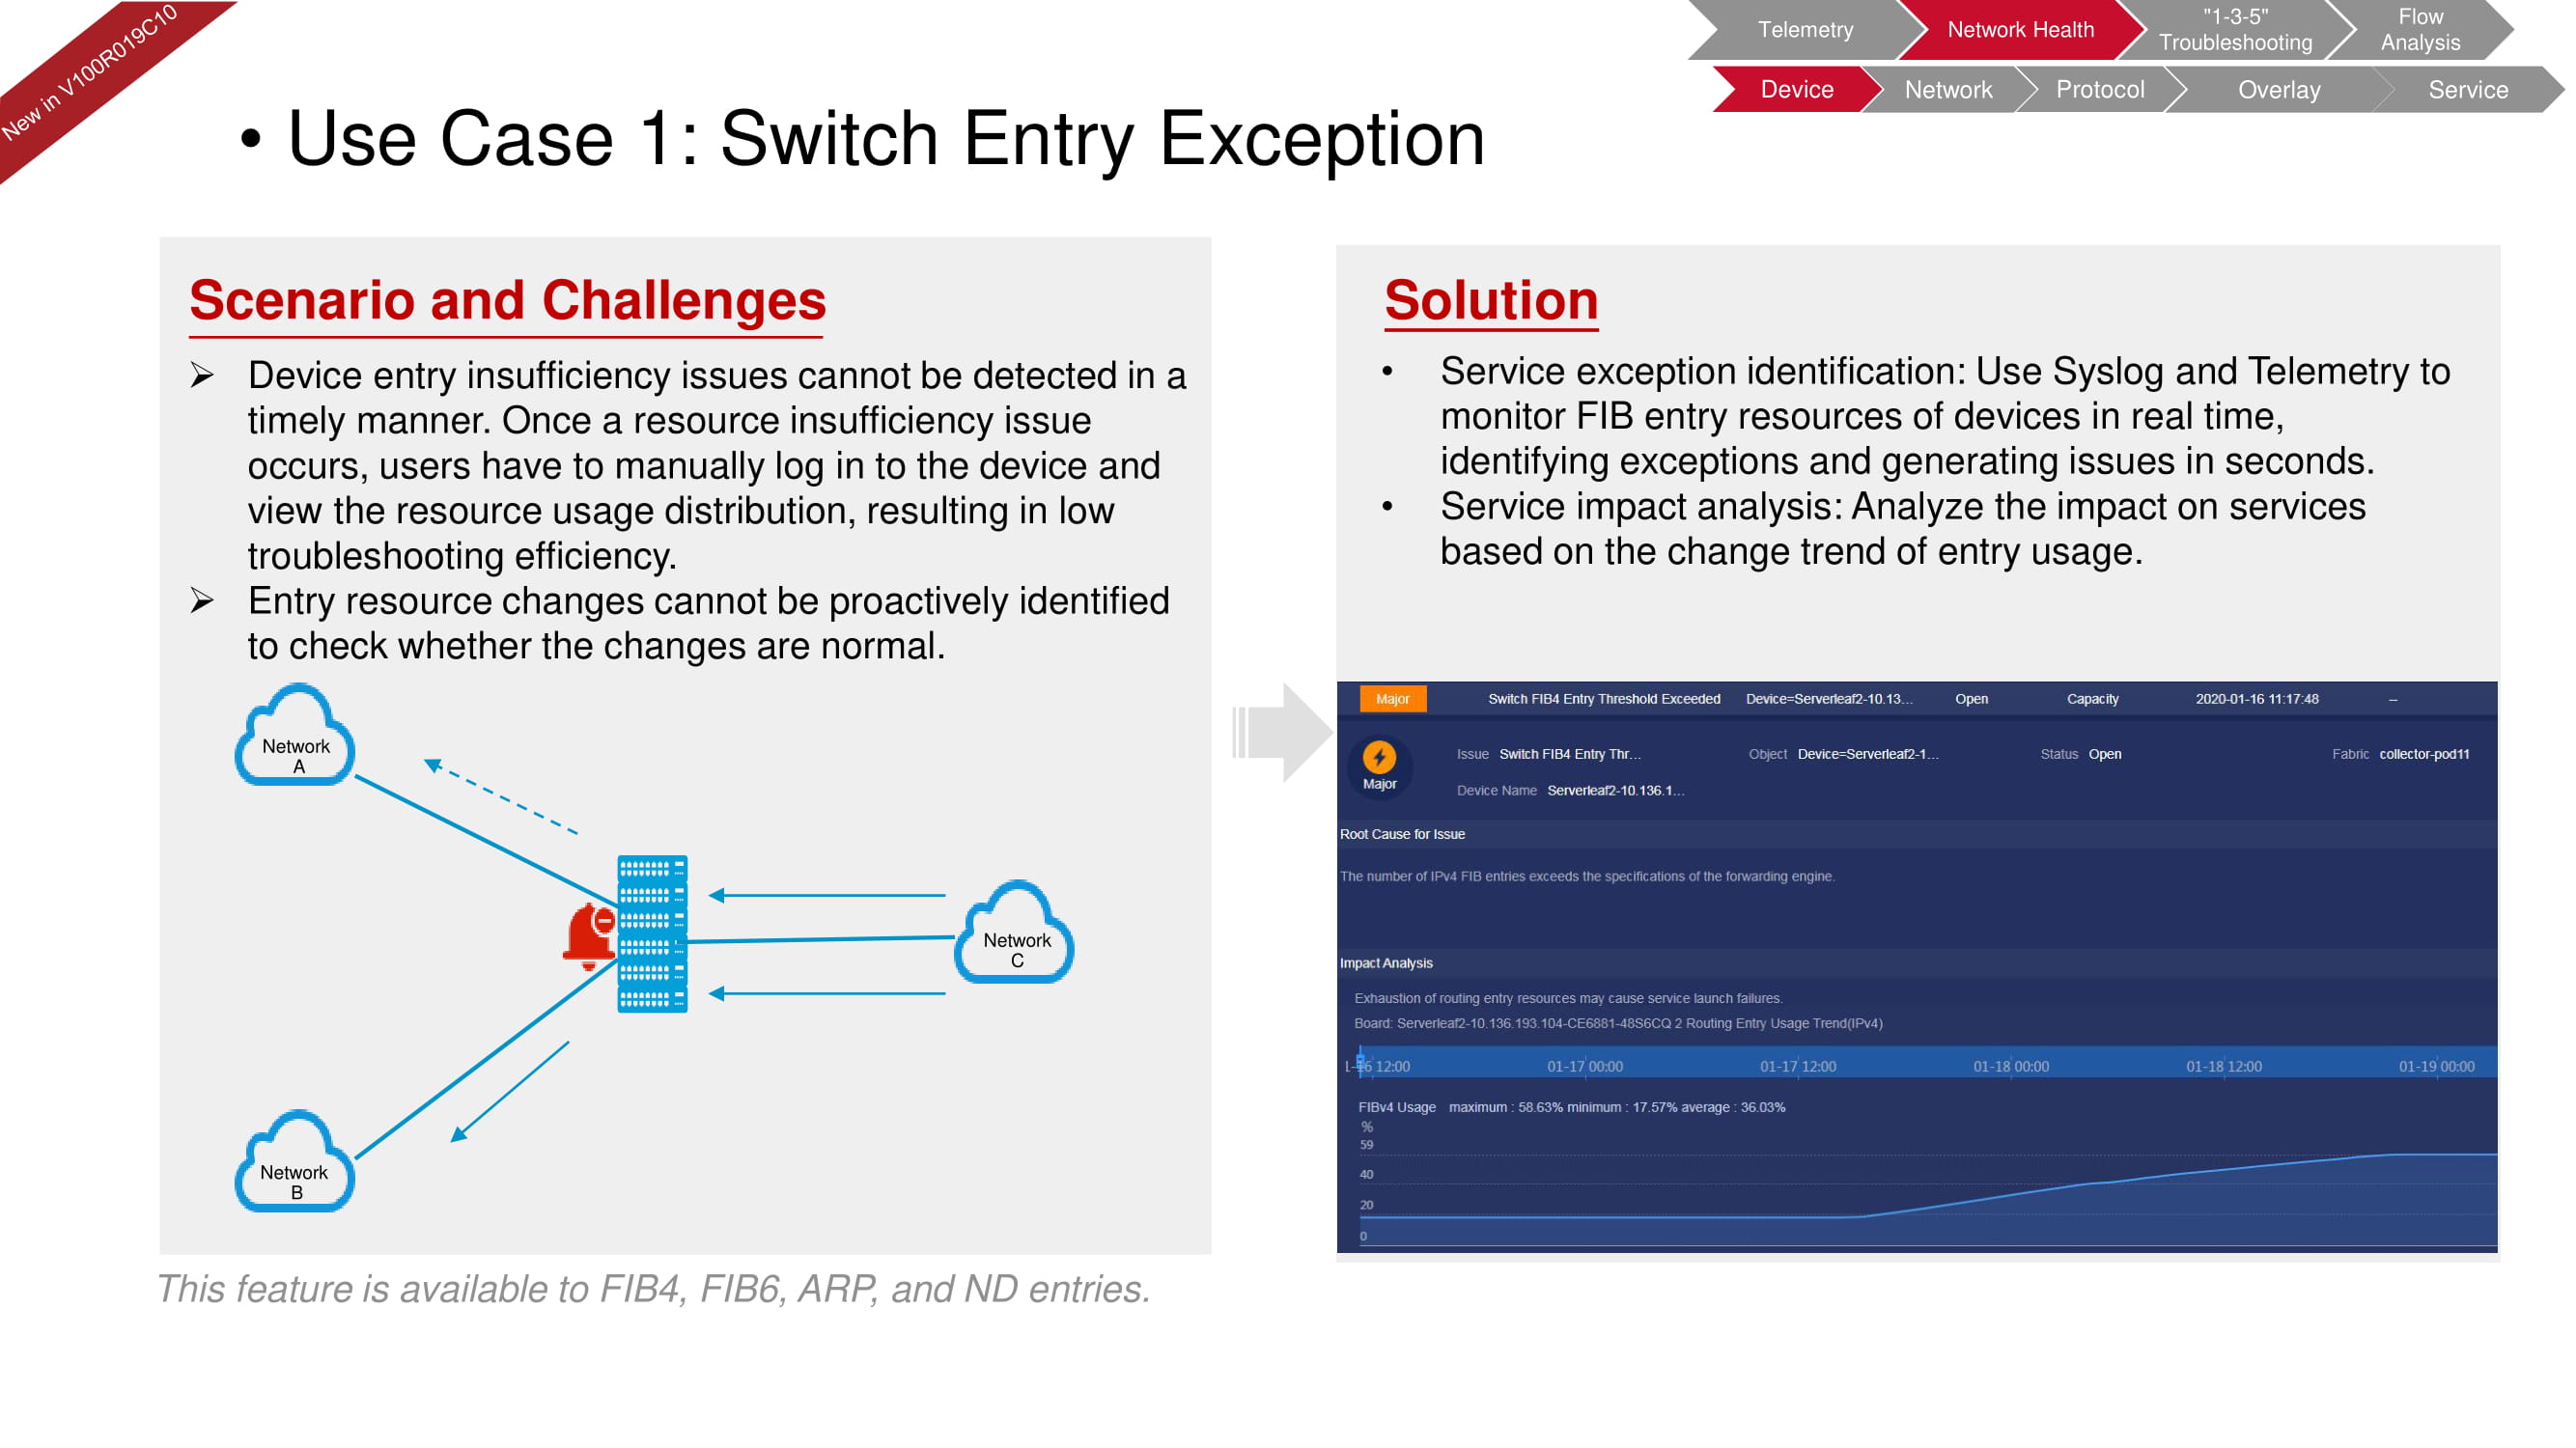
Let's say the device has a shortage of resources leading to a drop in the service level. The data from the system log, combined with the telemetry data of the FIB resources, allow you to quickly assess the situation in the manual check mode.
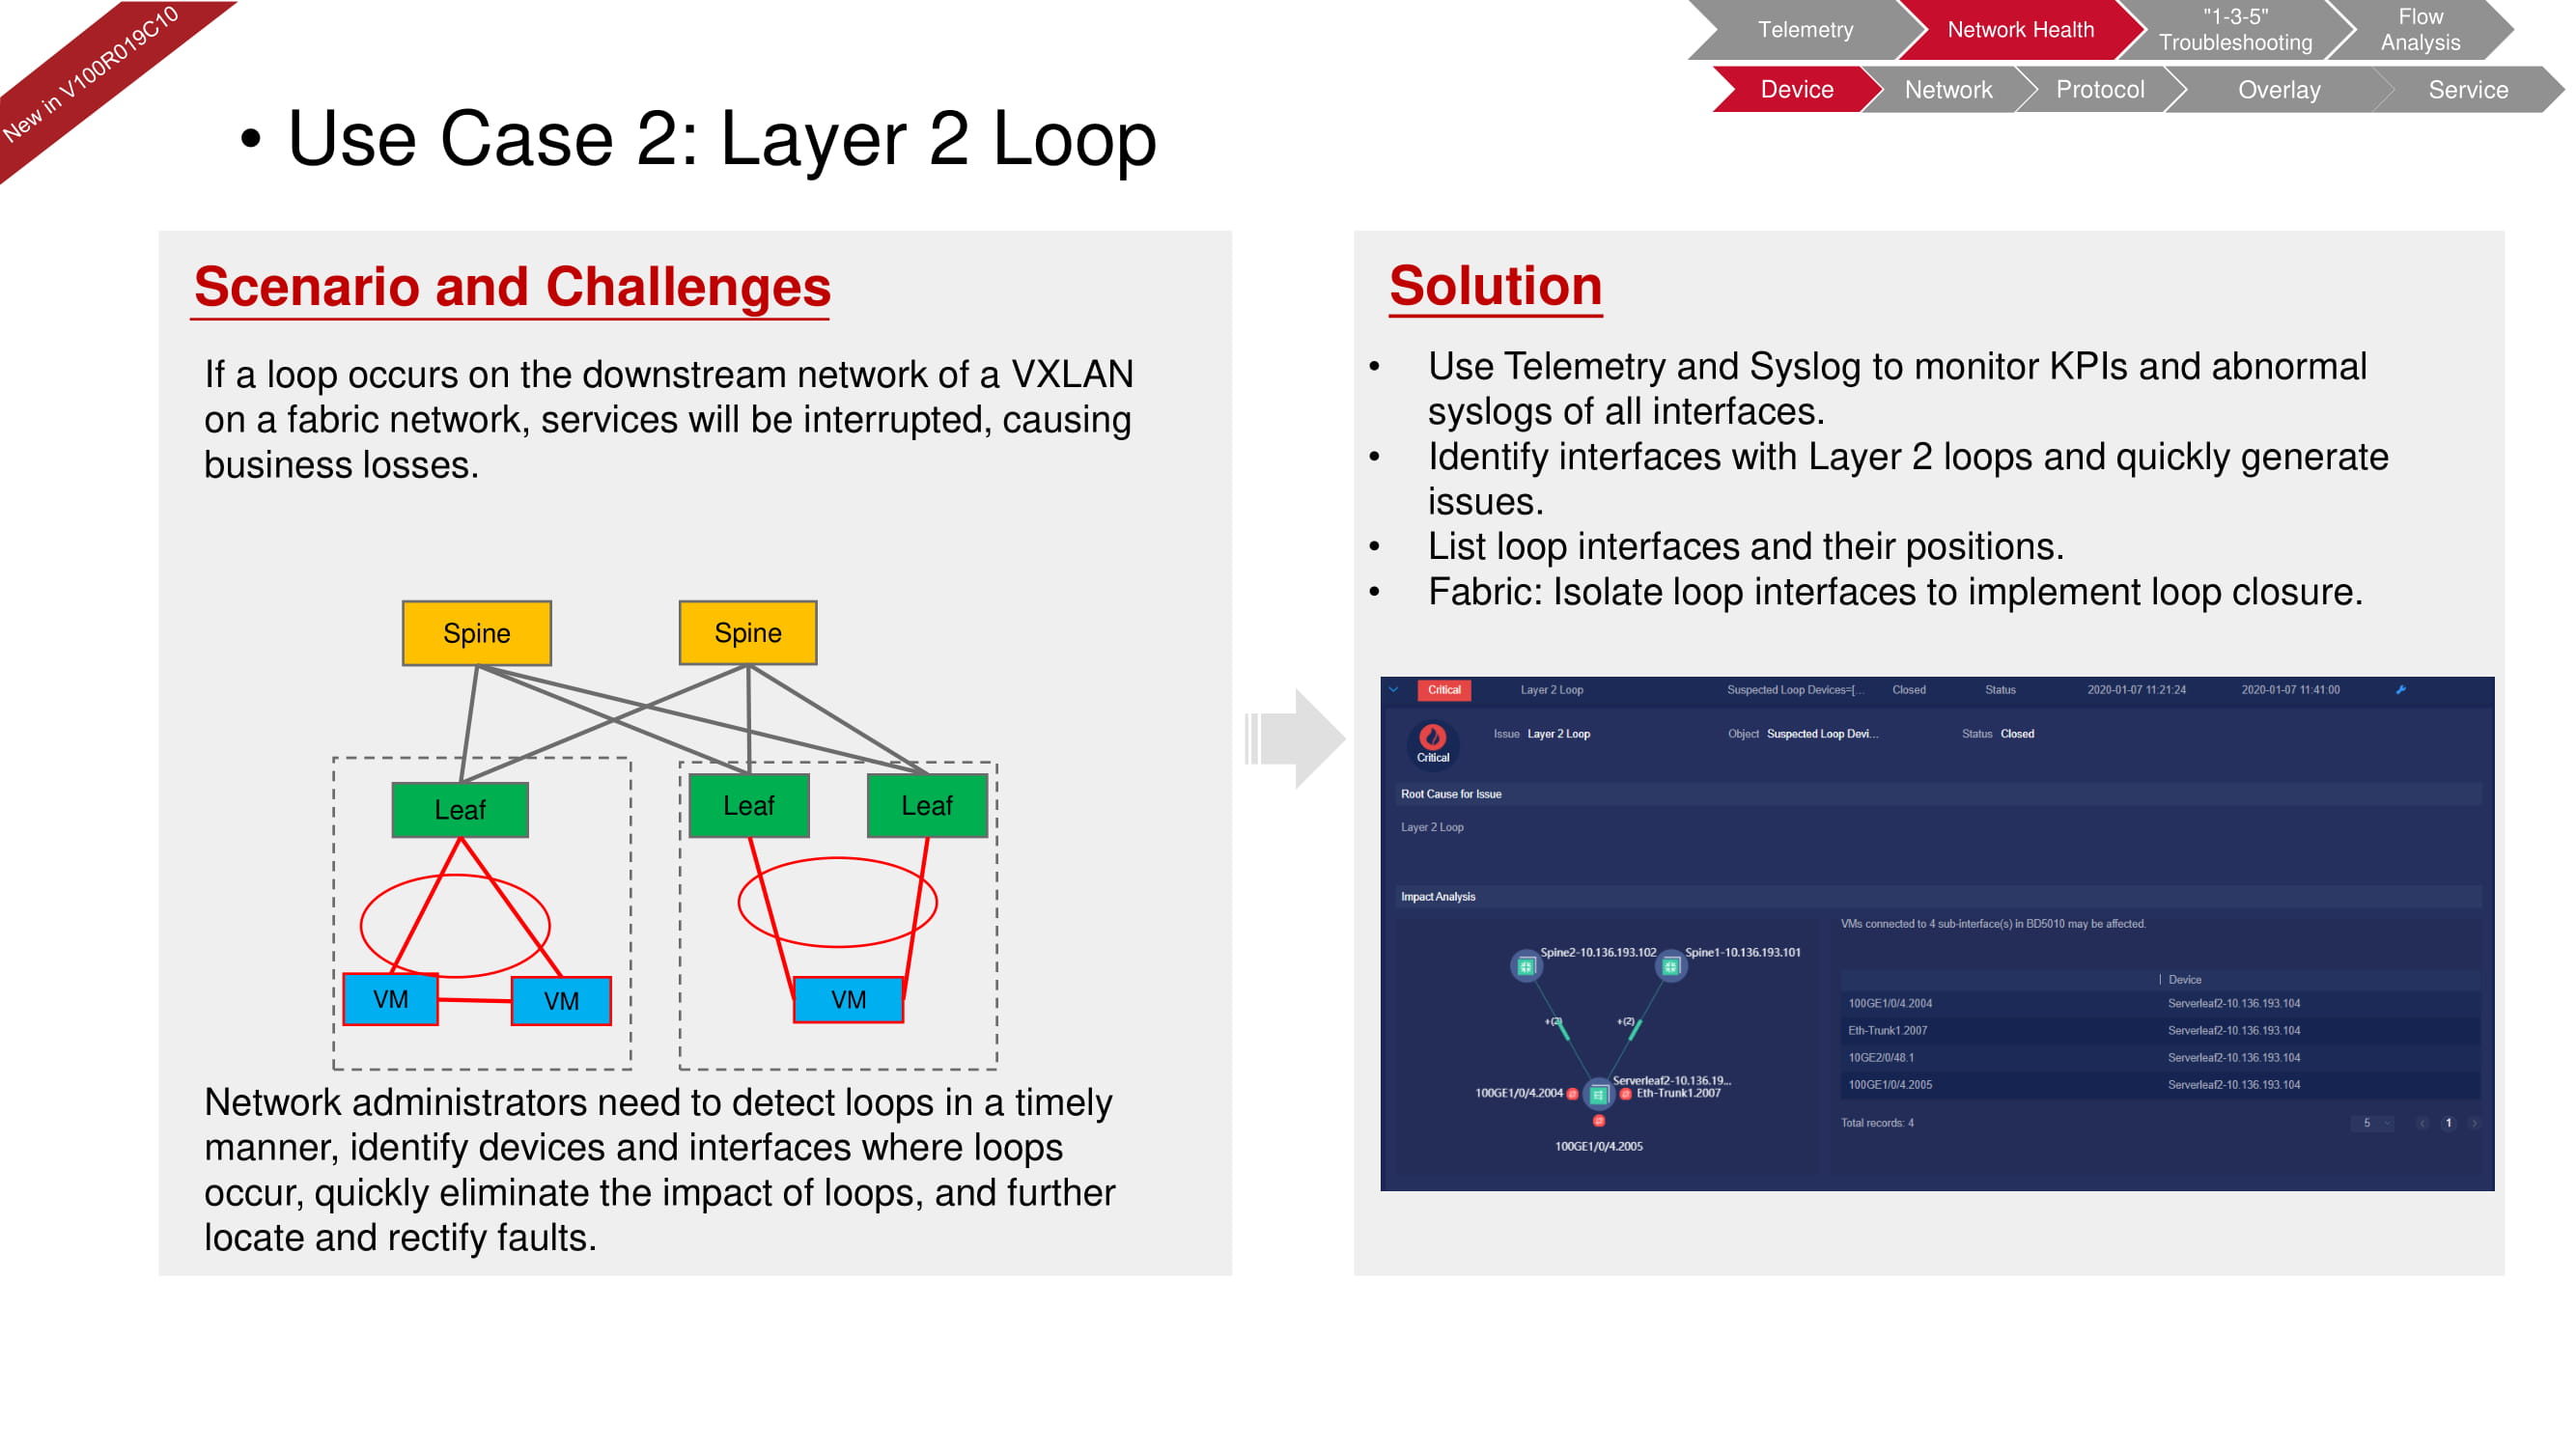
It is simply not possible for a loop to occur at the hardware level, since the device will not allow such an error to be introduced into the configuration. However, a loop can arise, for example, at the second level (at the virtual machine level) due to an incorrectly configured software switch, as in the diagram above. With FabricInsight, you can not only detect a problem, but also isolate the desired section of the network to eliminate its impact on the functioning of the entire "fabric".
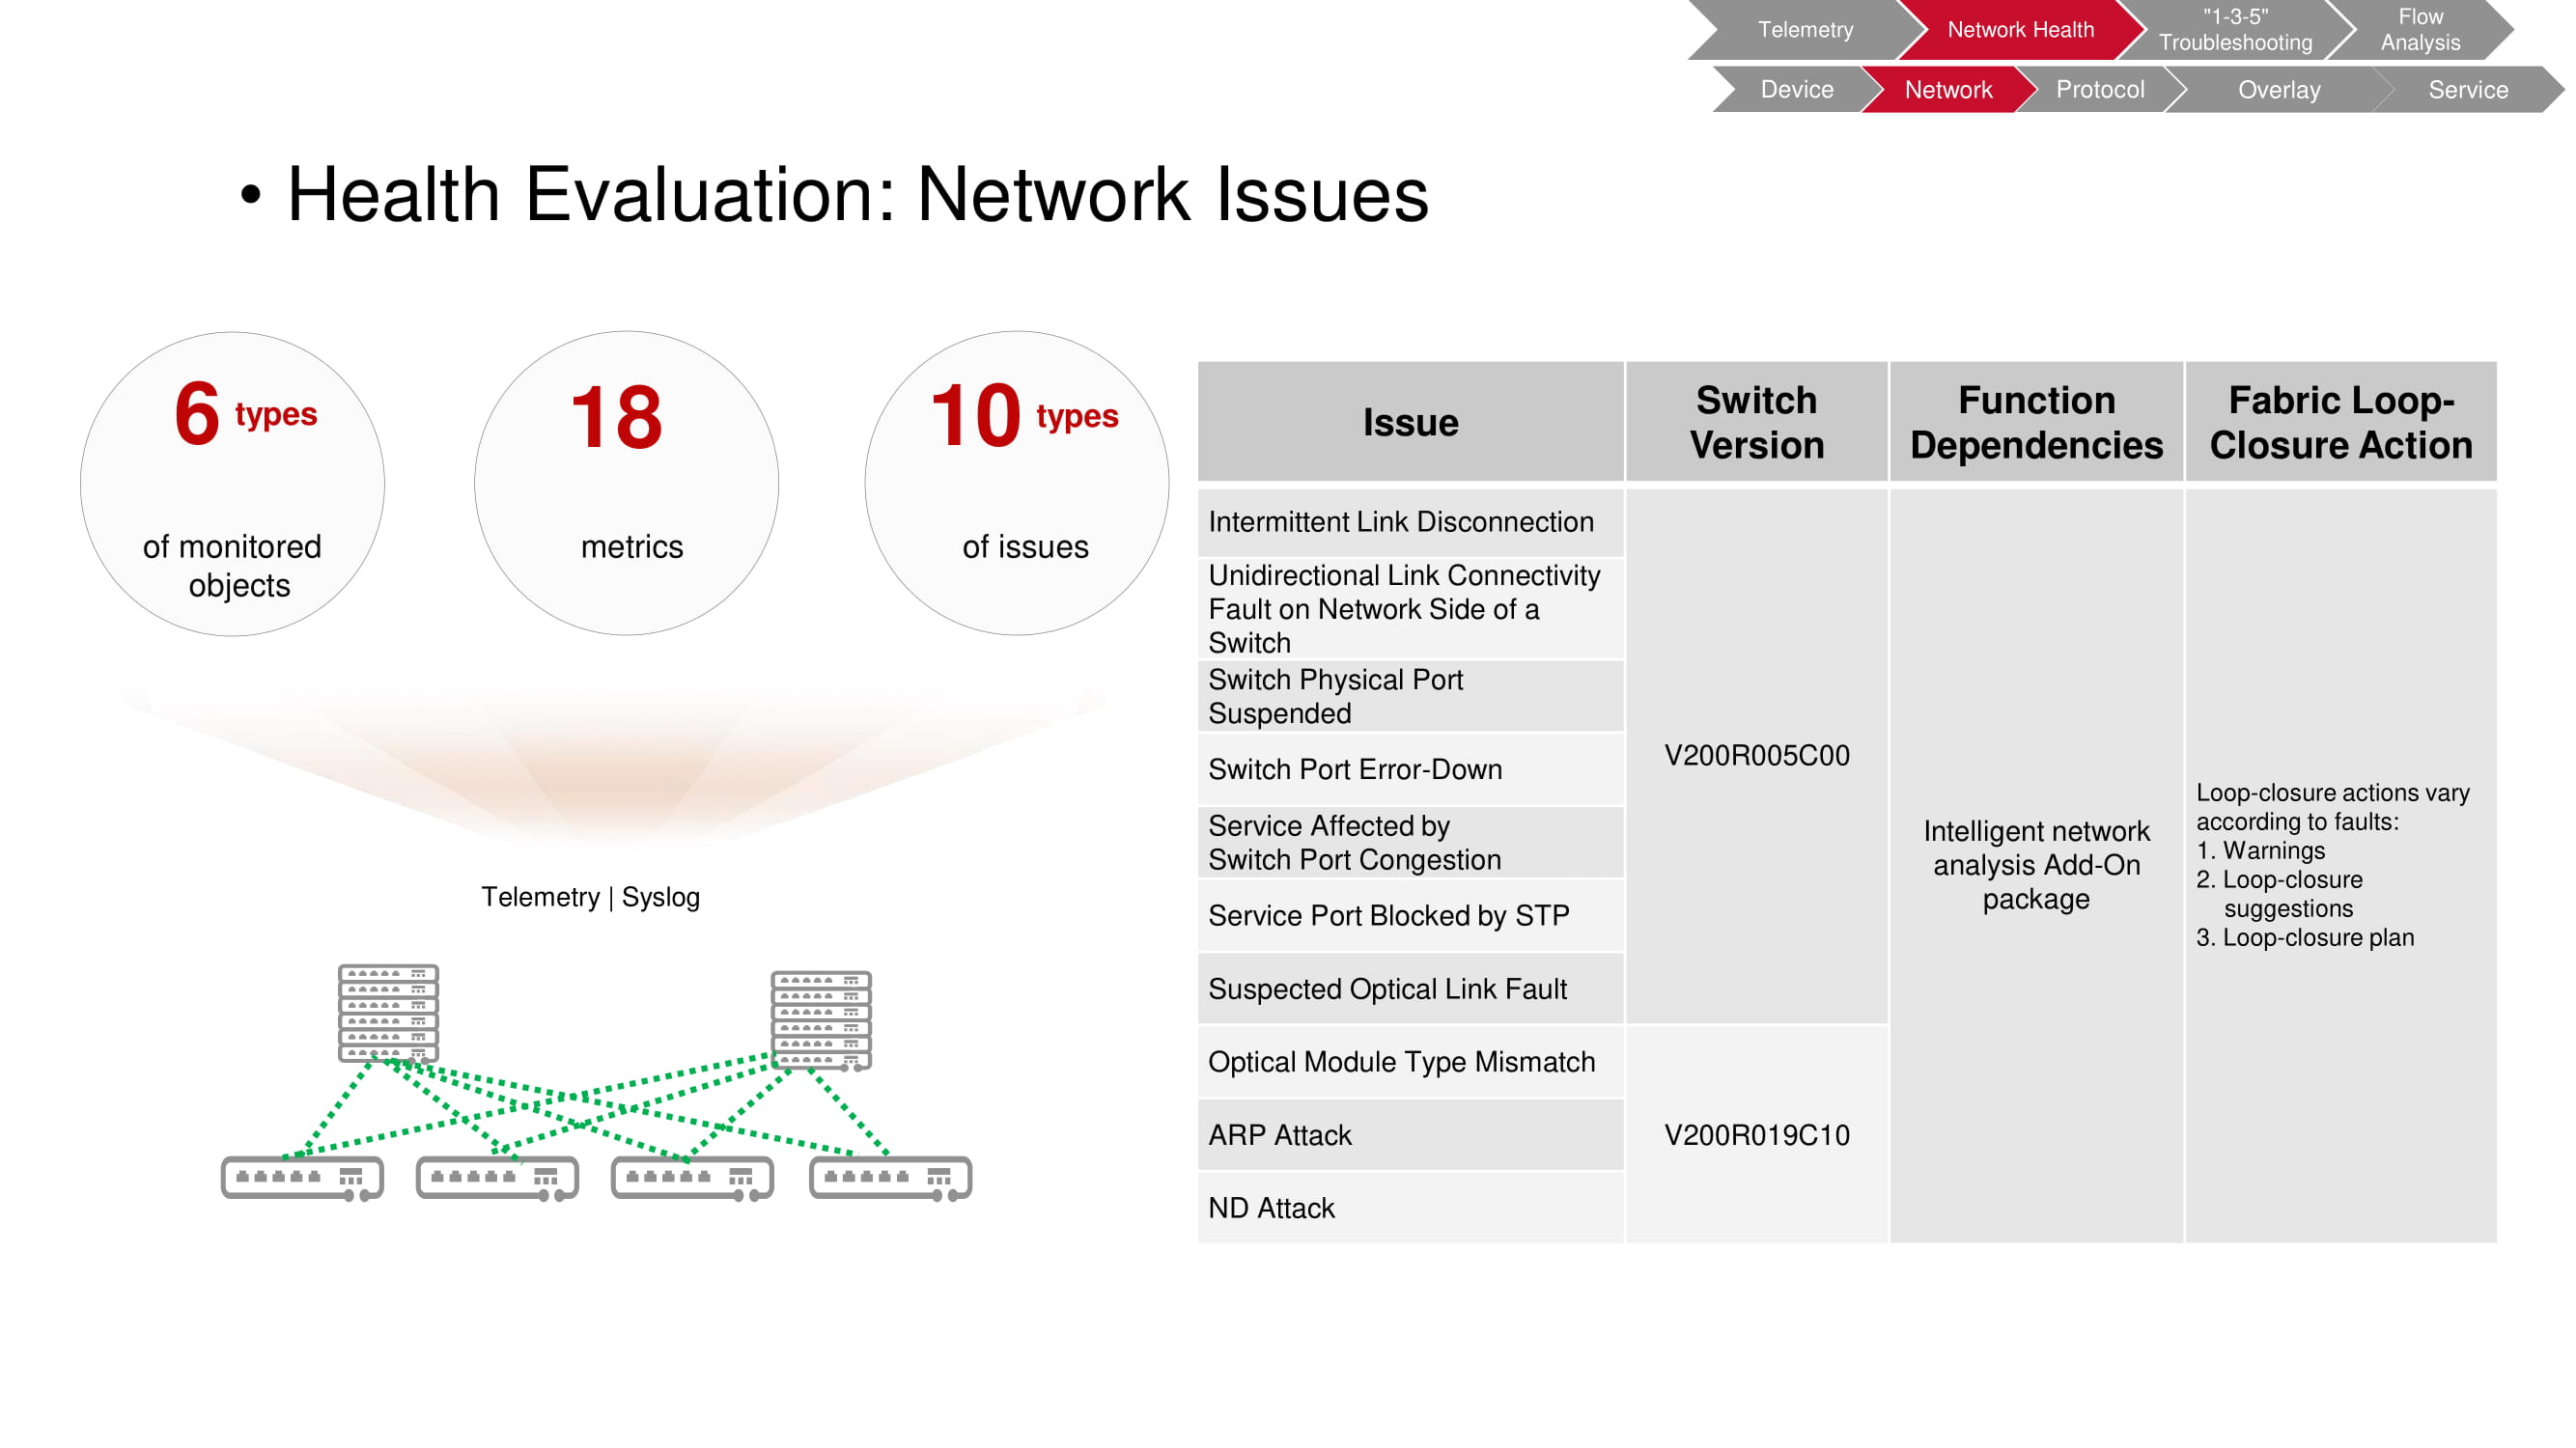
Network problems
Based on 18 metrics available for analysis, FabricInsight identifies 10 types of network problems. The diagram provides a complete listing of them, as well as - as in the case of device problems - the switch models that allow FabricInsight to detect the problem, the functions used and the automatic actions available.
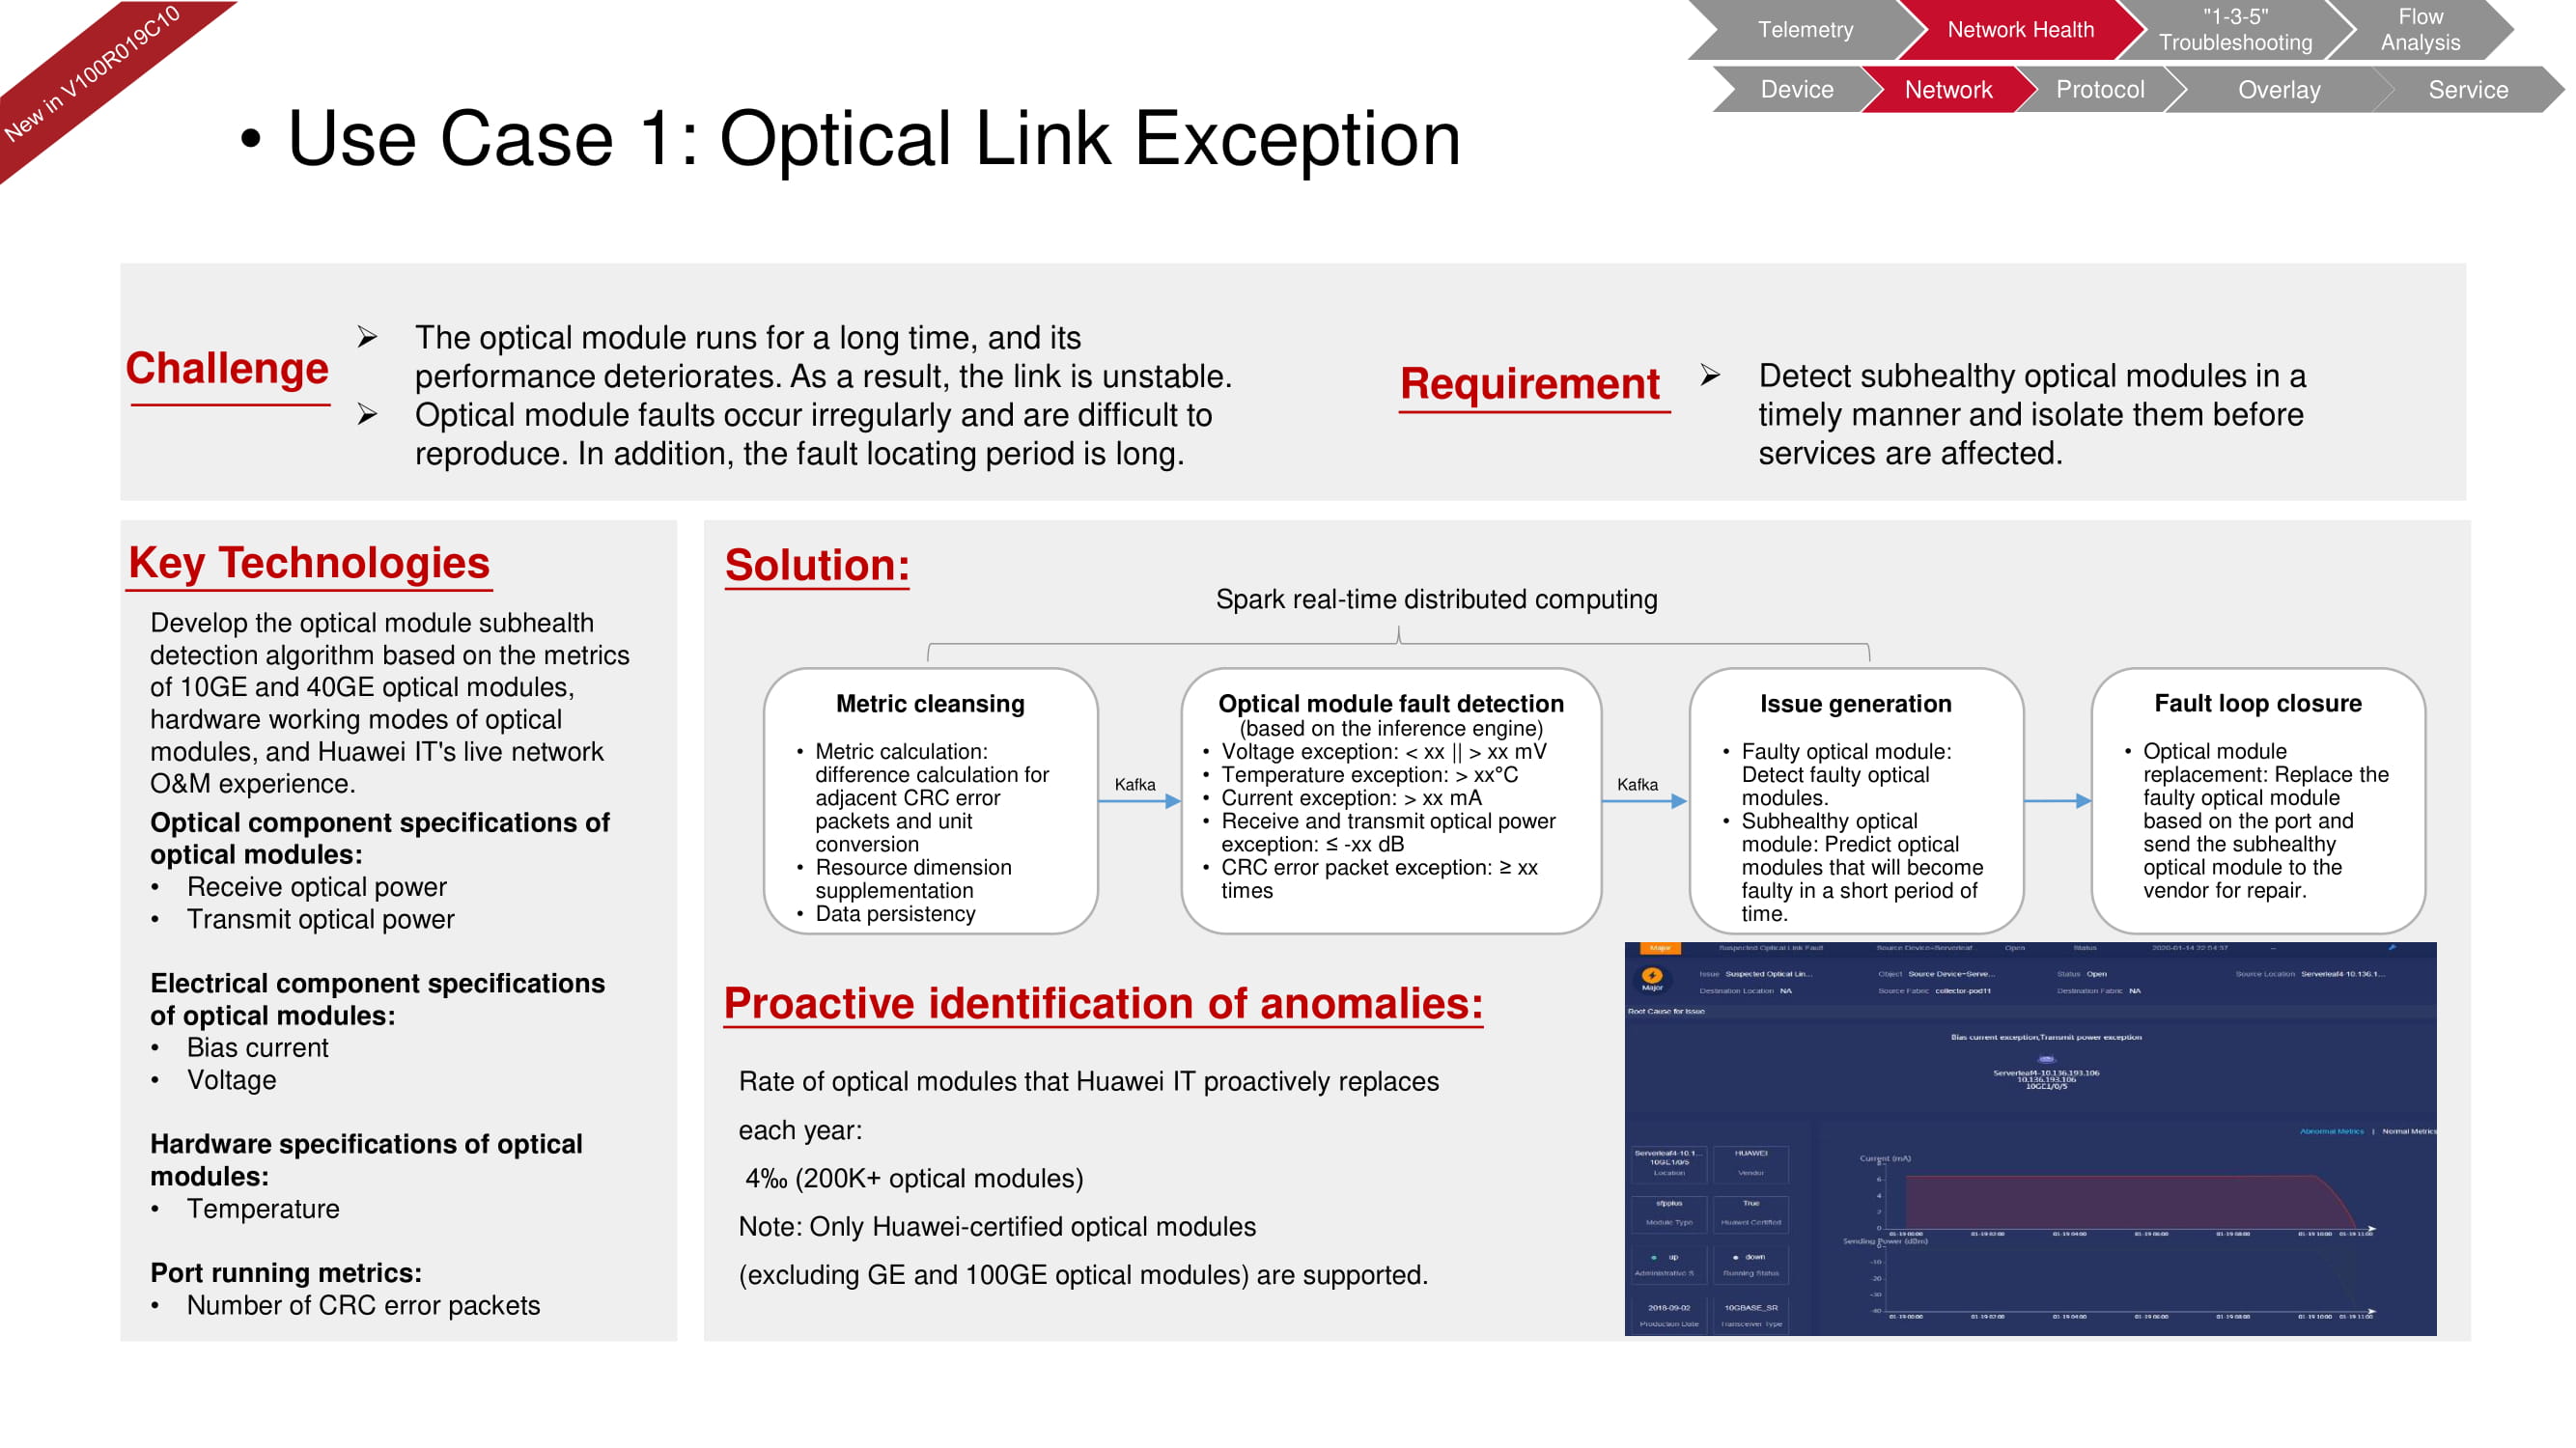
Suppose degradation or malfunction of the optical module leads to a deterioration in its performance: the link becomes unstable. These situations occur irregularly and are difficult to reproduce. This can take a long time to find the problem. With FabricInsight, you can immediately notice a drop in signal level or a change in voltage across a module.
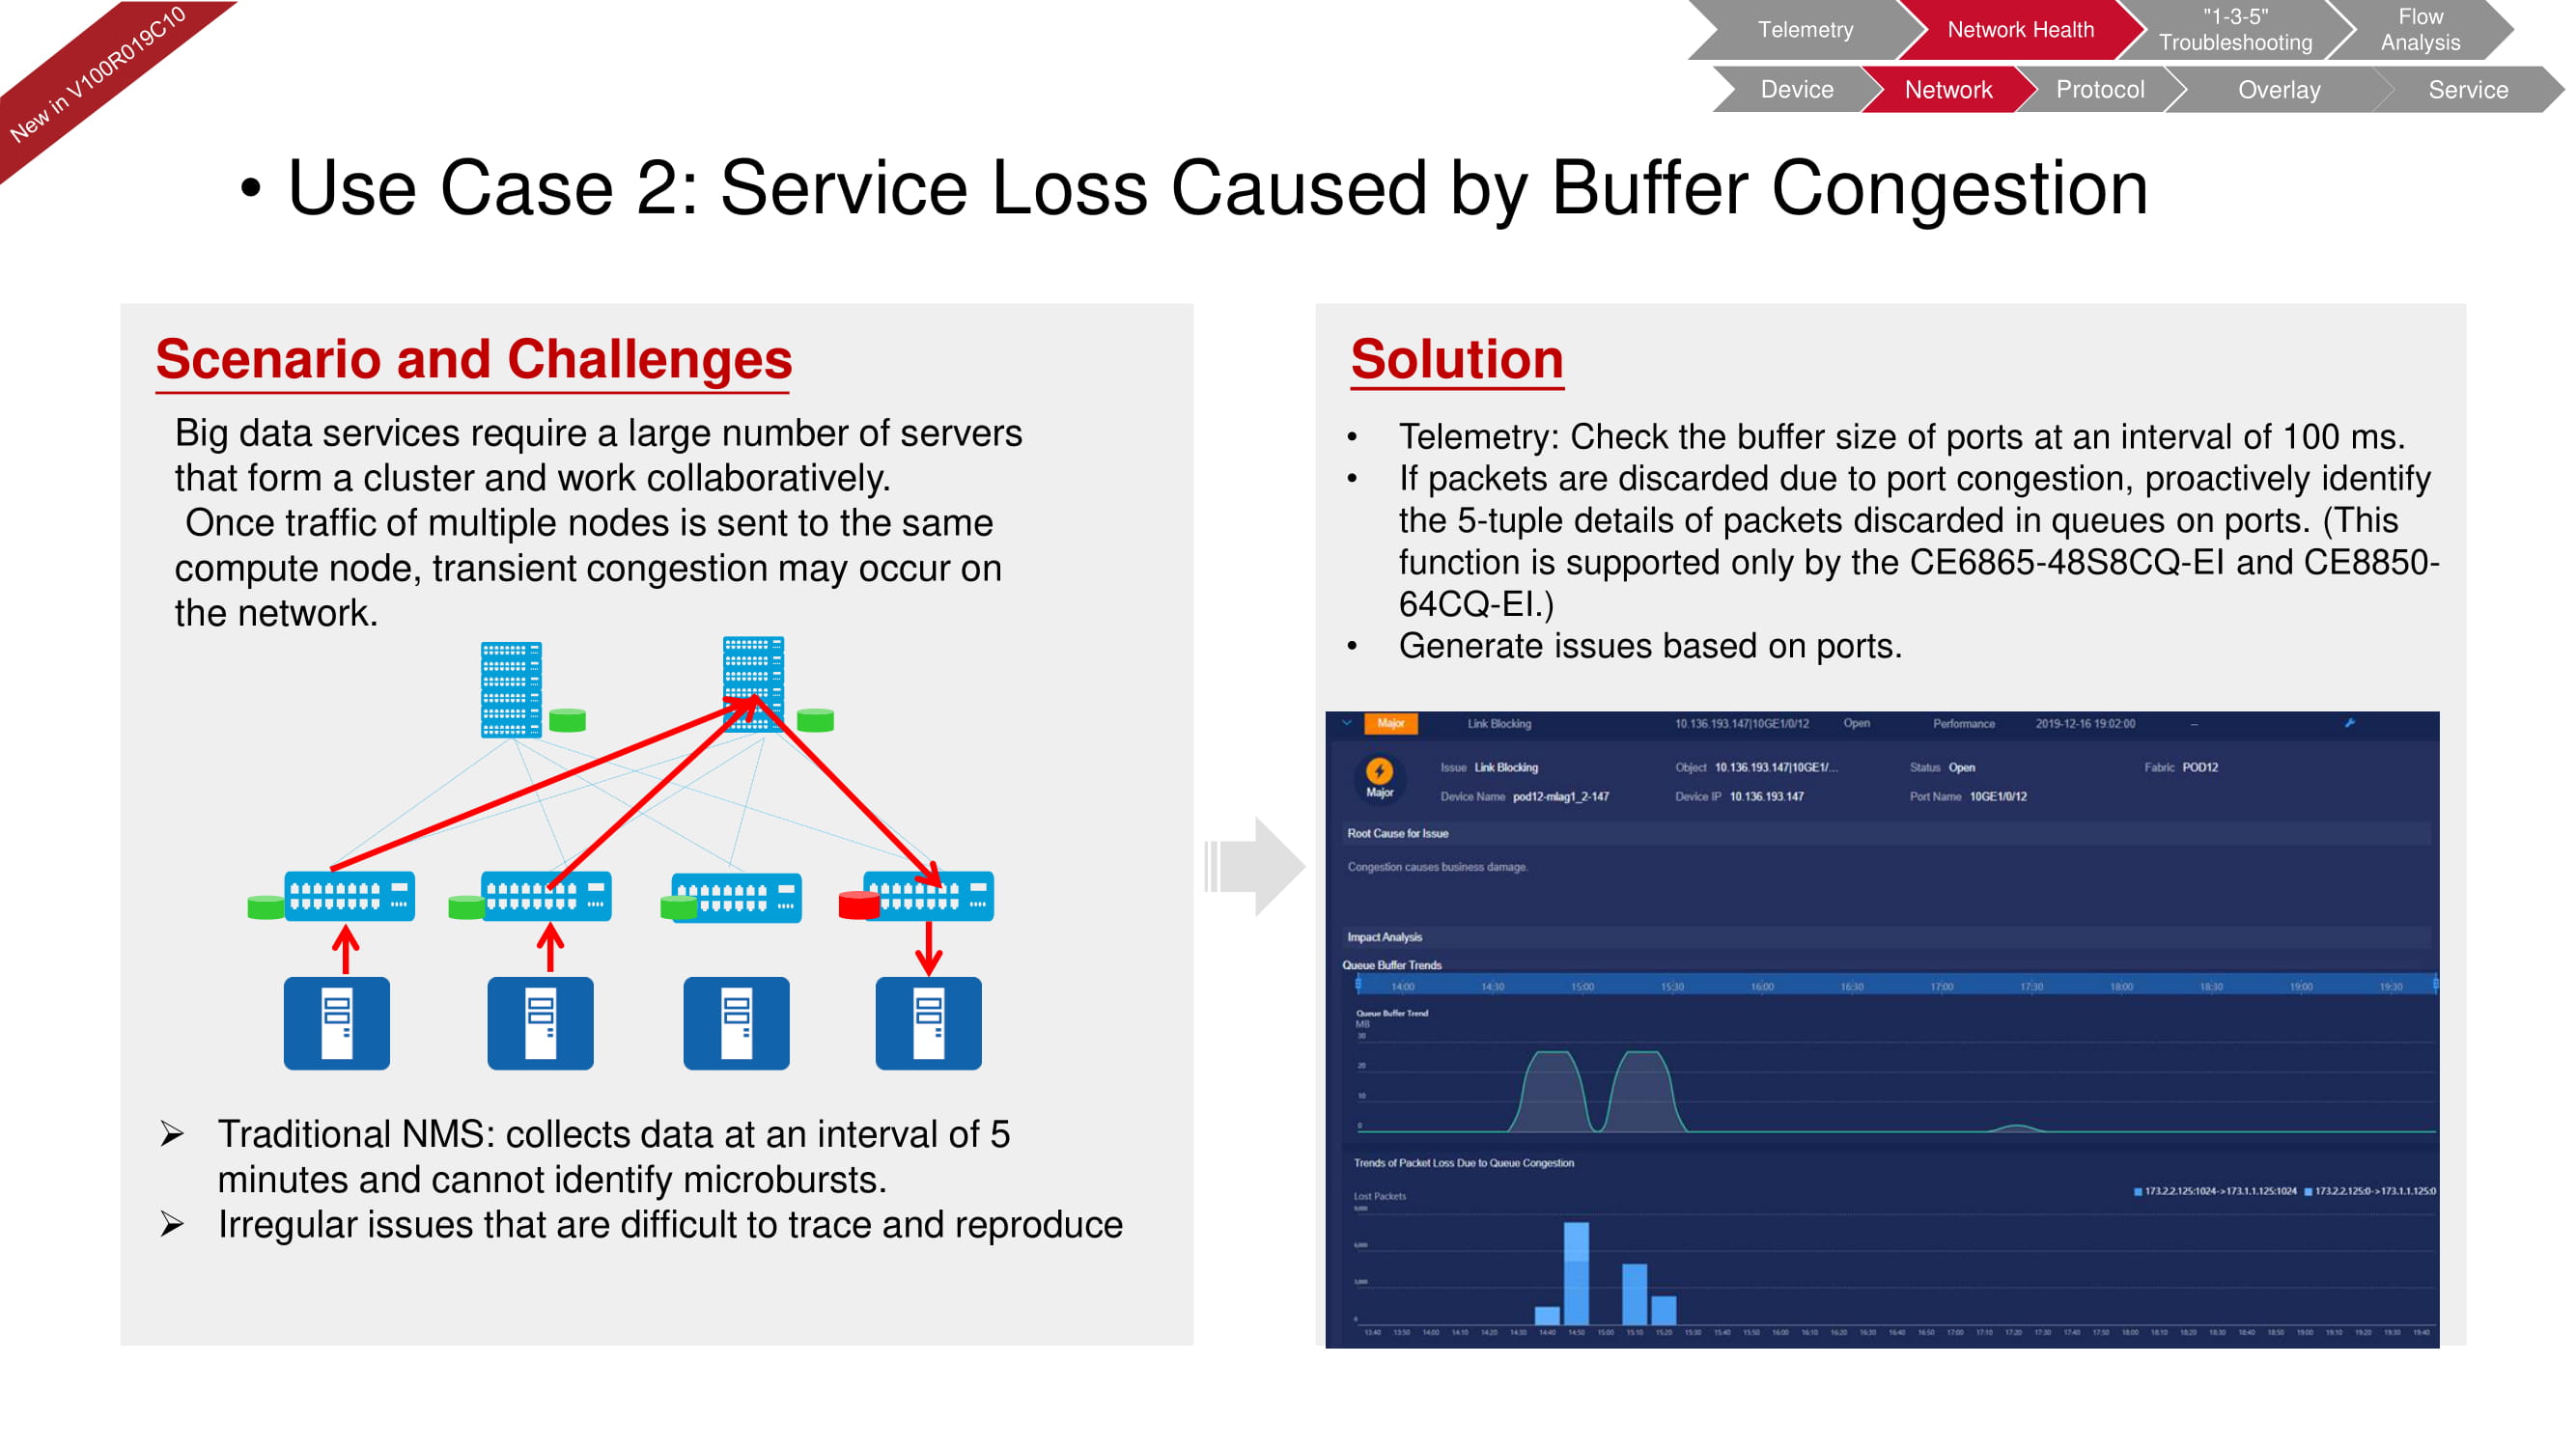
The fabricInsight network diagnostics can also promptly identify buffer problems that often occur in systems with a large number of servers that are dedicated to big data processing. The traditional NMS (Network Management System) checks the buffer-related parameters every five minutes. FabricInsight telemetry capabilities can reduce these intervals down to 100ms and detect even the shortest micro-incidents.
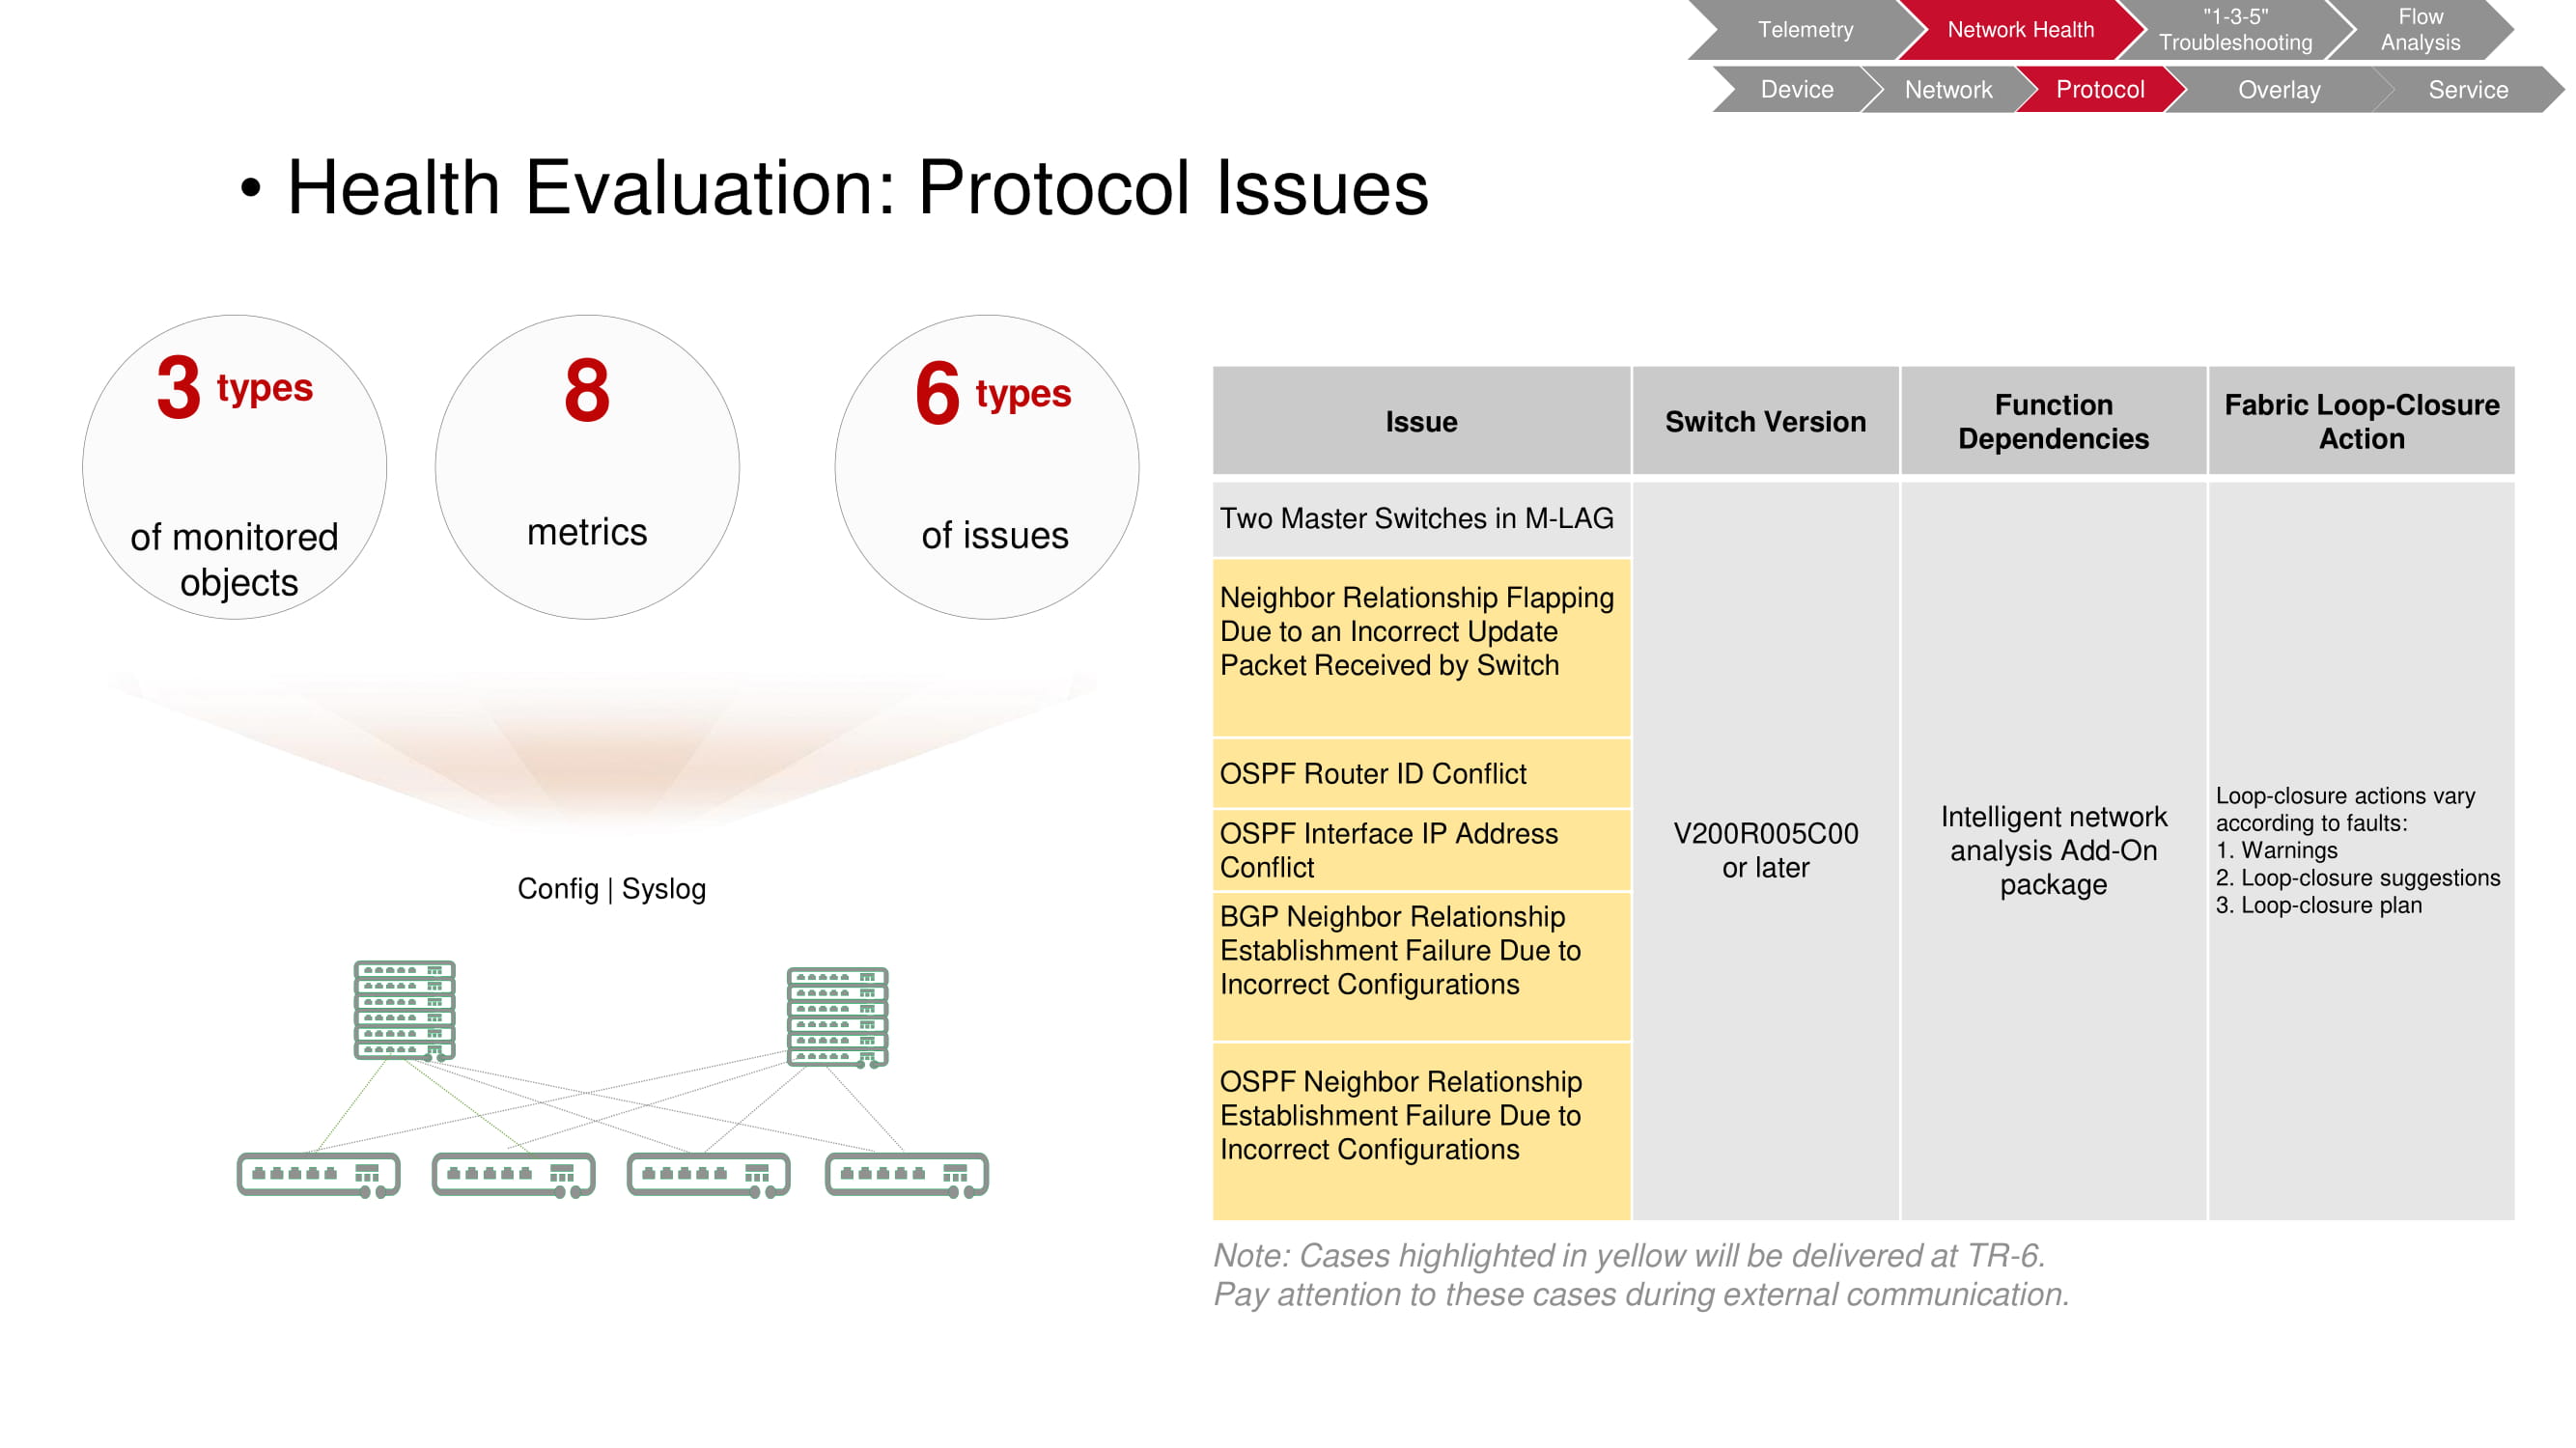
Problems at the protocol level
Here FabricInsight can identify six types of problems, including a conflict between two master switches in the M-LAG; problems with the interaction of neighboring switches, etc. This functionality is available when using switches V200R005C00 and newer.
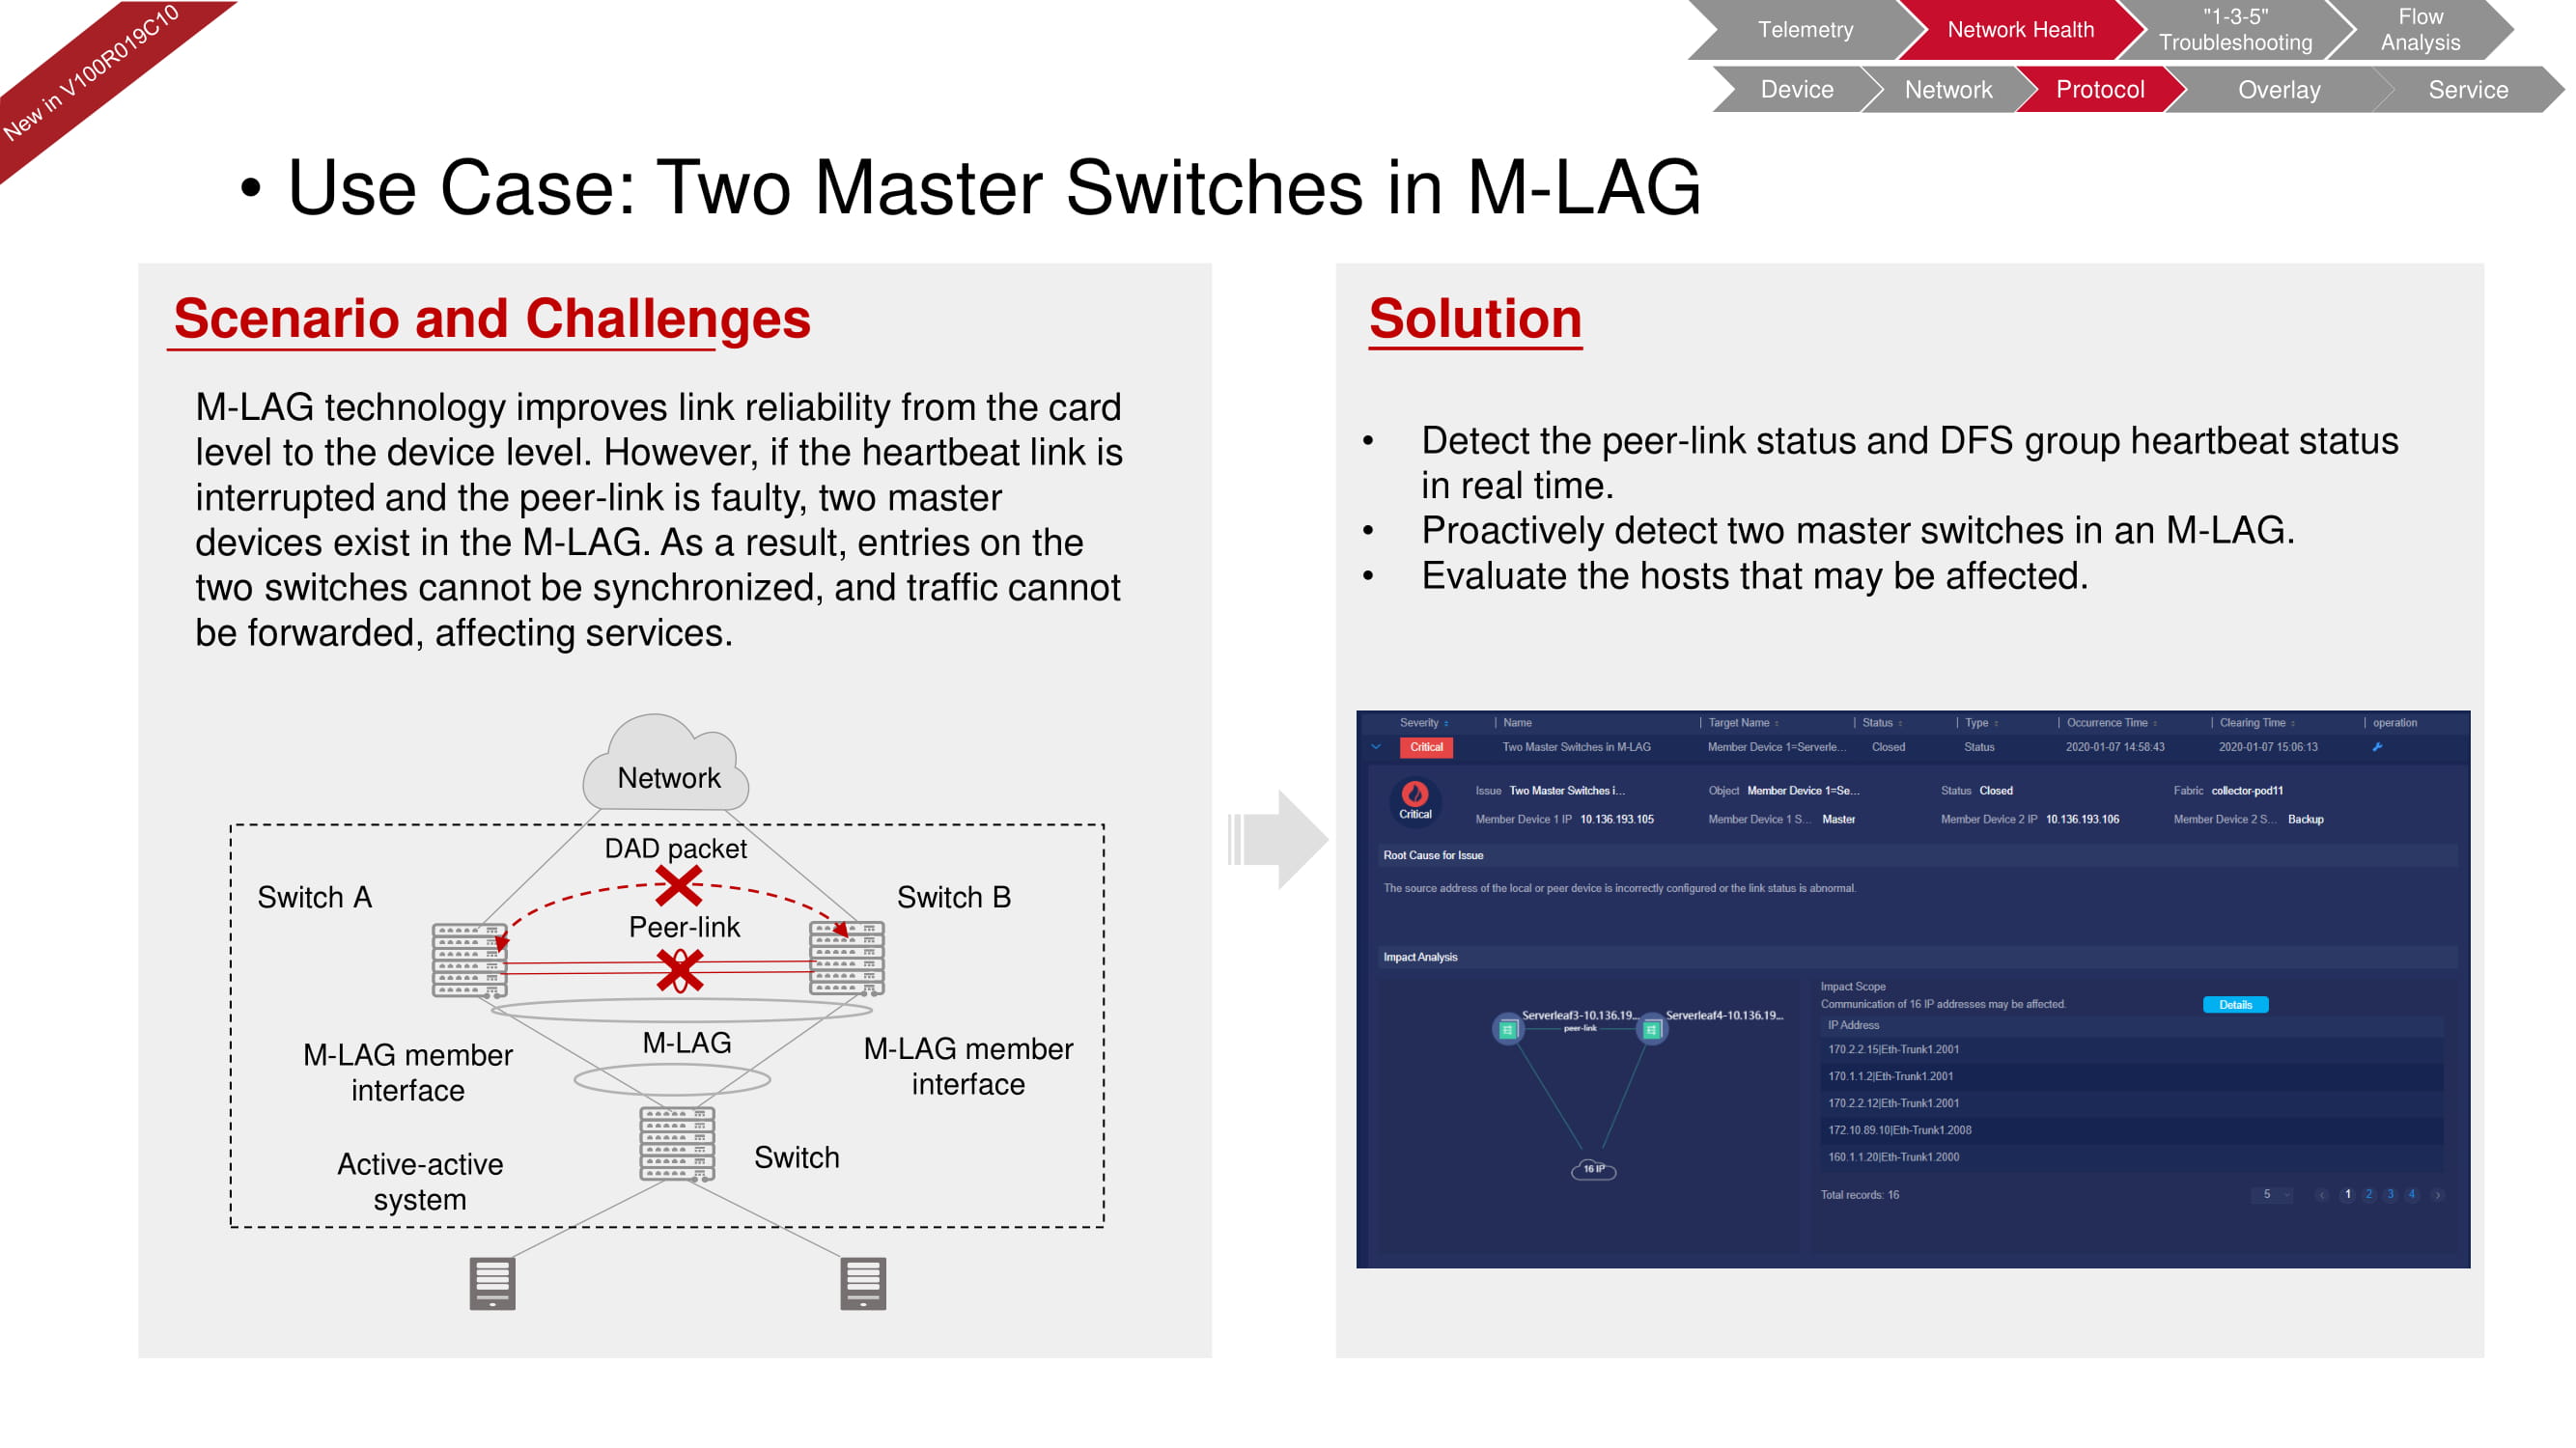
Consider the conflict of master switches. With all the advantages of the M-LAG technology, in the event of a link breakage and a peer-to-peer network failure, two master switches appear in the system. FabricInsight is able to proactively respond to such a situation by constantly monitoring the state of the peer-link and DFS.
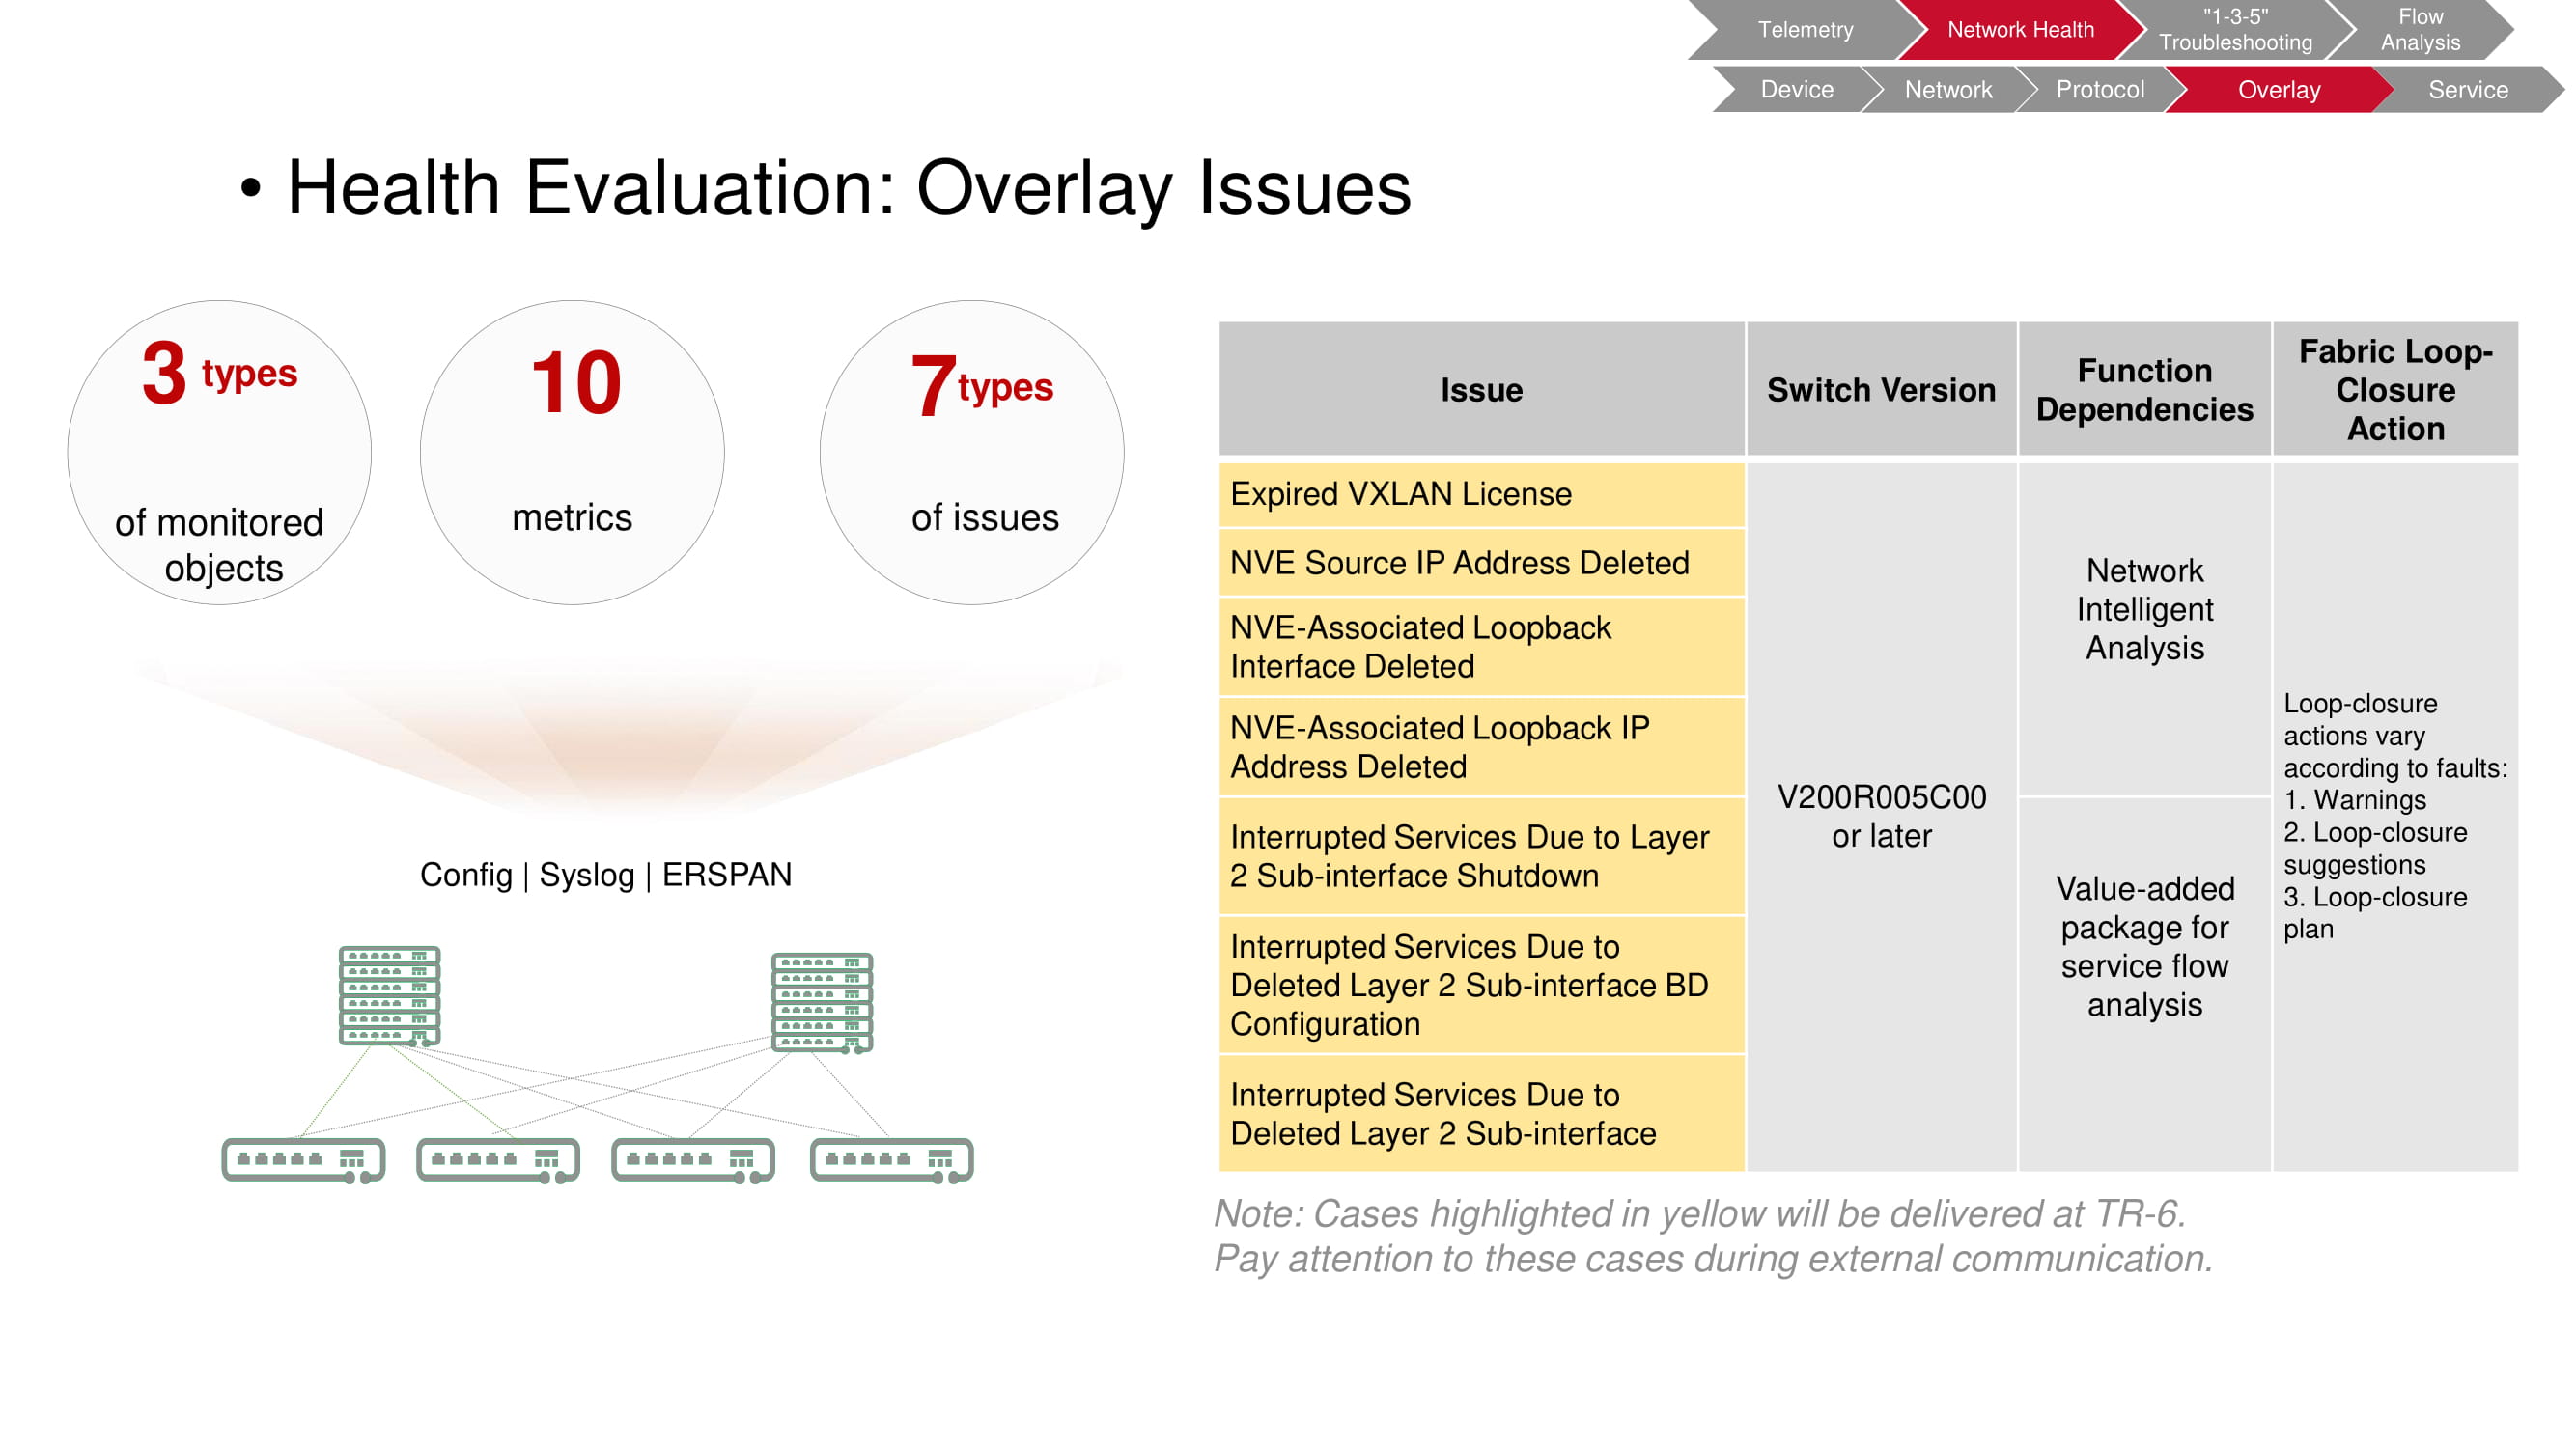
Overlay network problems
Seven types of overlay network problems can be identified by monitoring ten different metrics. FabricInsight can check VXLAN license status, find configuration errors, detect sub-interface crashes, etc. Response options are similar to those described earlier.
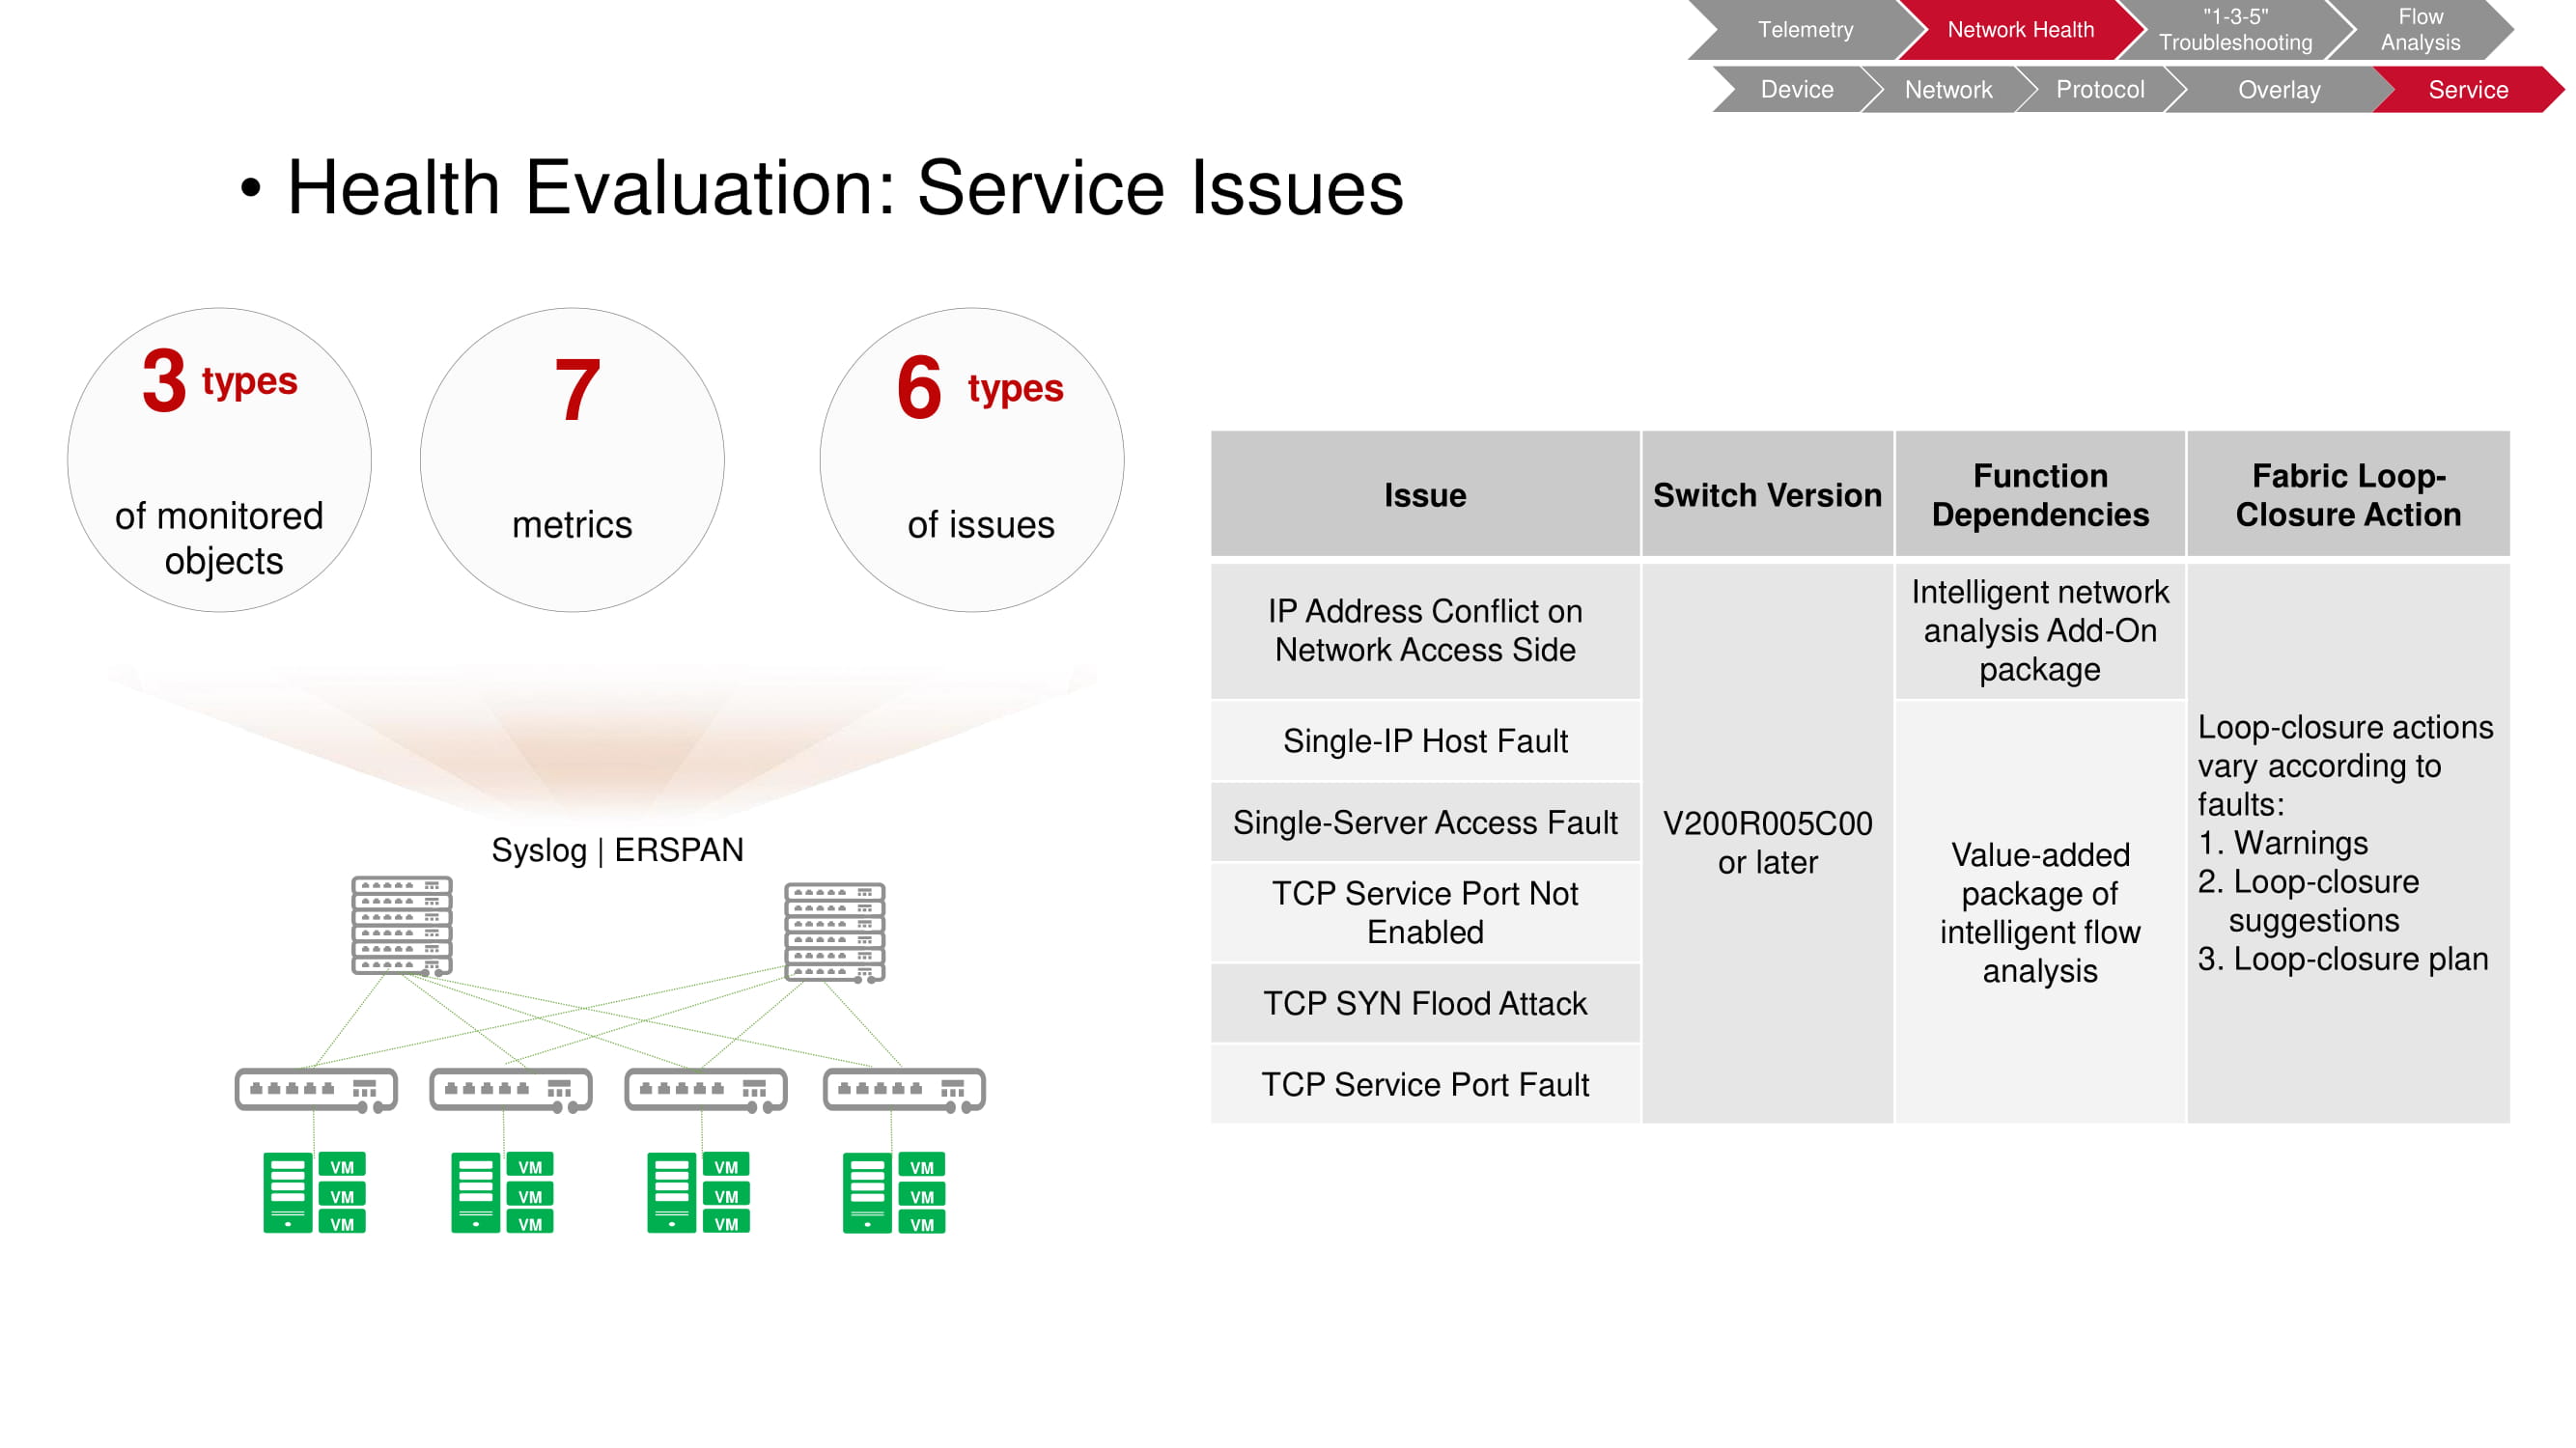
Service problems
Seven metrics are monitored to identify six types of problems at the service level. Conflicts of IP addresses, connection problems, TCP SYN flood attacks, etc. can be detected. Please note that to support these capabilities of FabricInsight, you may need a TCP stream analyzer.
Taking a broader view of troubleshooting, FabricInsight is more than just a device collector, but an extensible library of scripts that address a wide variety of problem types.

From automation to autonomy
As a summary, let's say that the ideology of the Intent-Driven Network is based on a three-stage response model, which includes the collection of information, its analysis using AI and proposals for changing the state of the network, including in automatic mode.
***
We remind you that our experts regularly host webinars on Huawei products and the technologies they use. A list of webinars for the coming weeks is available here .