At the time, I didn't know anything about p-value, hypothesis testing, or even statistical significance.
I decided to google the word "p-value", and what I found on Wikipedia made me even more confused ...
When testing statistical hypotheses, the p-value or probability value for a given statistical model is the probability that, if the null hypothesis is true, the statistical summary (for example, the absolute value of the sample mean of the difference between two comparison groups) will be greater than or equal to the actual observed results.Good job, Wikipedia.
- Wikipedia
Okay. I didn't understand what p-value actually means.
As I delved deeper into the field of data science, I finally began to understand the meaning of the p-value and where it can be used as part of decision-making tools in certain experiments.
So I decided to explain the p-value in this article, as well as how it can be used in hypothesis testing, to give you a better and more intuitive understanding of the p-values.
Also we cannot miss a fundamental understanding of other concepts and the definition of p-value, I promise that I will make this explanation intuitive without exposing you to all the technical terms I came across.
There are four sections in total in this article to give you a complete picture from building a hypothesis test to understanding p-value and using it in your decision making process. I highly recommend you go through all of them to get a detailed understanding of p-values:
- Hypothesis testing
- Normal distribution
- What is a P-value?
- Statistical significance
It will be fun.
Let's start!
1. Testing hypotheses
Before we talk about what p-value means, let's start with a discussion of hypothesis testing , where p-value is used to determine the statistical significance of our results.
Our ultimate goal is to determine the statistical significance of our results.
And statistical significance is built on these 3 simple ideas:
- Hypothesis testing
- Normal distribution
- P-value
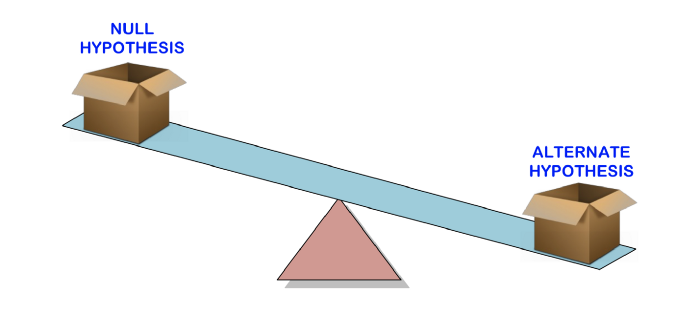
Hypothesis testing is used to test the validity of a statement (null hypothesis) made about a population using sample data. An alternate hypothesis is one that you would believe if the null hypothesis turned out to be wrong.
In other words, we will create a claim (null hypothesis) and use the sample data to check if the claim is valid. If the statement is not true, we will choose an alternative hypothesis. Everything is very simple.
To find out if a claim is valid or not, we will use the p-value to weigh the strength of the evidence to see if it is statistically significant. If the evidence supports the alternative hypothesis, then we reject the null hypothesis and accept the alternative hypothesis. This will be explained in the next section.
Let's use an example to make this concept clearer, and this example will be used throughout this article for other concepts.
Example. Suppose a pizzeria claims to have an average of 30 minutes or less delivery time, but you think it is longer than the stated. So you do a hypothesis test and randomly select a delivery time to test the claim:
- — 30
- — 30
- , , — — , .
We will use a one-way test in our case, since it is only important for us that the average delivery time exceeds 30 minutes. We will not consider this possibility in the other direction, as the consequences of the average delivery time being less than or equal to 30 minutes are even more preferable. Here we want to check if there is a chance that the average delivery time is more than 30 minutes. In other words, we want to see if the pizzeria has cheated us.
One of the common ways to test hypotheses is using the Z-test. We will not go into details here as we want to better understand what is happening on the surface before diving deeper.
2. Normal distribution
The normal distribution is a probability density function used to view the distribution of data.
The normal distribution has two parameters, the mean (μ) and the standard deviation, also called sigma (σ).
The mean is the central trend in the distribution. It defines the location of the peak for normal distributions. Standard deviation is a measure of variability. It determines how far from the mean the values tend to fall.
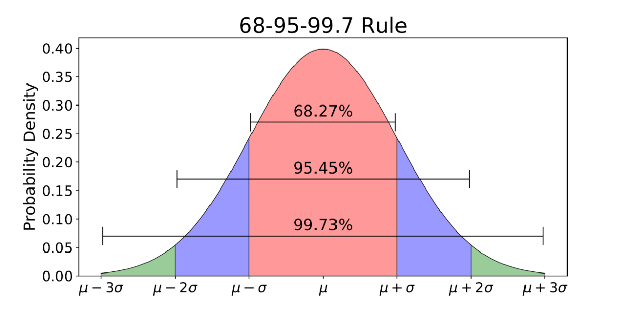
The normal distribution is usually associated with the 68-95-99.7 rule (image above).
- 68% of the data are within 1 standard deviation (σ) of the mean (μ)
- 95% of the data are within 2 standard deviations (σ) of the mean (μ)
- 99.7% of the data are within 3 standard deviations (σ) of the mean (μ)
Remember the five sigma threshold for the Higgs boson that I talked about at the beginning? 5 sigma is about 99.99999426696856% of the data that must be received before scientists confirm the discovery of the Higgs boson. This was a strict threshold set to avoid any possible false signals.
Cool. Now you may be wondering, "How does the normal distribution relate to our previous hypothesis testing?"
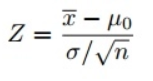
Since we used the Z-test to test our hypothesis, we need to calculate the Z-scores (which will be used in our test statistics), which are the number of standard deviations from the mean of the data point. In our case, each data point is the pizza delivery time we received. Note that when we calculated all Z-scores for each pizza delivery time and plotted a standard normal distribution curve as shown below, the unit on the X-axis will change from minutes to the unit of standard deviation as we standardized the variable by subtracting the mean and dividing its by the standard deviation (see the formula above). Examining the standard bell curve is useful because we can compare test results with a “normal” population with a standardized unit in standard deviation, especially when we have a variable that comes with different units.

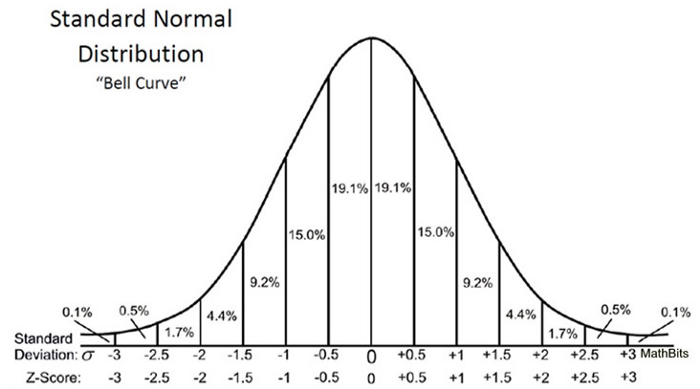
The z-score can tell us where the overall data lie compared to the average population.
I like the way Will Cursen put it: the higher or lower the Z-score, the less likely a random outcome will be and the more likely a meaningful outcome will be.
But how high (or low) is considered compelling enough to quantify how significant our results are?
Climax
Here, we need the last piece to solve the puzzle, the p-value, and check if our results are statistically significant based on the significance level (also known as alpha) that we set before starting our experiment.
3. What is P-value?
Finally ... We're talking about p-value here!
All of the previous explanations are intended to set the stage and lead us to this P-value. We need the previous context and steps to understand this mysterious (actually not so mysterious) p-value and how it might lead to our decisions to test the hypothesis.
If you've come this far, keep reading. Because this section is the most exciting part of them all!
Instead of explaining p-values using Wikipedia's definition (sorry Wikipedia), let's explain it in our context - pizza delivery time!
As a reminder, we have randomly selected some pizza delivery times, and the goal is to check if the delivery time exceeds 30 minutes. If the final evidence supports the pizzeria's claim (average delivery time is 30 minutes or less), then we will not reject the null hypothesis. Otherwise, we refute the null hypothesis.
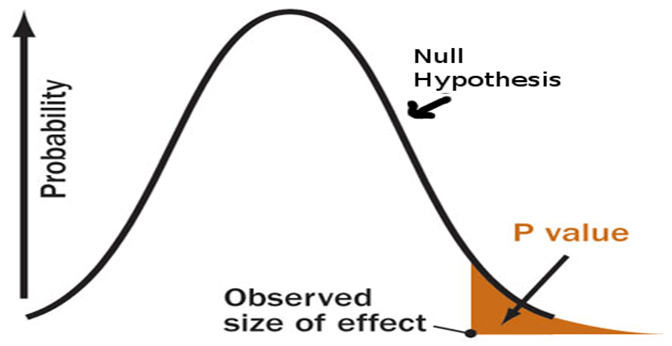
So the p-value's job is to answer this question:
If I live in a world where pizza delivery times are 30 minutes or less (the null hypothesis is correct), how unexpected is my evidence in real life?P-value answers this question with a number - a probability.
The lower the value of p, the more unexpected the evidence is, the more ridiculous our null hypothesis looks.
And what do we do when we feel ridiculous about our null hypothesis? We reject it and choose our alternative hypothesis.
If the p-value is below a given significance level (people call it alpha, I call this the threshold of absurdity - don't ask why, it's just easier for me to understand), then we reject the null hypothesis.
Now we understand what p-value means. Let's apply this in our case.
P-value in calculating pizza delivery time
Now that we have collected some sample data on delivery times, we performed the calculation and found that the average delivery time is 10 minutes longer with a p-value of 0.03.
This means that in a world where pizza delivery times are 30 minutes or less (the null hypothesis is correct), there is a 3% chance that we will see the average delivery time at least 10 minutes longer due to random noise. ...
The smaller the p-value, the more meaningful the result will be, because it is less likely to be caused by noise.
In our case, most people misunderstand the p-value:
A p-value of 0.03 means there is a 3% (percentage probability) that the result is due to chance - which is not true.People often want a definite answer (myself included), which is why I have been confused for a long time with the interpretation of p-values.
The p-value doesn't * prove * anything. It's just a way to use the surprise as the basis for an intelligent decision.Here's how we can use a p-value of 0.03 to help us make smart decisions (IMPORTANT):
- Cassie Kozyrkov
- Imagine we live in a world where the average delivery time is always 30 minutes or less - because we believe in pizzeria (our original belief)!
- After analyzing the delivery time of the collected samples, the p-value is 0.03 lower than the significance level of 0.05 (assuming we set this value before our experiment) and we can say that the result is statistically significant.
- , 30 , , , , .
- ? ( ) . , , , , , , .
- , — .
By now, you may have figured something out already ... Depending on our context, p-values are not used to prove or justify anything.
In my opinion, p-values are used as a tool to challenge our initial belief (null hypothesis) when the result is statistically significant. The moment we feel ridiculous with our own belief (assuming the p-value indicates that the result is statistically significant), we discard our original belief (reject the null hypothesis) and make an intelligent decision.
4. Statistical significance
Finally, this is the last stage where we put everything together and check if the result is statistically significant.
It is not enough to have only a p-value, we need to set a threshold (significance level - alpha). Alpha should always be set before experimenting to avoid bias. If the observed p-value is lower than alpha, then we conclude that the result is statistically significant.
The basic rule of thumb is to set alpha to 0.05 or 0.01 (again, the value depends on your task).
As mentioned earlier, suppose we set the alpha to 0.05 before we started the experiment, the result is statistically significant since the p-value of 0.03 is lower than the alpha.
For your reference, below are the main steps for the entire experiment:
- Formulate the null hypothesis
- Form an alternative hypothesis
- Determine the alpha value to use
- Find the Z-score associated with your alpha level
- Find test statistics using this formula
- If the test statistic is less than the alpha Z-score (or the p-value is less than the alpha value), reject the null hypothesis. Otherwise, do not reject the null hypothesis.
If you would like to learn more about statistical significance, feel free to check out this article - Explaining Statistical Significance , written by Will Kersen .
Subsequent reflections
There's a lot to digest here, isn't there?
I can't deny that p-values are inherently confusing to many people, and it took me quite a while to really understand and appreciate the p-values and how they might be applied within our decision making process. as data scientists.
But don't rely too much on p-values, as they only help in a small part of the entire decision-making process.
I hope that my explanation of p-values has become intuitive and helpful in your understanding of what p-values really mean and how they can be used to test your hypotheses.
Calculating p-values is simple in itself. The hard part comes when we want to interpret p-values in hypothesis testing. Hopefully now the hard part becomes a little easier for you.
If you want to learn more about statistics, I highly recommend that you read this book (which I am currently reading!) - Practical Statistics for Data Scientists, specially written for data scientists to understand the fundamental concepts of statistics.

Learn more about how to get a high-profile profession from scratch or Level Up in skills and salary by taking SkillFactory's paid online courses:
- Training the Data Science profession from scratch (12 months)
- Analyst profession with any starting level (9 months)
- Machine Learning (12 )
- «Python -» (9 )
- DevOps (12 )
- - (8 )
- Data Sciene 2020
- Data Science . Business Science
- Data Scientist
- Data Scientist -
- 450
- Data Science : «data»
- Data Sciene : Decision Intelligence