
Even a convenient and useful mobile application without analytics of user behavior will sooner or later cease to be in demand among the target audience. Therefore, in this article, you will learn the answers to a basic question about app analytics. Sit back, you will find useful information, and after reading it you can ask your questions in the comments!
What is app analytics for and how important it is
Analytics of statistical data allows companies to solve a wide range of tasks:
- building a marketing strategy;
- improvement of software;
- competitiveness assessment;
- other.
The list goes on and on. In each organization, the range of tasks to be solved depends on the goals and key metrics. From a marketing point of view, the main indicators are the number and sources of installs and ROAS (return on advertising costs). For top managers - the number of installs, app rating and ROI (return on investment). Developers measure product quality, conversions, paid audience actions, and competitive advantage.
Features of app analytics

Let's talk about the features of mobile application analytics:
1. Distribution monopoly. Most mobile applications today are distributed through the Store (app stores). IOS - App Store, Android - Google Play, etc. This places restrictions on software distribution.
Determining where the installation came from requires additional approaches. Usually trackers are used, which we will discuss in more detail below.
2. Circumstances of using the smartphone: transport, at home.The same user uses the mobile application in different conditions: for example, in the comfort of his home or driving a car. In the first case, the sections / pages are carefully looked through, all tapes fall exactly into the buttons, etc. In the second, he looks through in a hurry, does not always hit the buttons the first time, etc.
That is, the behavior of the same user differs depending on the circumstances in which he uses the smartphone. And this is important to consider when analyzing mobile applications.
3. Unstable wireless connection - "arrival" of events. The wireless internet connection may be interrupted and then restored. In many operating systems and mobile devices themselves, programs work without a network connection (if such support was provided by the developers themselves).
Because of this, it is impossible to instantly collect all analytics at once. User actions are saved and after reconnecting to the Internet are sent to the statistics system (it also takes some time to send the collected information).
To save platform resources, analysts have introduced a window for sending data (as a rule, it does not exceed 7 days). That is, they collect data on user behavior without an Internet connection for a week. If during this time the smartphone has not connected to the Network, the information is deleted.
View reports in the analytics system for the last 7 days, because they will gradually be supplemented by “arrivals”.
4. Interaction with OS platforms.Different platforms have their own characteristics for software development, which must be taken into account in work. For example, on iOS and Android, users are identified by different advertising IDs. They differ from each other in characteristics, length and special characters.
5. Susceptibility to falls - crashes and errors. Mobile applications, like any other software, are prone to errors and crashes. Unfortunately, this happens in any project for various reasons: bugs in operating systems, devices or the application itself.
Mistakes and crashes are negative experiences for the audience. To minimize negative consequences, analysts collect information about bugs. To do this, use special software solutions, which will be discussed in more detail in the following sections of the article.
6. Device limitations: memory, battery, etc. Mobile devices are standalone devices, so the problem of memory capacity or battery power is more acute with them than with desktop computers or laptops.
For example, adding a large number of analytics systems makes the program heavier. Because of this, some users have problems with installation or use and refuse to interact with the program. Unoptimized code causes increased stress on smartphones and tablets, which leads to faster battery drain. And this becomes the reason for the audience leaving.
Intelligent analytics identify these reasons and help developers make the right decisions to further improve the software.
SDK integration

Working with the mobile application analytics system begins with the integration of the SDK - the program code (component) of the counter - to collect data. Moreover, it is important not only to implement it into the application, but also to test it for correct operation.
Experienced analysts have repeatedly encountered situations where the developer did not bother testing the SDK. As a result, after the launch, important data on user behavior, conversions, etc. were “lost”. And this information is very important at the initial stages of product development: on their basis, edits are made, the application is "finished" for the most accurate solution of user problems.

Rapid detection of incorrect SDK operation will not allow receiving actual data the next day. First, they identify the error, then fix and "roll out" the new version of the software to the markets. As a rule, it takes users about a week to update the software.
Mobile app user path

Before moving on to considering the types and tools of app analytics, let's take a closer look at the path of a mobile application user.
Note the funnel (image above). Does she remind you of something? The stages are very similar to the funnel of another business: a website or even an offline store.
It all starts with installing the application and the first launch. Next - activation - the user undergoes a short training or acquaintance with the software. Developers implement this step with hint systems that indicate the correct interaction with the software.
The next stage is a cycle of basic actions. Returning to the application, performing targeted actions (for example, purchasing). This can be repeated several times before the user becomes loyal and recommends the program to his relatives, friends, colleagues, etc.
Below the funnel, look at the "Tools" line. It identifies the solutions that are used for analytics at one stage or another. For example, at the stage of installation and first launch, tracking and ASO (optimization of software for the market) are usually used.
Types of app analytics
Specialists identify three main types of application analytics:
- Marketing analytics. Analysis of advertising campaigns. Answers the question: What is the most effective promotion channel for software? The number of installations, sources and key user actions are evaluated.
- Product analytics. Analysis of user behavior in the application. Answers the question: what to change in conversion software? The number of user actions, profit and retention of useful users is estimated.
- Store analytics. Analysis and monitoring of the popularity of the application. Answers the question: how good is the product for the target audience? The number of installs, sources and key actions are assessed.
Please note that marketing and store analytics are similar. Only in the first case all advertising campaigns are evaluated, and in the second - the position of the program in the AppStore, Google Play and other similar platforms. To work with both types, trackers are often used, which we will discuss below.
App analytics tools

Experts distinguish several categories of app analytics tools that are most often used in work:
- tracking - tracking the marketing activity of users;
- product analytics - important product metrics: audience, new users, number of sessions, average session length, etc .;
- crash statistics - analysis of the stability of the mobile application, the number of crashes, errors, etc., which forms a negative user experience;
- push and in-app communications - push notifications for communication with users (analysts assess the click-through rate and engagement of the tool);
- — ASO ( ) , ;
- — , ;
- — , ( , - .);
- — , , A/B-, deep-, ..
One might wonder why there are so many categories? Is there really no single system that combines all this. Yes, there are such systems, but they have certain features. Because of this, it is not always possible to apply them in a particular project to collect high-quality data, so you have to work with different platforms that perform 1-3 tasks.
Don't be intimidated by the sheer number of app analytics tool categories. At first glance, it seems that working with multiple platforms takes a lot of time and requires a lot of effort to collect and consolidate data into a single report.
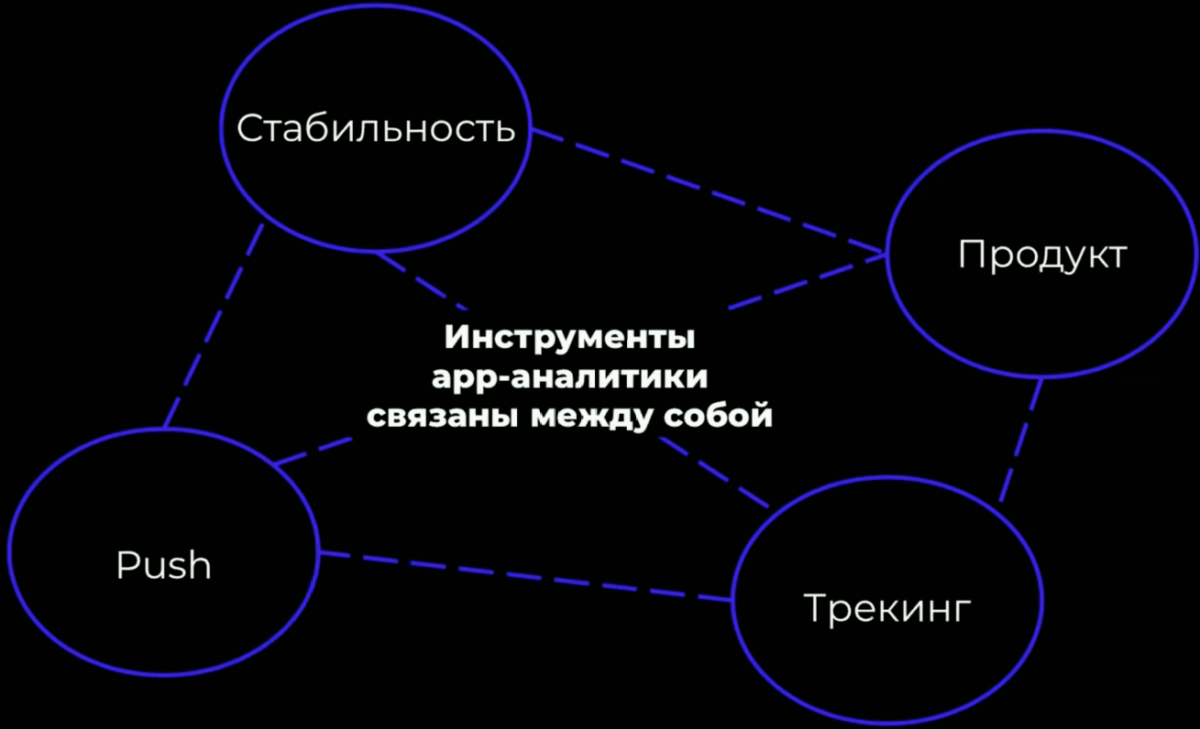
So how do you get a holistic view of the user experience if you have to work with multiple disparate tools? There is no universal answer to this question. The analyst himself chooses how to combine the entire platform into a single system. Everyone has their own approaches that allow them to perform the main tasks: collect information about user behavior, conversions, key metrics, etc.
Marketing & Store Analytics

As you remember, users come from different sources: AppStore, Google Play, ads, etc. Tracking traffic sources concerns marketing and store analytics and is implemented by trackers.
Above is a diagram of how tracking works. Let's understand it in more detail. There is a user using a mobile device. He sees the ad and makes a click. It is processed by the tracking system: it determines whether the application is installed on the device or not.
In the first case, there is a redirect to the Store to download and install software. In the second, a redirect to the installed program to demonstrate the required information. After installation and the first launch, the information about the click is sent to the tracking system and processed. Next, a report is generated with the data necessary for the analyst.
Also, installation data is sent to the advertising system, because it has nowhere to get information about the conversion that took place. The site's built-in tools only detect clicks.
There are other tasks that are performed by tracking:
- Determination of the type of conversion: installs, re-engagement (retargeting), events, purchases.
- Separation of traffic channels: organic, paid, referral.
- Analysis of the effectiveness of campaigns: CPI, CPA, Retargeting.
- Campaign optimization: price, audience, conversions.
The most popular tracking services on the Runet are Adjust, AppsFlyer, AppMetrica, and Branch. They differ from each other in characteristics and functions. But there is one thing in common: they do not replace product analytics in general.
Most trackers have some limitations:
- lack of integration with some advertising platforms;
- there are no specialized reports, as is the case with product analytics;
- it is impossible to objectively measure user subscriptions.
Product analytics
It is a complex of analytics methods aimed at improving the application: financial, marketing and user characteristics. Data analysis allows you to create effective advertising campaigns, more accurately satisfy the pain of the audience and reduce costs at all stages of product development and implementation.
Product analytics solves several main tasks:

The first task coincides with marketing analytics, differs only in advanced capabilities: a wider audience, more tools for analysis, the presence of specialized reports, etc.
Product managers are always looking for and testing new hypotheses to make the app more successful and profitable. Product analytics by monitoring project metrics (the first task) provides valuable information, on the basis of which the specialist makes a decision: the hypothesis is correct or not and whether it is worth scaling it to all software.
Some platforms help with the third challenge - A / B testing. They have built-in functionality for selecting the segments to which the innovation will apply and which one. The collected data is used to interpret the test results and make decisions.
That is, product analytics studies user behavior when interacting with software. Based on the data, the specialist understands what is happening with the application.
Here are some examples of important information:
- what buttons users click;
- how often the product is used;
- what product features are popular;
- what problems users face when interacting with the product.
This data helps the company to keep the user on the app, which is cheaper than attracting a new audience. By understanding how the customer interacts with the product, what benefits they receive and what problems they face, you will quickly make the necessary changes and increase the value of the product.

Experienced product analysts use the following services: Amplitude, Mixpanel, Devtodev, Flurry, AppMetrica and Firebase. These systems support the connection of third-party platforms: for example, tracking, push-notifications, etc.
But restrictions are also possible:
- support for frameworks and their capabilities;
- restrictions on the types of events, their number and parameters;
- access to "raw" data (not all metrics are available on the same platform);
- availability and reporting capabilities;
- tracking and working with subscriptions.
There are no completely universal platforms today. One system does not have one tool, the other lacks another. Necessary metrics are “finished off” by third-party platforms.
But systems for product analytics continue to evolve, new features and capabilities appear regularly. Stay tuned for updates, try something new and achieve high performance.
Push and in-app communications
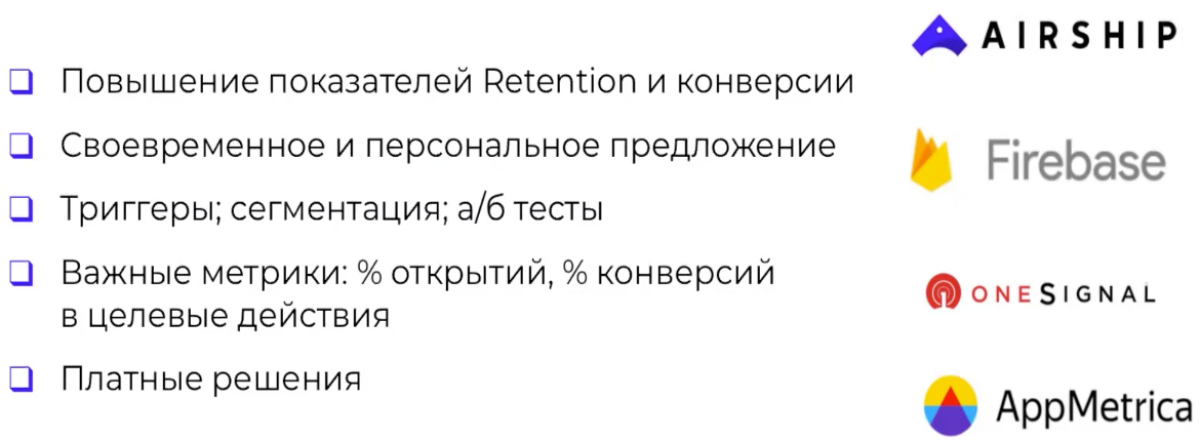
Assessment of push and in-app communications is one of the subsections of product analytics. They are used to increase retention and conversion rates. Based on the data obtained, the analyst makes a decision: which communications do not work, which ones require improvement, and which ones can be scaled up.
"Push" is used for timely and personal offer of goods / services to customers. The effectiveness of the tool has been proven in practice many times. Without notifications, users are less likely to return to the app and take targeted actions.
You can evaluate push and in-app communications on the Firebase and AppMetrica platforms. If you are using a different analytics system that does not have this feature, consider using third-party tools such as Airship or OneSignal.
Crash and error statistics

Collecting crash and error statistics is important to retain your current audience. It allows you to monitor the stability of the application, helps to identify problems and prioritize. The more an error affects key metrics, the higher its significance. Crashes with the highest priority are fixed first.
Based on this conclusion, it is not difficult to determine the main indicators of this subsection:
- % crash-free users - what percentage of users had no errors;
- % crash-free sessions - how many percent of sessions passed without errors.
Firebase and AppMetrica have built-in crash and error statistics functionality. If you work with other platforms where this is not possible, use third-party tools: App Center or Countly.
This article describes the basic elements of app analytics. Check out and try out the tools described. Analyzing user behavior data will allow you to make the right decisions, and in a couple of months you will notice an increase in target metrics. If you have any questions, ask them in the comments, we will be happy to answer!