
This article is the first in a series on Sysmon threat analysis. All other parts of the series:
Part 1. Introducing Sysmon Log Analysis
Part 2. Using Sysmon Event Data to Detect Threats (we are here)
Part 3. In-depth analysis of Sysmon threats using graphs
In this section, we will go deeper and start using detailed information provided by Sysmon. Here are three main points that we will be working on:
- Using PowerShell to directly access granular information about processes;
- Building and visualizing a hierarchy of processes is the first important step in finding threats;
- Use Sysmon metadata to generate important metrics useful in advanced threat investigations, such as calculating the frequency at which specific processes are launched.
Using Get-Sysmonlogs
Let's now take a closer look at my wonderful command that converts Sysmon events to PowerShell objects. I am somewhat proud that I didn't have to manually write separate lines of code for each of the fields. And here is, in fact, the great disclosure of the code:
$events = Get-WinEvent  -LogName "Microsoft-Windows-Sysmon/Operational" | where { $_.id -eq 1 }

foreach ($event in $events)  {
    $ev = $event.Message -split "`r`n"
    $jsons="{ "
    foreach ($line in $ev) {
        $line=$line -replace "\\","\\" `
               -replace "\{"," " `
               -replace "\}"," " `
               -replace '"','\"' `
               -replace "`n"," "
        $line=$line -replace '(\s*[\w\s]+):\s*(.*)', '"$1":"$2",'
        $jsons = $jsons + $line }

        $jsons =$jsons + '"blah" : "blah" }'
        ConvertFrom-Json -InputObject $jsons
    }
}
All the code is now available on GitHub and you can download and import it as a Sysmon module for your own project. The only instability is related to the removal of a few nasty characters - brackets, backslashes, end-of-line characters, quotes - to make the output closer to JSON.
So, the classic signal of an intruder swarming around the system is the use of the command "whoami", and often follows after "hostname". A hacker (or perhaps an insider) who gets hold of someone's account wants to make sure that impersonalization works, so he often types the above commands as soon as he is on the victim's server. For the rest, "whoami" and "hostname" are not the words they would type into the console of their own system, even if they ever use the command line.
With my neat command that gives access to all of the Sysmon log entries, we can easily concoct a process name filtering chain (as we did in part one ). At the same time, with Sysmon, we can approach the issue even more granularly by looking atthe command line of the parent process .
Usually, when a hacker penetrates the network and gains access to the command line, it is an outdated cmd - by the way, this is exactly what happens in the case of a hack with psexec or smbexec . Using the output of get-symonlogs, it is possible to catch whoami processes that were spawned by these legacy shells, and this would be a good proof of a threat.
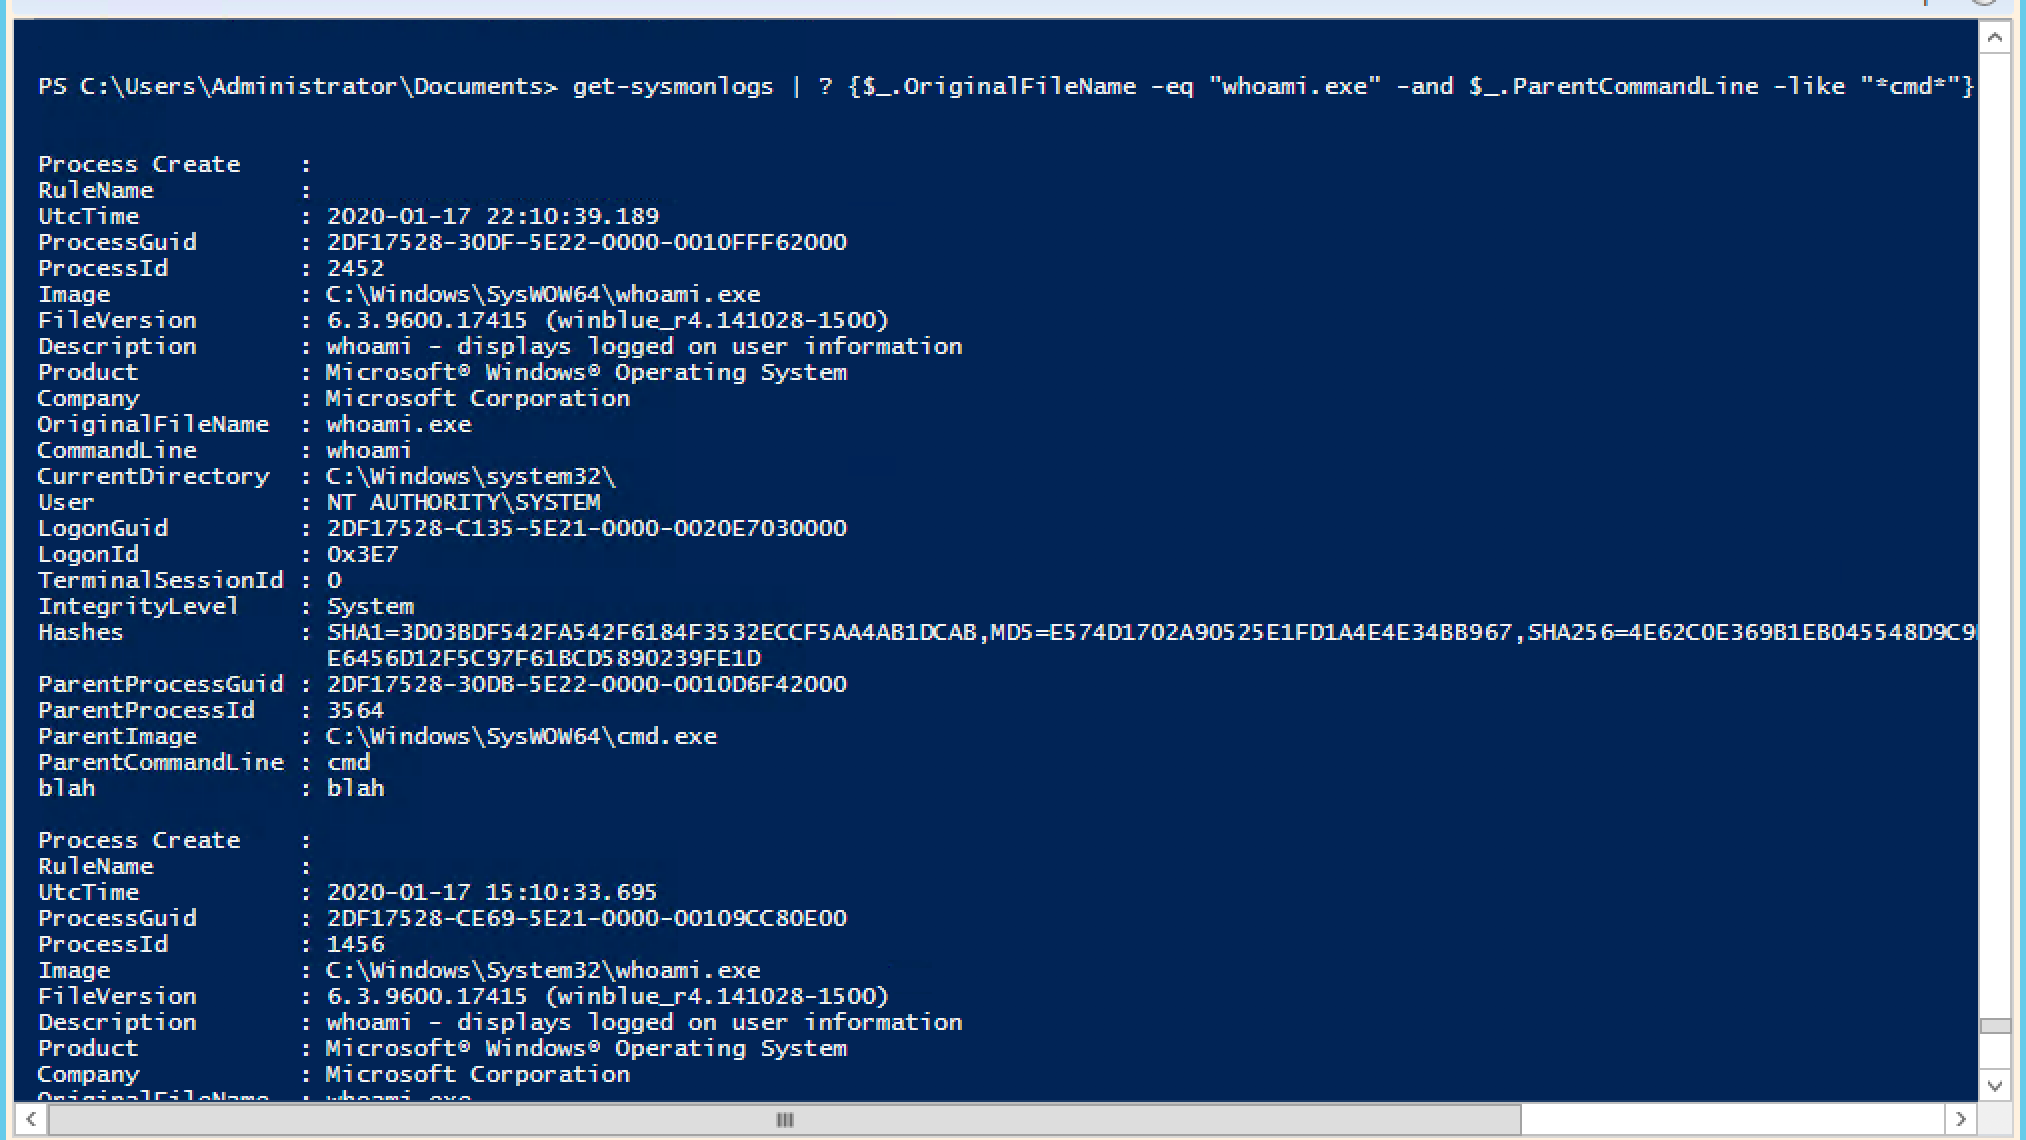
Attention: Whoami was launched through the outdated cmd shell.
From a practical point of view, searching through the "raw" logs of the Windows event log and matching processes is simply impossible. As we just saw, Sysmon recordings open up many possibilities for threat analysis. So let's continue our exploration by mapping Sysmom data into more complex structures.
The basics of data structures: lists and graphs
Sysmon logs not only provide us with the command line of the parent process, but also the process ID!
I think you have already guessed what this means. But still: now we can connect together processes in a hierarchy and, I'm not afraid to say, networks. By remembering the basic concepts of computer science, you can find natural data structures for obtaining such information - linked lists and graphs are the first to come to mind.
At first I thought I would have to dust off my copy of The Data Structures for Poets and Sous-Chefs, but then the Internet helped me out. I stumbled upon Doug Finke's gorgeous collection of basic algorithms on Gihub written in PowerShell. Thank you Doug!
After going through some learning curve, I was able to use his algorithms to structure my Sysmon events. I built the data structures as a list and a graph, and then, using the API, wrote a PowerShell function to search for a command and display the process hierarchy. Cool.
I named it show-threat-path . It searches depth-first through the process hierarchy and displays the application names and associated commands for the root application specified as an input parameter. For my first test, I searched for "whoami.exe". And this is what I saw:
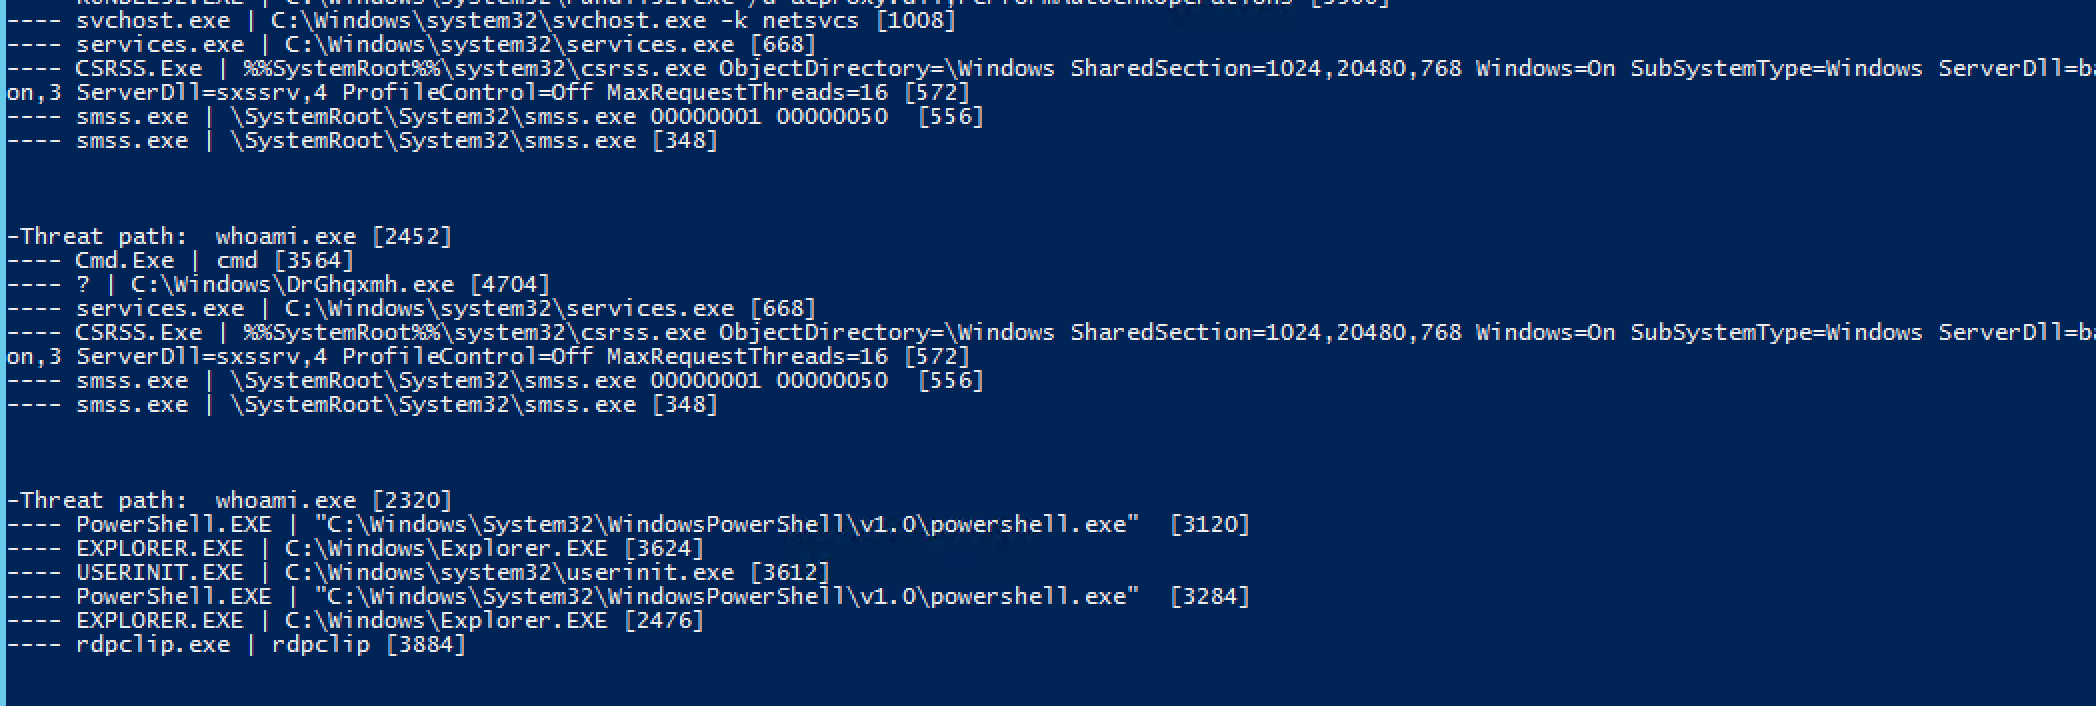
Process Hierarchy: Process 2452 looks suspicious!
An additional bonus to those who noticed in the output above that whoami associated with process 2452 was called through the outdated cmd shell, which in turn was launched by an exe file with a strange name in the Windows folder.
Hmmm. If you are familiar with the mechanics of psexec remote calls described here , then in your mind you should already be ringing the bells. But I'll tell you a little secret: playing the role of a hacker, I previously launched this whoami from a remote Linux server using the Impacket python scripts.
The goal is to demonstrate that with the help of Sysmon-enriched logs and a small portion of PowerShell, you can prepare a completely practical utility for identifying vulnerabilities, as I just did withshow-threat-path .
Hunt Threats with Directed Graphs
It's time to do stranger things. With all this process information sourced from Sysmon, you can look at relationships more generally. In other words, I want to view running applications - PowerShell.exe, Explorer.exe, etc. - as the vertices of the graph and associate them with the application that in turn launched them. The result is a diagram showing how applications interact with each other (instead of creating a separate vertex for each process instance).
From a technical point of view, we are talking about a directed graph in which a path, so to speak, is a one-way path from the application to its parent process.
At this point, it would be nice to have a look at the visualization of what I'm talking about. Fortunately, there is a great PowerShell graph visualization utility called GraphViz , which has extremely simple wrappers available through PSQuickGraph . Then with a little piece of code ...
#Let's graph it!!!
$gv = New-Graph -Type BiDirectionalGraph # PSQuickGraph
foreach ($e in $g.getAllEdges() )  { $g from Doug Fink's functions
    $vs= $e.startvertex
   $ve= $e.endvertex
    PSQuickGraph\Add-Edge -From $vs.value.Key -To $ve.value.Key -Graph $gv |Out-Null
}
Show-GraphLayout -Graph $gv
... you can visualize complex interactions between applications through the GraphViz interface:
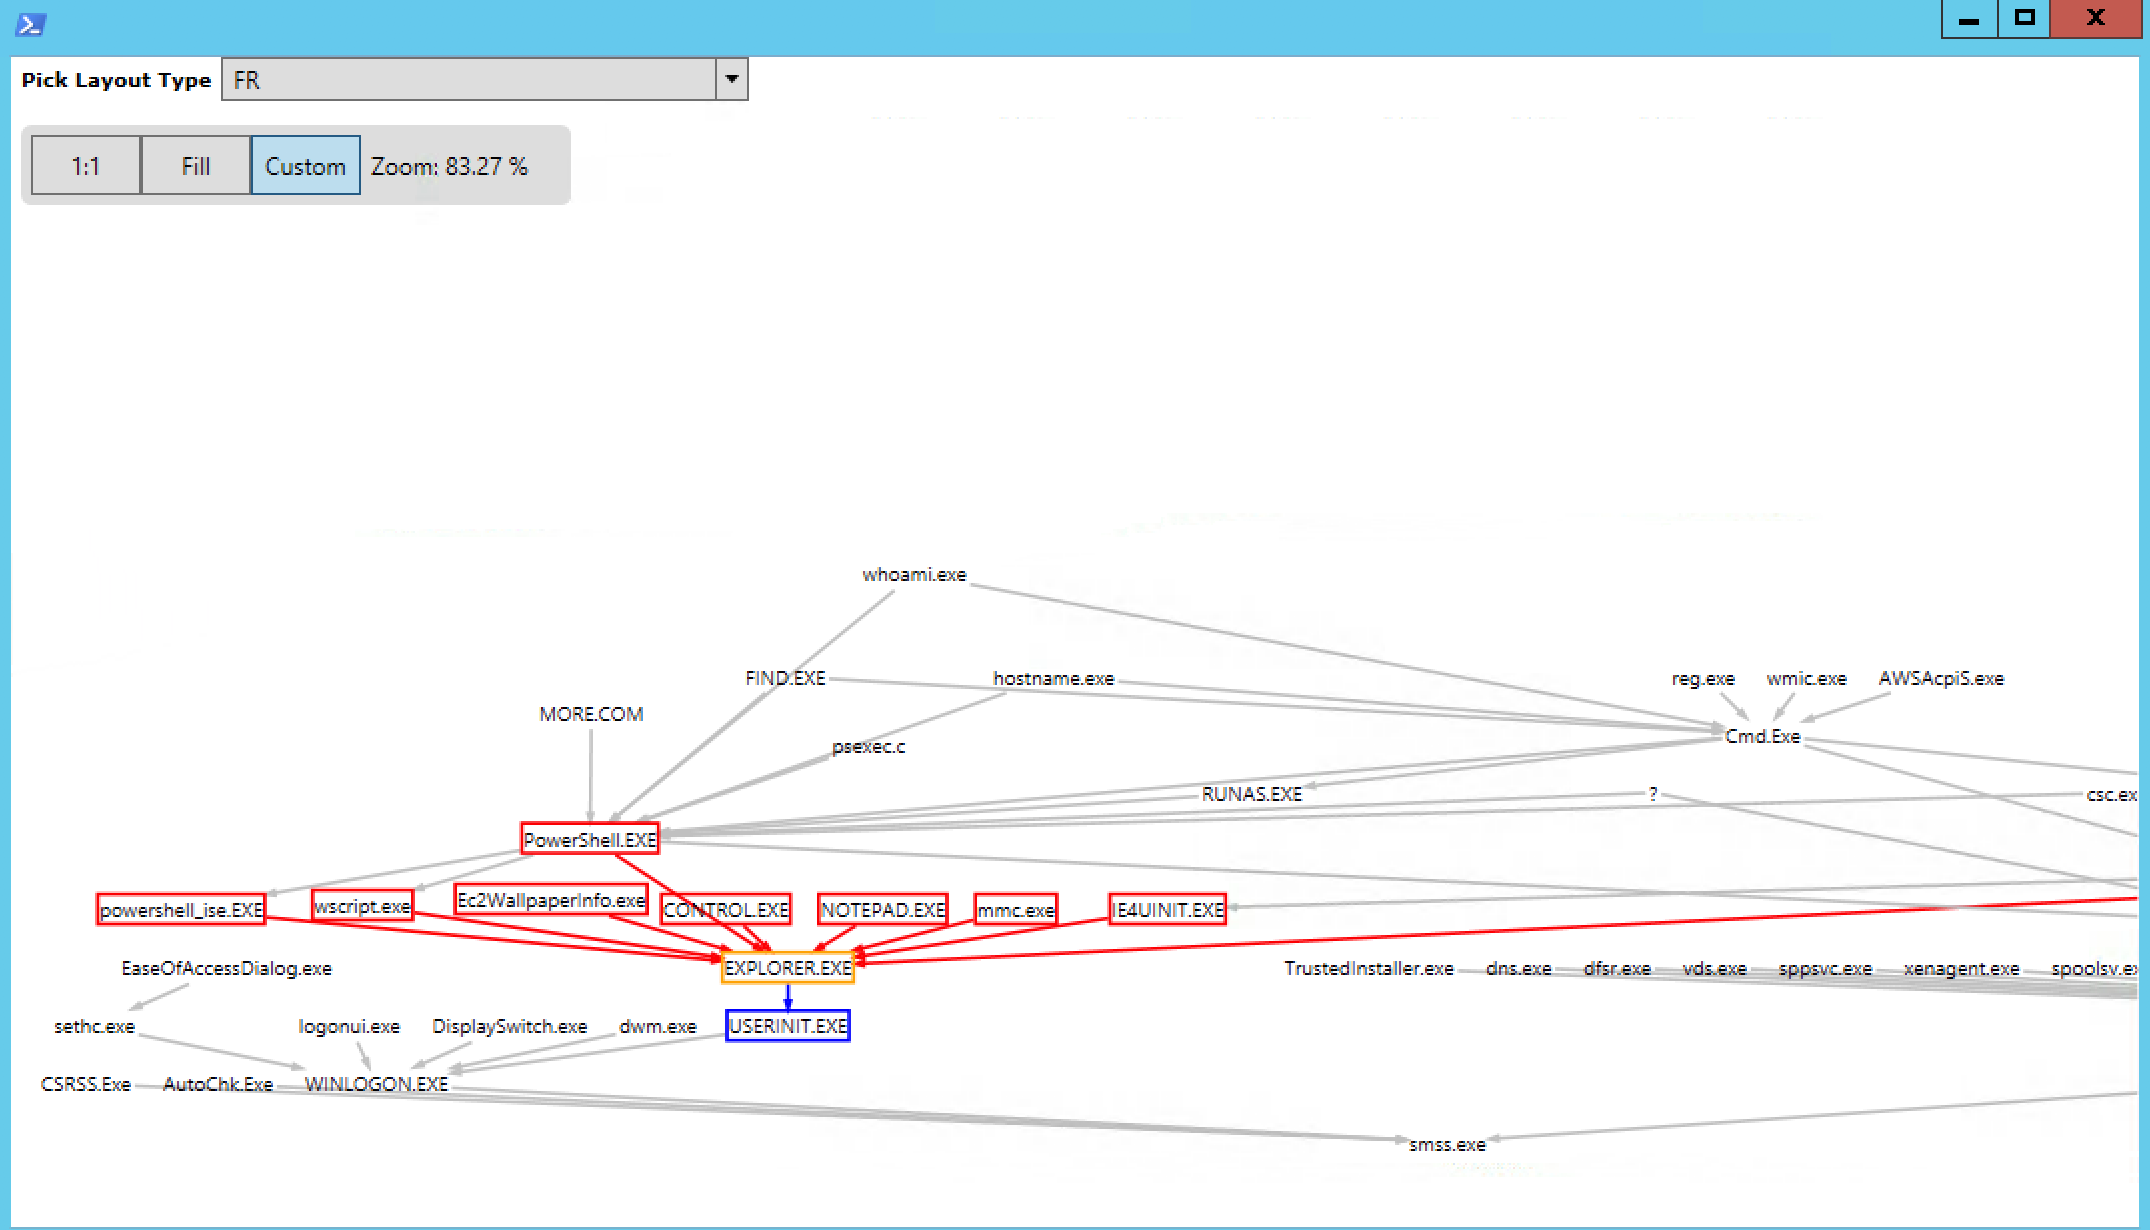
GraphViz: A PowerShell Library for Visualizing Process Hierarchies
What Does It Do? In essence, it is a graphical way to identify threats. Instead of looking for a specific signature of the text, as we did earlier with the show-threat-path command, we can now try to find anomalies on the graph.
The idea is to understand what is a normal picture of the neighborhood of graphs and subgraphs - they usually look like connected structures in the visualization - and then try to find vertices that look more detached. And in fact, our eyes are well adapted for this task. Fortunately, there are also some simple neighborhood detection and threat detection algorithms available. And once upon a time, your humble servant even wrote a post about the use of the technique of detecting neighborhoods in a social network associated with ... the famous hero of the revolution in the United States .
The advantage of this approach in finding attackers is that hackers can change their techniques and obfuscate their attacks, but it is difficult for them to hide their graph patterns.
In the third part of our review, we will delve deeper into the analysis and application of algorithms and methods for finding vulnerabilities. Stay with us!