
This article describes the technical details of the issues that caused Slack to crash on May 12, 2020. For more on the process of responding to that incident, see Ryan Katkov 's chronology, "Both Hands on the Remote . "
On May 12, 2020, Slack experienced its first significant crash in a long time. Soon we published a summary of the incident , but it's a pretty interesting story, so we would like to dwell on the technical details in more detail.
Users noticed the downtime at 4:45 p.m. PT, but the story actually started around 8:30 a.m. The Database Reliability Engineering Team received a warning about a significant increase in the load on part of the infrastructure. At the same time, the Traffic Team received warnings that we are not making some API requests.
The increased database load was caused by the deployment of a new configuration, which caused a long-standing performance bug. The change was quickly spotted and rolled back - it was a flag for a function doing a gradual deployment, so the problem was resolved quickly. The incident had little impact on customers, but it only lasted three minutes, and most users were still able to successfully send messages during this short morning glitch.
One of the consequences of the incident was a significant expansion of our main web application layer. Our CEO Stuart Butterfield wrote about some of the impact of quarantine and self-isolation on Slack usage. As a result of the pandemic, we launched significantly more instances at the web application level than back in February this year. We scale quickly when the workers are loaded, as happened here - but the workers waited much longer for some database queries to complete, which caused a higher load. During the incident, we increased the number of instances by 75%, which resulted in the highest number of web application hosts we have ever run until today.
Everything seemed to be working fine for the next eight hours - until an unusually high number of HTTP 503 errors popped up . We launched a new incident response channel, and the web application engineer on duty manually increased the web application fleet as an initial mitigation. Oddly enough, it didn't help at all. We noticed very quickly that some of the web application instances were under heavy load, while the rest were not. Numerous studies have begun investigating both web application performance and load balancing. After a few minutes, we identified the problem.
Behind the Layer 4 load balancer is a set of HAProxy instances to distribute requests to the web application tier. We use Consul for service discovery and a consul-template for rendering lists of healthy web application backends to which HAProxy should route requests.
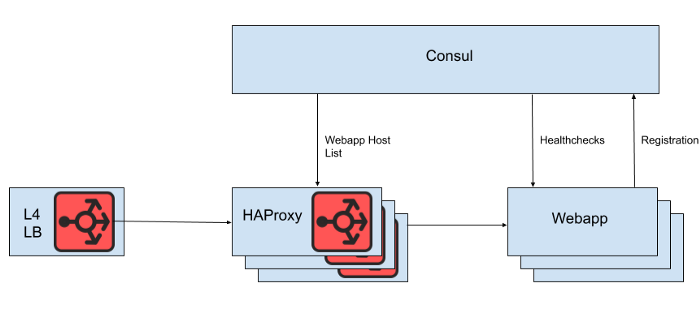
Fig. 1. A high-level view of the Slack load balancing architecture
However, we do not render the list of web application hosts directly from the HAProxy configuration file, because updating the list in this case requires a reboot of HAProxy. The HAProxy reboot process involves creating a completely new process, while keeping the old one until it finishes processing current requests. Very frequent reboots can lead to too many HAProxy processes running and poor performance. This limitation conflicts with the goal of automatically scaling the web application tier, which is to bring new instances into production as quickly as possible. Therefore, we are using the HAProxy Runtime APIto manage the state of the HAProxy server without rebooting every time the web tier server comes in or out. It's worth noting that HAProxy can integrate with the Consul DNS interface, but this adds lag due to the DNS TTL, limits the ability to use Consul tags, and managing very large DNS responses often leads to painful edge situations and errors.

Fig. 2. How a set of web application backends are managed on a single Slack HAProxy server
In our HAProxy state, we define templates for HAProxy servers . In fact, these are "slots" that web application backends can occupy. When an instance of a new web application is rolled out or the old one starts to fail, the Consul service catalog is updated. Consul-template prints out a new version of the host list, and a separate haproxy-server-state-management program developed in Slack reads this host list and uses the HAProxy Runtime API to update the HAProxy state.
We run M concurrent HAProxy Instance Pools and Web Application Pools, each in a separate AWS Availability Zone. HAProxy is configured with N "slots" for web application backends in each AZ, giving a total of N * M backends that can be directed to all AZs. A few months ago, that number was more than enough - we have never launched anything even close to that many instances of our web application tier. However, after the morning database incident, we launched slightly more than N * M web application instances. If you think of HAProxy slots as a giant game of chairs, then some of these webapp instances are left without space. This was not a problem - we have more than enough service capacity.
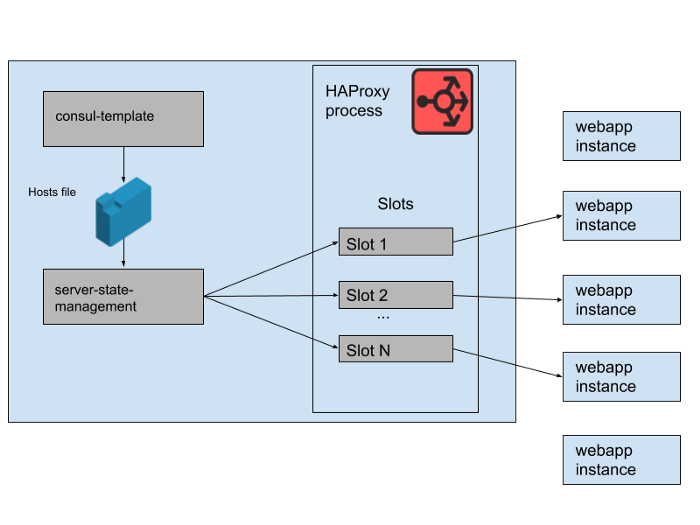
Fig. 3. "Slots" in the HAProxy process with some redundant web application instances not receiving traffic
However, there was a problem during the day. There was a bug in the program that synchronized the host list generated by the consul-template with the state of the HAProxy server. The program always tried to find a slot for new webapp instances before freeing up slots occupied by old webapp instances that no longer work. This program started throwing errors and exiting early because it could not find any empty slots, which meant that the running HAProxy instances did not update their state. As the day progressed, the webapp autoscaling group grew and shrank, and the list of backends in the HAProxy state became more and more obsolete.
At 4:45 pm, most HAProxy instances were only able to send requests to the set of backends available in the morning, and this set of old webapp backends was now a minority. We regularly provide new HAProxy instances, so there were a few fresh ones with the correct configuration, but most of them were over eight hours old and therefore stuck with a full and outdated backend state. Ultimately, the service crashed. This happened at the end of a business day in the United States, because that's when we start scaling the web application tier as traffic decreases. The autoscale would shut down the old webapp instances in the first place, which meant that there weren't enough of them left in the server state of HAProxy to serve demand.
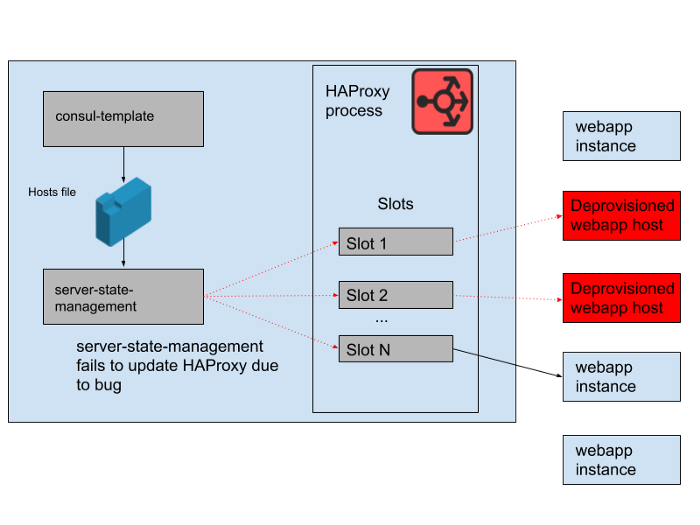
Fig. 4. The state of HAProxy changed over time and slots started referring mainly to remote hosts.
Once we found out the cause of the failure, it was quickly fixed by a smooth restart of the HAProxy fleet. After that, we immediately asked a question: why the monitoring did not catch this problem. We have an alert system for this particular situation, but unfortunately it didn't work as intended. The monitoring failure was not noticed, in part because the system “just worked” for a long time and did not require any changes. The broader HAProxy deployment of which this application is a part is also relatively static. At a slow rate of change, fewer engineers interact with the monitoring and alerting infrastructure.
We didn’t rework this HAProxy stack much, because we are gradually moving all load balancing to Envoy (we recently moved web socket traffic to it). HAProxy has served well and reliably for many years, but it has some operational issues as in this incident. We will replace the complex pipeline for managing the state of the HAProxy server with our own integration of Envoy with the xDS control plane for endpoint discovery. The most recent versions of HAProxy (since version 2.0) also solve many of these operational problems. Nevertheless, we have been trusting Envoy with the internal service mesh for some time now, so we strive to transfer load balancing to it too. Our initial testing of Envoy + xDS at scale looks promising, and this migration should improve both performance and availability in the future.The new load balancing and service discovery architecture is immune to the issue that caused this failure.
We strive to keep Slack accessible and reliable, but in this case we have failed. Slack is an essential tool for our users, which is why we strive to learn from every incident, whether customers noticed it or not. We are sorry for the inconvenience caused by this failure. We promise to use this knowledge to improve our systems and processes.