
I must say right away: I am not an IT specialist, but an enthusiast in the field of statistics. In addition, I have participated in various Formula 1 prediction competitions over the years. Hence the tasks that my model faced: to issue forecasts that would be no worse than those that are created "by eye". And ideally, the model, of course, should beat human opponents.
This model focuses solely on predicting the outcome of qualifications, as qualifications are more predictable than races and are easier to model. However, of course, in the future I plan to create a model that allows predicting the results of the races with good enough accuracy.
To create a model, I summarized all the results of practices and qualifications for the seasons 2018 and 2019 in one table. 2018 served as a training sample, and 2019 as a test sample. Based on this data, we built a linear regression . To put regression as simply as possible, our data is a collection of points on a coordinate plane. We have drawn a straight line that deviates least from the totality of these points. And the function, the graph of which is this line - this is our linear regression.
From the formula known from the school curriculumour function is distinguished only by the fact that we have two variables. The first variable (X1) is the lag in the third practice, and the second variable (X2) is the average lag in the previous qualifications. These variables are not equivalent, and one of our goals is to determine the weight of each variable in the range from 0 to 1. The further a variable is from zero, the more important it is in explaining the dependent variable. In our case, the dependent variable is the lap time, expressed in the lag behind the leader (or, more precisely, from a certain “ideal circle”, since this value was positive for all pilots).
Fans of the Moneyball book (which is not explained in the movie) may recall that using linear regression, they determined that the base percentage, aka OBP (on-base percentage), is more closely related to the wounds earned than other statistics. Our goal is roughly the same: to understand which factors are most closely related to qualifications outcomes. One of the big advantages of regression is that it does not require advanced knowledge of mathematics: we just enter the data, and then Excel or another spreadsheet editor gives us ready-made coefficients.
Basically, we want to know two things with linear regression. First, the extent to which our chosen independent variables explain the change in function. And second, how important each of these independent variables is. In other words, what better explains the qualification results: the results of races on previous tracks or the results of training sessions on the same track.
An important point should be noted here. The end result was the sum of two independent parameters, each of which resulted from two independent regressions. The first parameter is the team's strength at this stage, more precisely, the lag of the team's best pilot from the leader. The second parameter is the distribution of forces within the team.
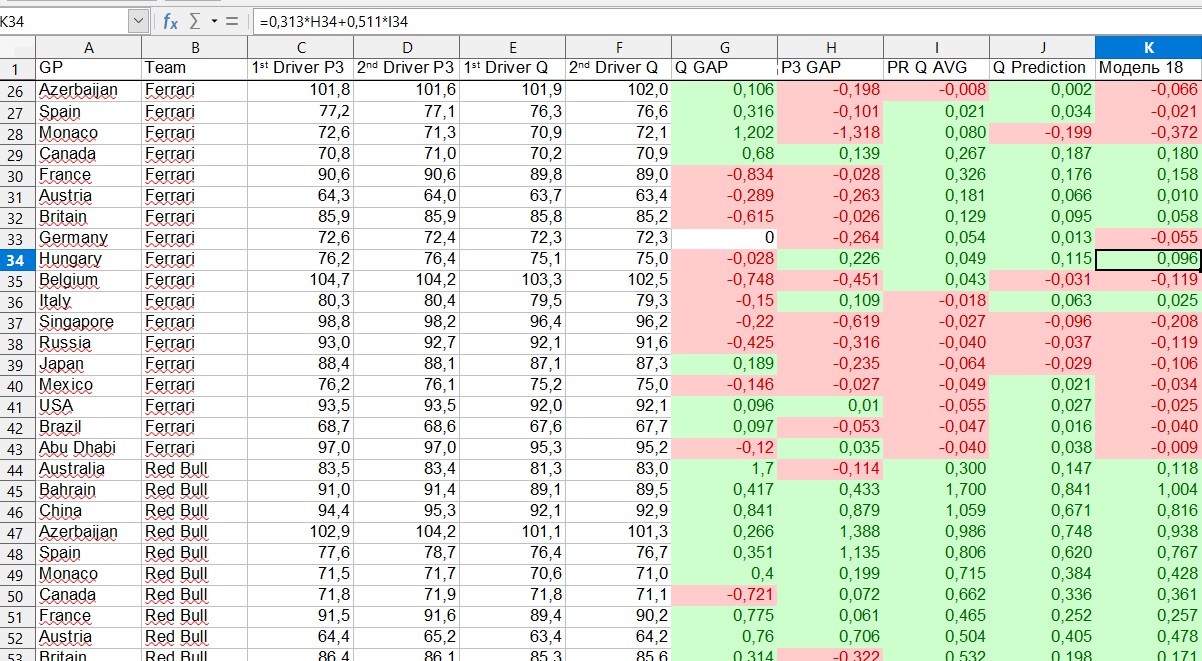
What does this mean by example? Let's say we take the 2019 Hungarian Grand Prix. The model shows that Ferrari will be 0.218 seconds behind the leader. But this is the lag of the first pilot, and who they will be - Vettel or Leclair - and what the gap between them will be, is determined by another parameter. In this example, the model showed that Vettel will be ahead, and Leclair will lose 0.096 seconds to him.
Why such difficulties? Isn't it easier to consider each pilot separately instead of this breakdown into the lag of the team and the lag of the first pilot from the second within the team? Perhaps this is so, but my personal observations show that it is much more reliable to look at the results of the team than at the results of each pilot. One pilot can make a mistake, or fly off the track, or he will have technical problems - all this will bring chaos to the model, unless you manually track each force majeure situation, which takes too much time. The influence of force majeure on the team's results is much less.
But back to the point where we wanted to evaluate how well our chosen explanatory variables explain the change in function. This can be done using the coefficient of determination... It will demonstrate the extent to which the qualification results are explained by the results of internships and previous qualifications.
Since we built two regressions, we also have two coefficients of determination. The first regression is responsible for the level of the team at the stage, the second for the confrontation between the pilots of the same team. In the first case, the coefficient of determination is 0.82, that is, 82% of the results of qualifications are explained by the factors we have chosen, and another 18% - by some other factors that we did not take into account. This is a pretty good result. In the second case, the coefficient of determination was 0.13.
These metrics, in essence, mean that the model predicts team level reasonably well, but has trouble determining the gap between teammates. However, for the final goal, we do not need to know the gap, we just need to know which of the two pilots will be higher, and the model basically copes with this. In 62% of cases, the model ranked higher than the pilot who really was higher in the qualification.
At the same time, when assessing the strength of the team, the results of the last training were one and a half times more important than the results of the previous qualifications, but in intra-team duels it was the other way around. The trend manifested itself in both 2018 and 2019 data.
The final formula looks like this:
First pilot:
Second pilot:
Let me remind you that X1 is the lag in the third practice, and X2 is the average lag in the previous qualifications.
What do these numbers mean. They mean that the level of the team in the qualification is 60% determined by the results of the third practice and 40% - by the results of qualifications at the previous stages. Accordingly, the results of the third practice are one and a half times more significant factor than the results of previous qualifications.
Fans of Formula 1 probably know the answer to this question, but for the rest, you should comment on why I took the results of the third practice. There are three practices in Formula 1. However, it is in the latter of them that teams traditionally train qualifications. However, in cases where the third practice fails due to rain or other force majeure, I took the results of the second practice. As far as I remember, in 2019 there was only one such case - at the Japanese Grand Prix, when due to a typhoon the stage was held in a shortened format.
Also, someone probably noticed that the model uses the average lag in previous qualifications. But what about the first stage of the season? I used the lags from the previous year, but did not leave them as they are, but manually adjusted them based on common sense. For example, in 2019, Ferrari was on average 0.3 seconds faster than Red Bull. However, it seems that the Italian team will not have such an advantage this year, or maybe they will be completely behind. Therefore, for the first stage of the 2020 season, the Austrian Grand Prix, I manually brought the Red Bull closer to the Ferrari.
This way I got the lag of each pilot, ranked the pilots by the lag and got the final prediction for qualification. It is important to understand, however, that the first and second pilots are pure conventions. Returning to the example with Vettel and Leclair, at the Hungarian Grand Prix, the model considered Sebastian to be the first pilot, but at many other stages she preferred Leclair.
results
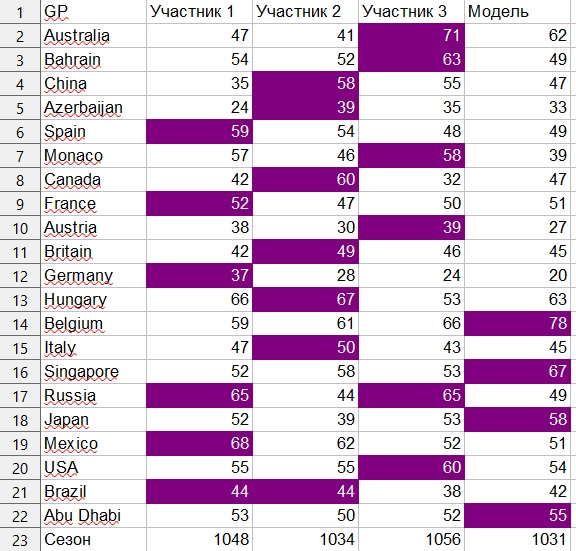
As I said, the task was to create a model that would make it possible to predict as well as people. As a basis, I took my forecasts and the forecasts of my teammates, which were created "by eye", but with a careful study of the results of the practices and joint discussion.
The rating system was as follows. Only the top ten pilots were taken into account. For an accurate hit, the forecast received 9 points, for a miss in 1 position 6 points, for a miss in 2 positions 4 points, for a miss in 3 positions 2 points and for a miss in 4 positions - 1 point. That is, if in the forecast the pilot is in 3rd place, and as a result he took pole position, then the forecast received 4 points.
With this system, the maximum number of points for 21 Grand Prix is 1890.
Human participants scored 1056, 1048 and 1034 points, respectively.
The model scored 1031 points, although with light manipulation of the coefficients, I also received 1045 and 1053 points.
Personally, I am pleased with the results, as this is my first experience in building regressions, and it led to quite acceptable results. Of course, I would like to improve them, because I am sure that with the help of building models, even as simple as this one, you can achieve better results than just evaluating the data "by eye". Within the framework of this model, it would be possible, for example, to take into account the factor that some teams are weak in practice, but “shoot” in qualifications. For example, there is an observation that Mercedes was often not the best team during training, but performed much better in qualifications. However, these human observations were not reflected in the model. So in the 2020 season, which starts in July (if nothing unexpected happens), I want to test this model in a competition against live forecasters and also find,how it can be made better.
In addition, I hope to resonate with the Formula 1 fan community and believe that through the exchange of ideas we can better understand what constitutes the results of qualifications and races, and this is ultimately the goal of any person who makes predictions.