Cisco StealthWatch is an information security analytic solution that provides comprehensive threat monitoring across a distributed network. StealthWatch is based on collecting NetFlow and IPFIX from routers, switches and other network devices. As a result, the network becomes a sensitive sensor and allows the administrator to look where traditional network security methods such as Next Generation Firewall cannot reach.
In previous articles I have already written about StealthWatch: first insight and capabilities , as well as deployment and configuration... Now I propose to move on and discuss how to deal with alarms and investigate security incidents that a solution generates. There will be 6 examples which I hope will give a good idea of the usefulness of the product.
First, it should be said that StealthWatch has some distribution of triggers for algorithms and feeds. The first are all sorts of alarms (notifications), when triggered, you can detect suspicious things on the network. The second are security incidents. This article will look at 4 examples of algorithm triggers and 2 examples of feeds.
1. Analysis of the most voluminous interactions within the network
The first step in configuring StealthWatch is to define hosts and networks by groups. In the web interface, the Configure> Host Group Management tab , separate the networks, hosts, servers into the appropriate groups. You can also create your own groups. By the way, the analysis of interactions between hosts in Cisco StealthWatch is quite convenient, since you can not only save search filters by streams, but also the results themselves.
First, in the web interface, go to the Analyze> Flow Search tab . Then the following parameters should be set:
- Search Type - Top Conversations (most popular interactions)
- Time Range - 24 hours (period of time, you can use another)
- Search Name - Top Conversations Inside-Inside (any friendly name)
- Subject — Host Groups → Inside Hosts ( — )
- Connection ( , )
- Peer — Host Groups → Inside Hosts ( — )
- Advanced Options , , ( , ). .
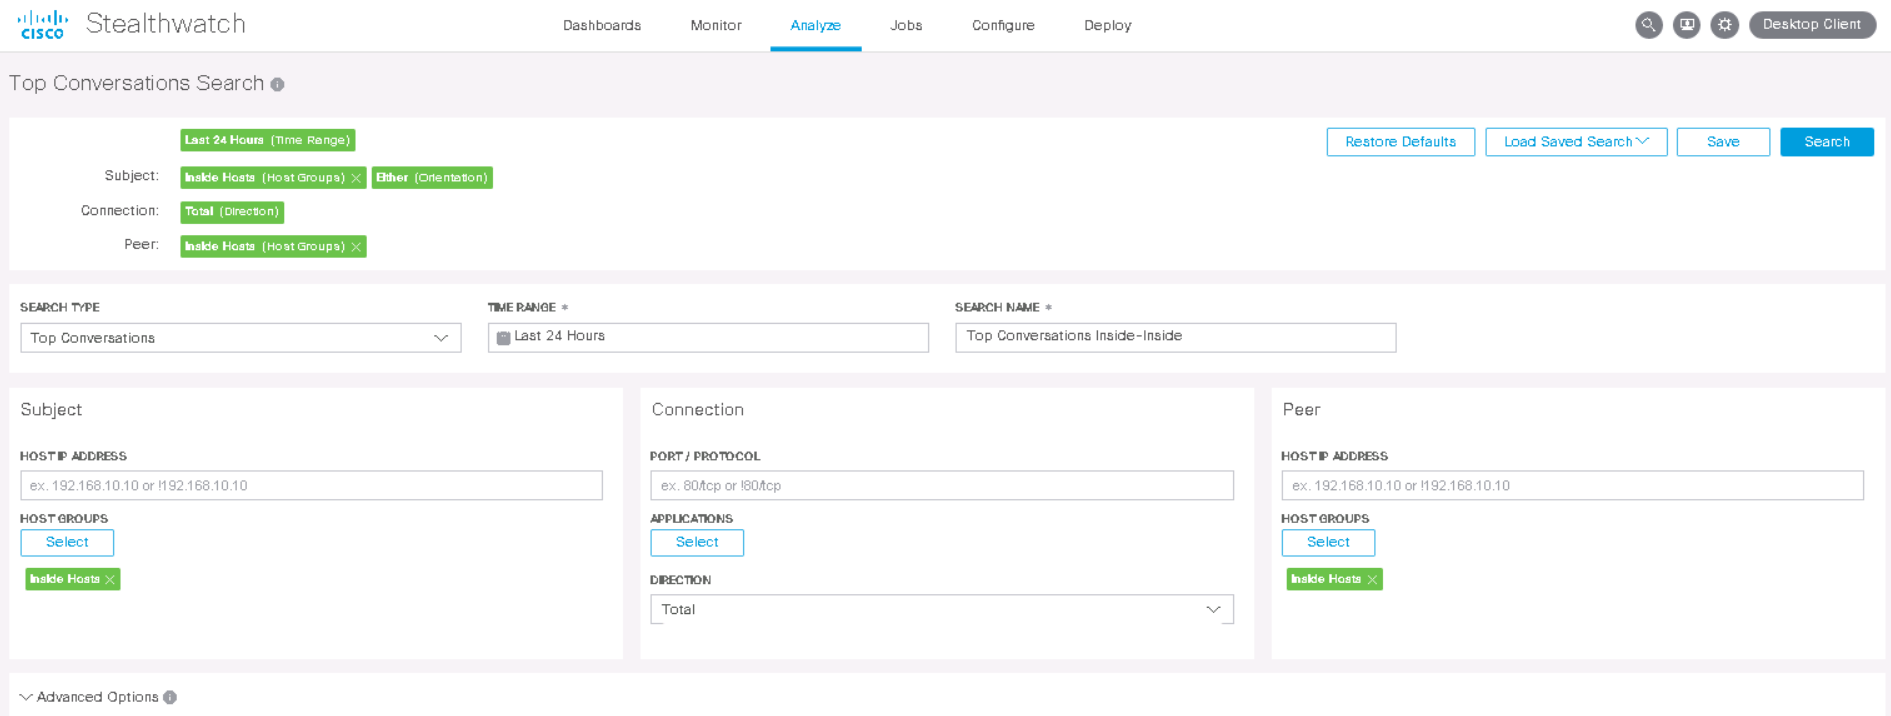
After clicking on the Search button, a list of interactions is displayed, which are already sorted by the amount of data transferred.
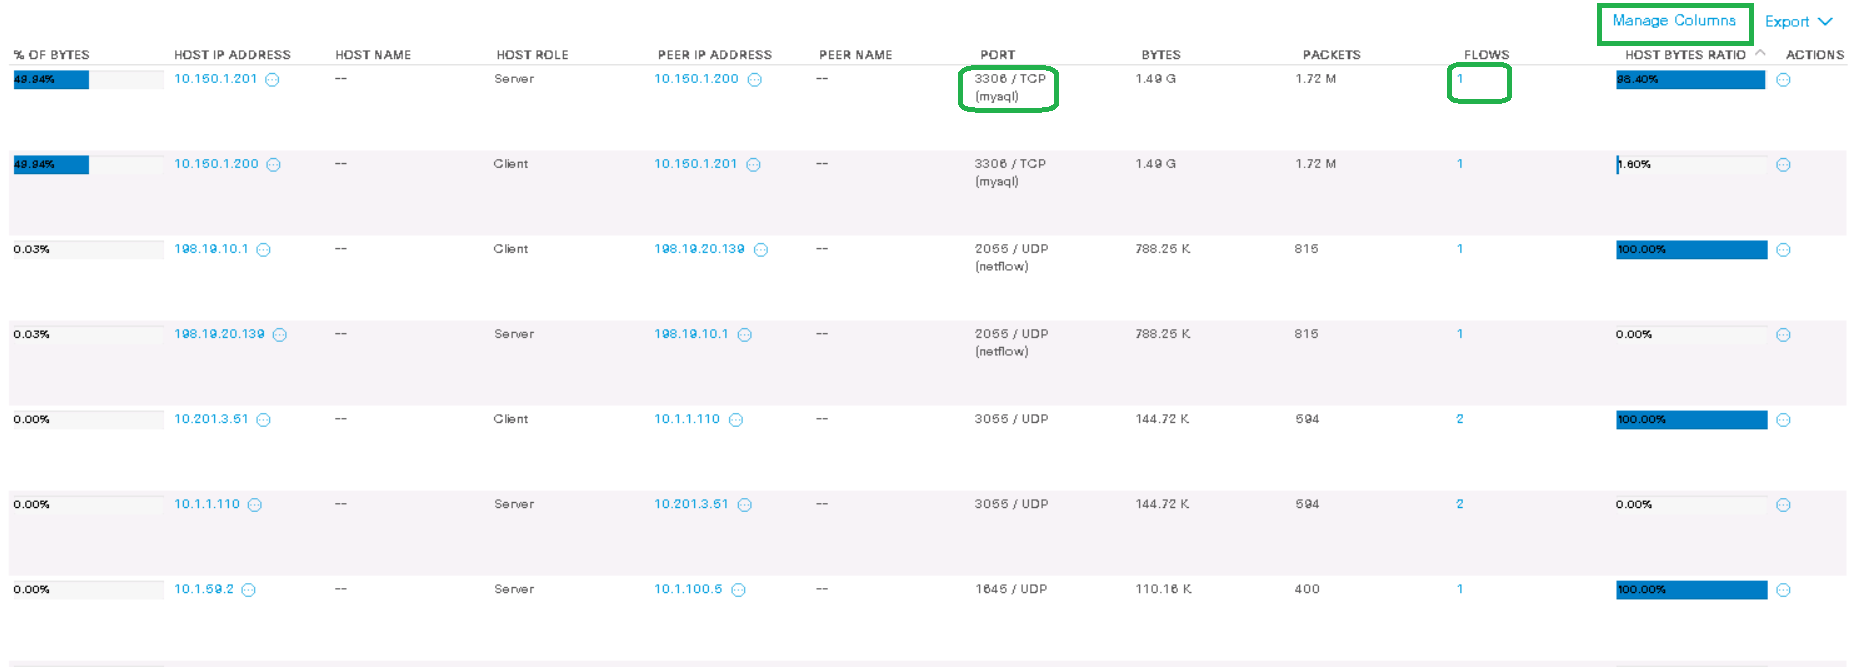
In my example, host 10.150.1.201 (server), within only one stream, transferred 1.5 GB of traffic to host 10.150.1.200 (client) using the mysql protocol . The Manage Columns button allows you to add more columns to the output.
Further, at the discretion of the administrator, you can create a custom rule that will be constantly triggered for this kind of interaction and notify via SNMP, email or Syslog.
2. Analysis of the slowest client-server interactions within the network for delays
SRT (Server Response Time) , RTT (Round Trip Time) tags allow you to find out server latency and overall network latency. This tool is especially useful when you need to quickly find the cause of user complaints about a slow application.
Note : almost all Netflow exporters cannot send SRT, RTT tags, therefore, in order to see such data on FlowSensor, you need to configure sending a copy of traffic from network devices. The FlowSensor in turn gives the extended IPFIX to the FlowCollector.
It is more convenient to carry out this analytics in the java application StealtWatch, which is installed on the administrator's computer.
Right click on Inside Hosts and go to the tabFlow Table .
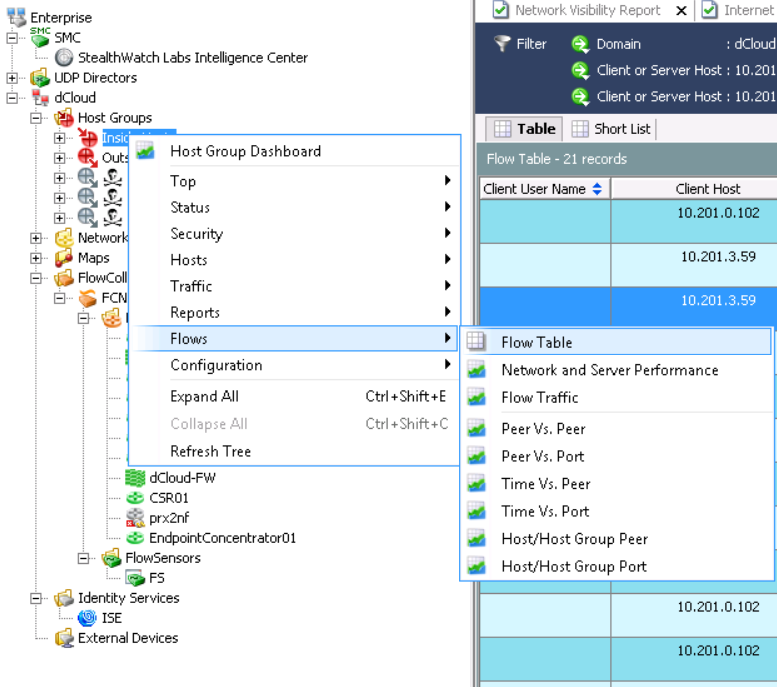
Click on Filter and set the required parameters. As an example:
- Date / Time - For the last 3 days
- Performance - Average Round Trip Time> = 50ms
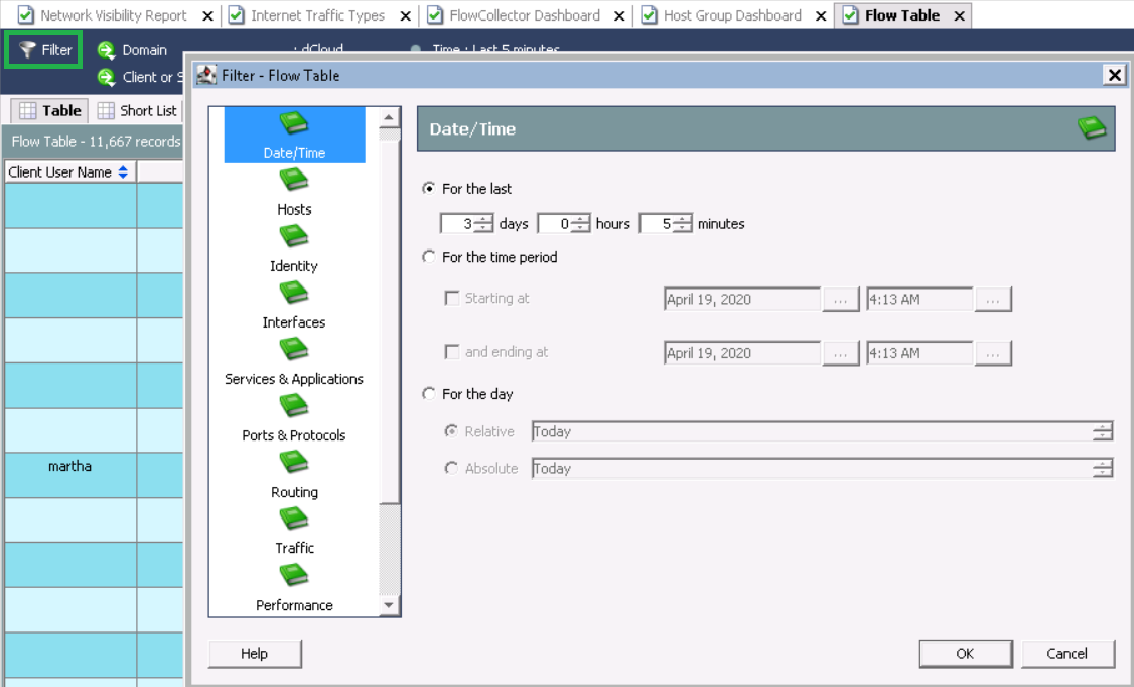
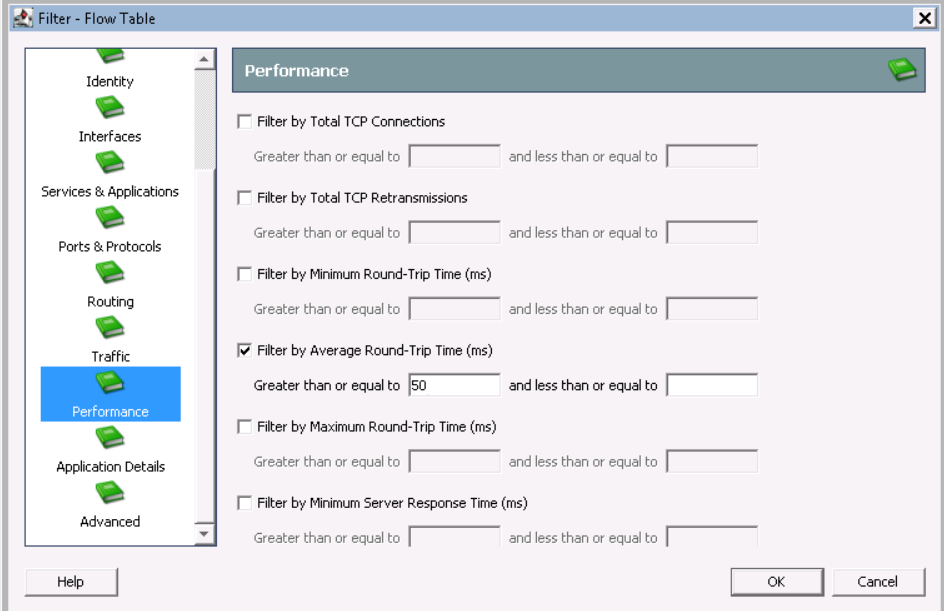
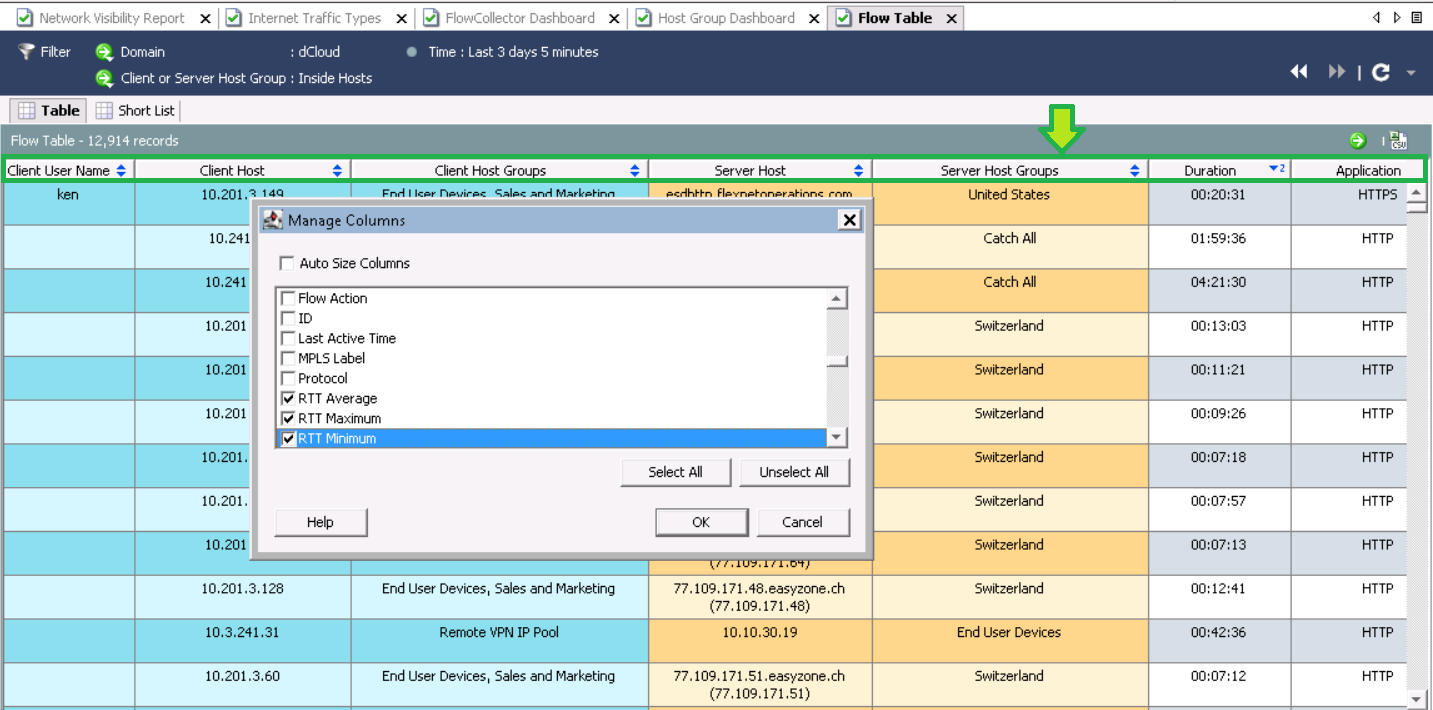
After displaying the data, add the fields of interest to us RTT, SRT. To do this, click on the column in the screenshot and right-click on Manage Columns . Then click RTT, SRT parameters.
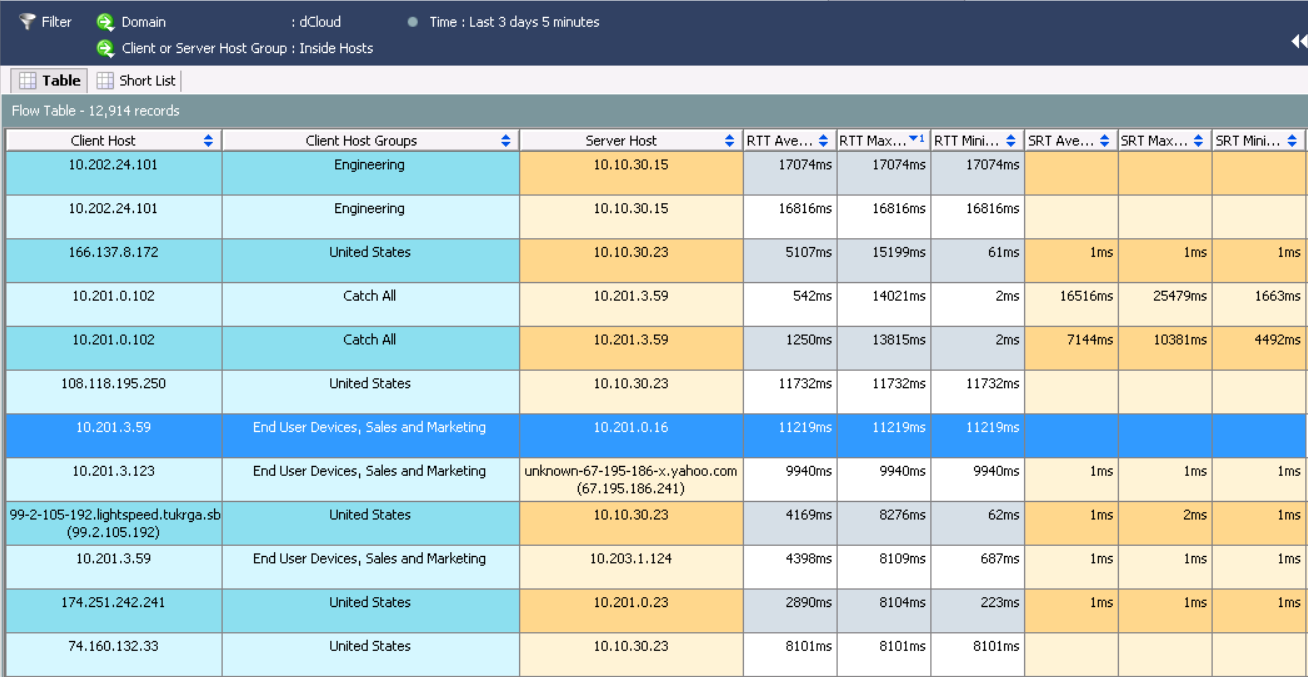
After processing the request, I sorted by RTT average and saw the slowest interactions.
To fall into detailed information, right-click on the flow and select Quick View for Flow .
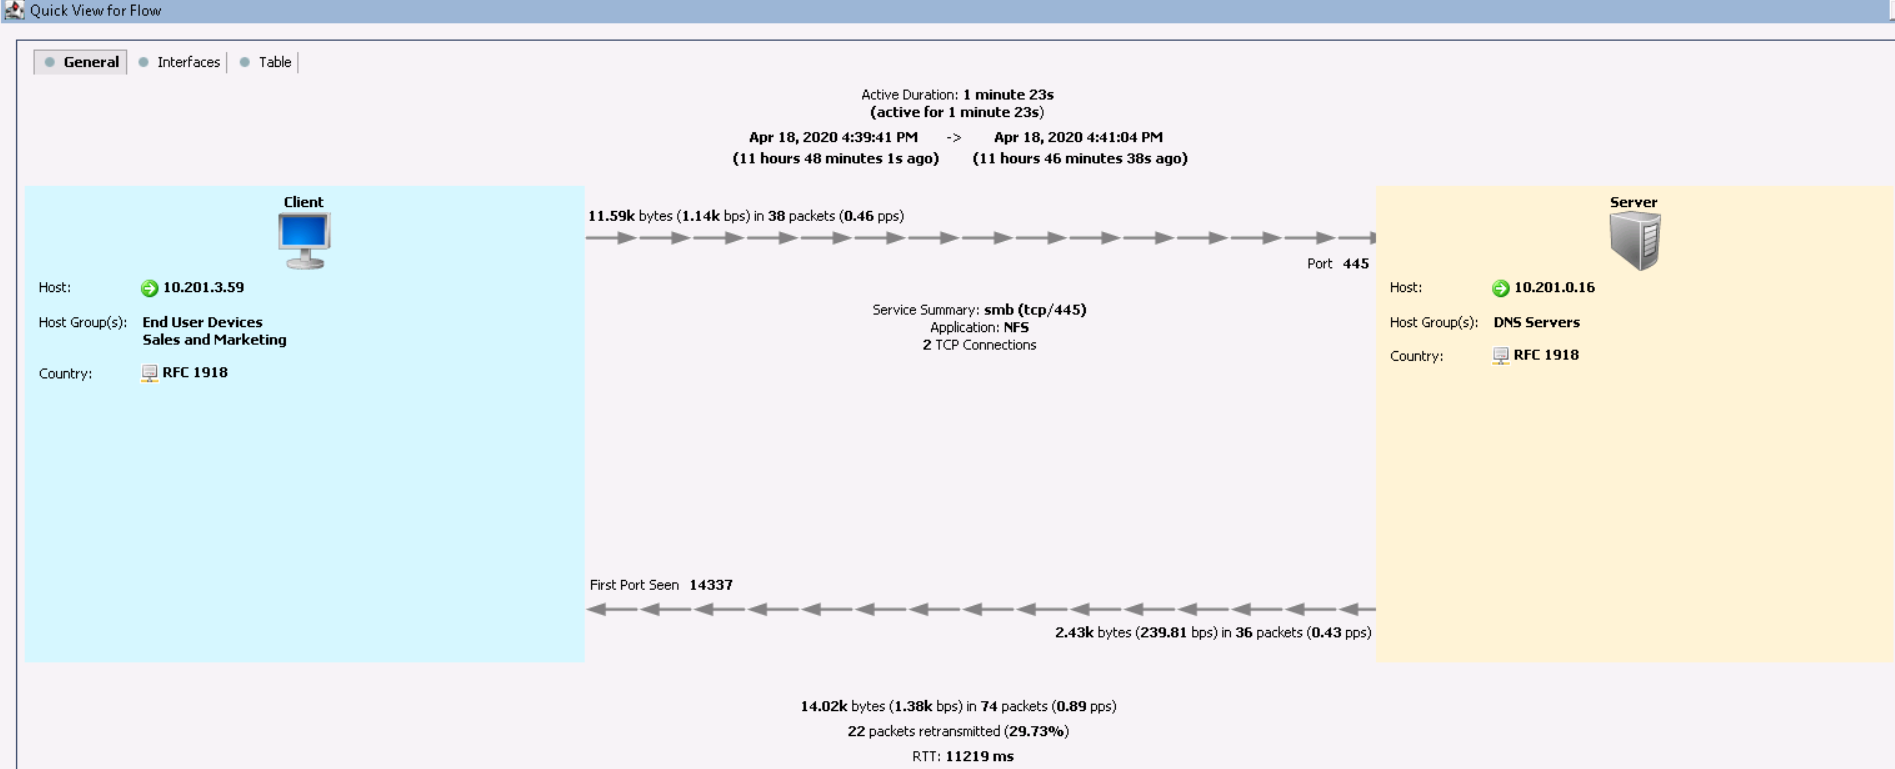
This information suggests that the host 10.201.3.59 from the group Sales and Marketing protocol NFS refers to a DNS server for one minute and 23 seconds and has a terrible delay. In the Interfaces tabyou can find out from which Netflow data exporter the information was received. The Table tab displays more detailed information about interactions.

Next, you need to find out which devices are sending traffic to FlowSensor and the problem most likely lies there.
Moreover, StealthWatch is unique in that it performs data deduplication (combines the same streams). Therefore, you can collect from almost all Netflow devices and not be afraid that there will be a lot of duplicate data. Quite the opposite, in this scheme it will help you understand which hop has the greatest delays.
3. Audit of cryptographic protocols HTTPS
ETA (Encrypted Traffic Analytics) is a technology developed by Cisco that detects malicious connections in encrypted traffic without decrypting it. Moreover, this technology allows you to “parse” HTTPS into TLS versions and cryptographic protocols that are used for connections. This functionality is especially useful when you need to detect network nodes that use weak crypto standards.
Note : you must first install the network app on StealthWatch - ETA Cryptographic Audit .
Go to the Dashboards tab → ETA Cryptographic Audit and select the host group that you plan to analyze. For the big picture, let's choose Inside Hosts .
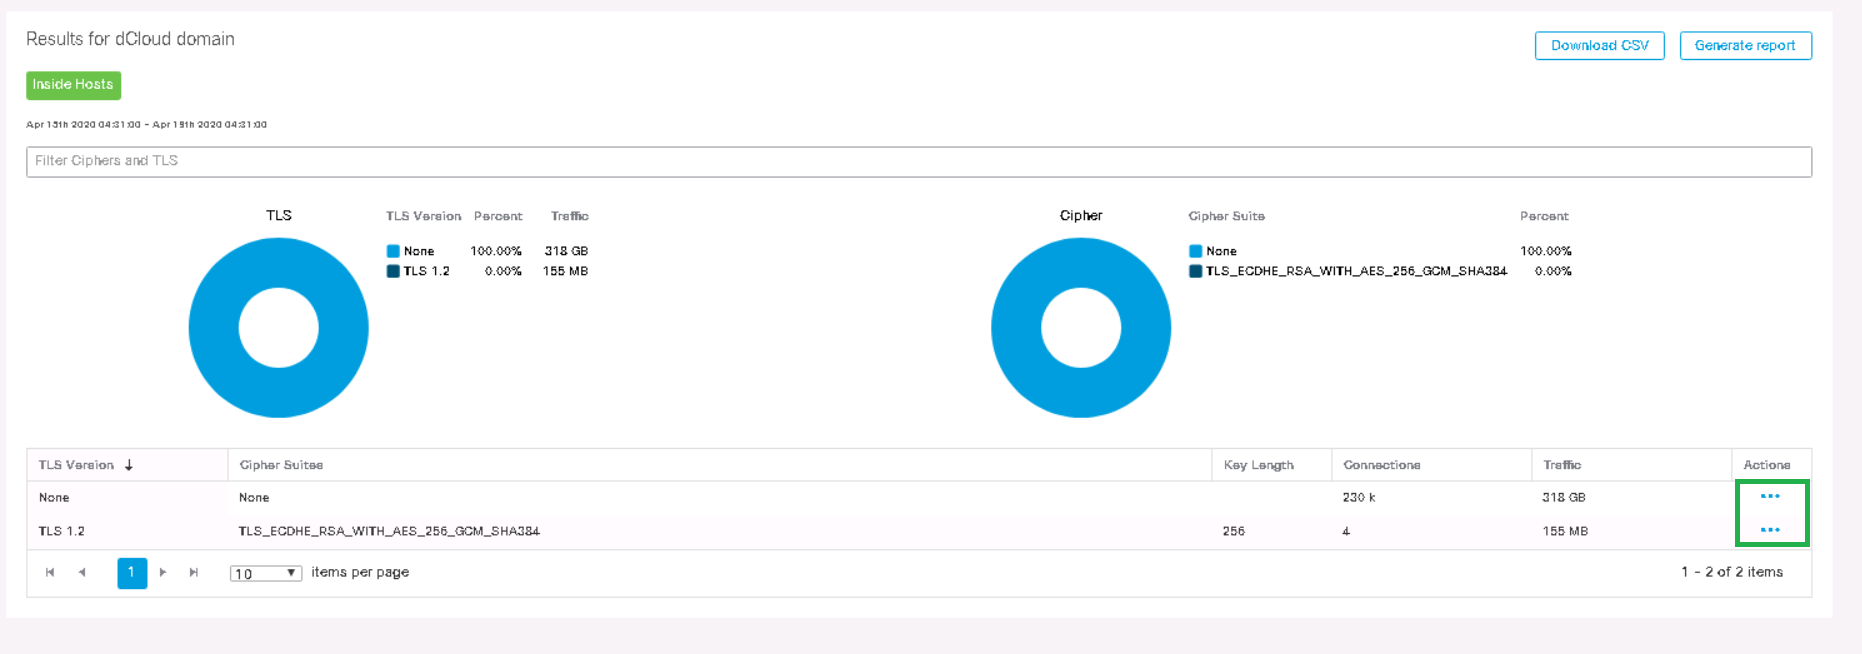
You can observe that the TLS version and the corresponding crypto standard are displayed. Following the usual scheme in the Actions column, go to View Flows and start a search in a new tab.


The output shows that host 198.19.20.136 has been using HTTPS with TLS 1.2 for 12 hours , where the encryption algorithm is AES-256 and the hash function is SHA-384 . Thus, ETA allows you to find weak algorithms in the network.
4. Analysis of network anomalies
Cisco StealthWatch is able to recognize traffic anomalies in the network using three tools: Core Events (security events), Relationship Events (events of interactions between segments, nodes of the network) and behavioral analysis .
Behavioral analysis, in turn, allows you to build a model of behavior over time for a particular host or group of hosts. The more traffic goes through StealthWatch, the more accurate the triggers will be thanks to this analysis. At first, the system triggers a lot of incorrect triggers, so the rules should be “twisted” by hand. I recommend not paying attention to such events for the first few weeks, since the system will adjust itself, or add it to exceptions.
Below is an example of a preset ruleAnomaly , which says that the event will fire without an alarm if a host in the Inside Hosts group interacts with the Inside Hosts group and traffic exceeds 10 megabytes in 24 hours .

For example, take a Data Hoarding alarm , which means that some source / destination host has downloaded / downloaded an abnormally large amount of data from a host group or host. We click on the event and fall into the table, where the triggering hosts are indicated. Next, select the host of interest to us in the Data Hoarding column .
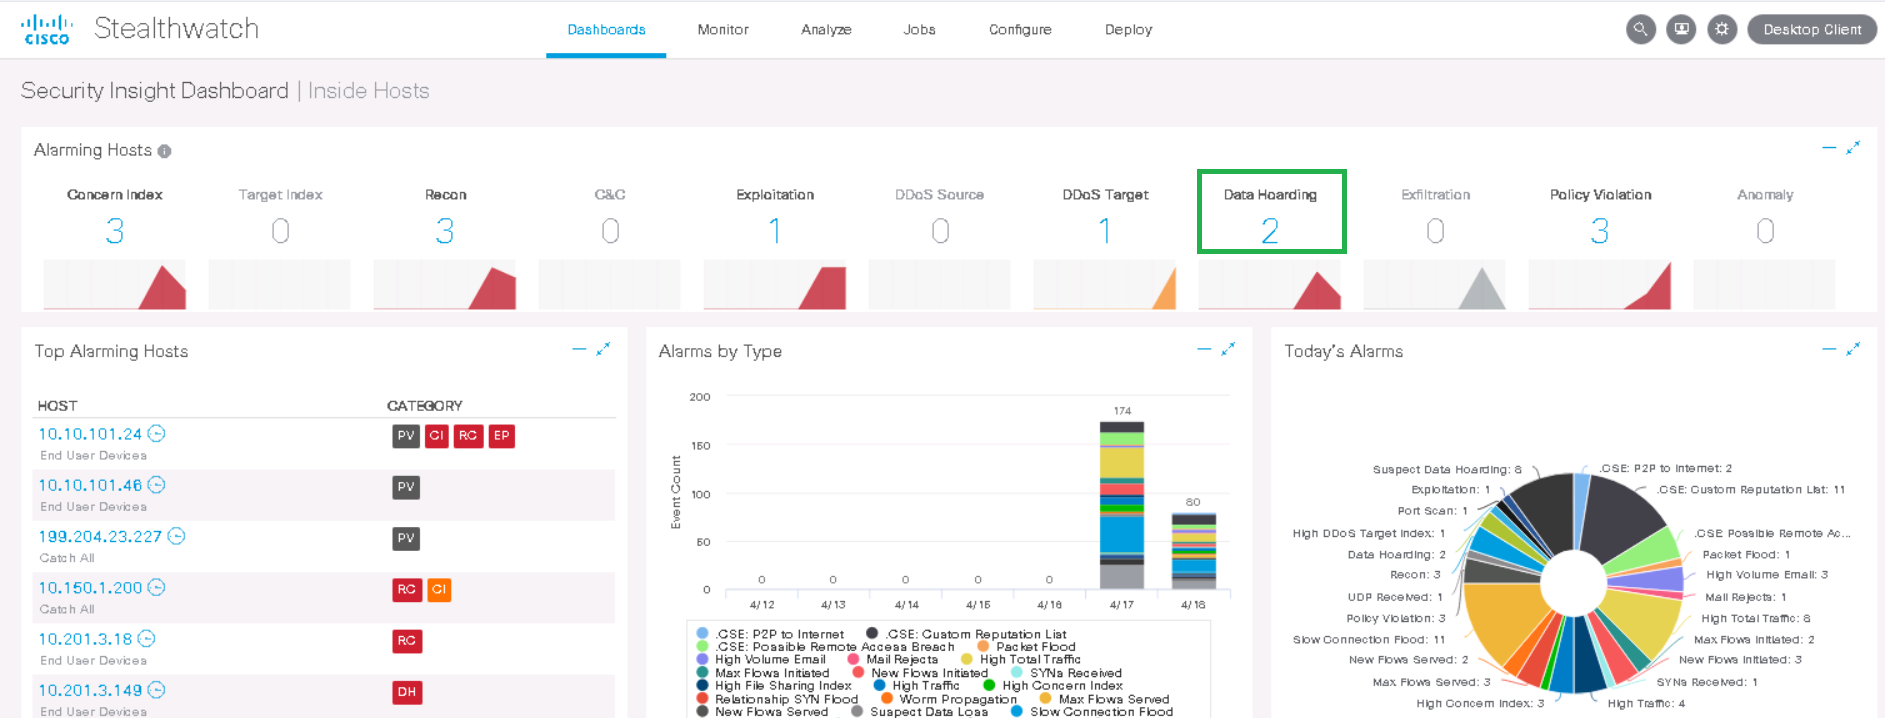

An event is displayed indicating that 162k "points" are found, and 100k "points" are allowed by the policy - these are internal StealthWatch metrics. In the Actions column, click View Flows .

We can observe that this host interacted at night with the host 10.201.3.47 from the Sales & Marketing department via the HTTPS protocol and downloaded 1.4 GB . Maybe this example is not entirely successful, but the detection of interactions for several hundred gigabytes is carried out in exactly the same way. Consequently, further investigation of the anomalies could lead to interesting results.

Note : In the SMC web interface, the data in the Dashboards tabs is displayed only for the last week and in the Monitor tabin the last 2 weeks. To analyze older events and generate reports, you need to work with the java console on the administrator's computer.
5. Finding internal network scans
Now let's look at some examples of feeds - information security incidents. This functionality is more interesting for security professionals.
There are several preset types of scanning events in StealthWatch:
- Port Scan - the source scans multiple ports of the destination host.
- Addr tcp scan - the source scans the whole network over the same TCP port, changing the destination IP address. In this case, the source receives TCP Reset packets or does not receive any responses at all.
- Addr udp scan - the source scans the whole network on the same UDP port, while changing the destination IP address. At the same time, the source receives ICMP Port Unreachable packets or does not receive any responses at all.
- Ping Scan - the source sends ICMP requests to the whole network in order to find answers.
- Stealth Scan tp/udp — .
For a more convenient location of all internal scanners at once, there is a network app for StealthWatch - Visibility Assessment . Going to Dashboards → Visibility Assessment → Internal Network Scanners tab, you will see scan-related security incidents for the last 2 weeks.
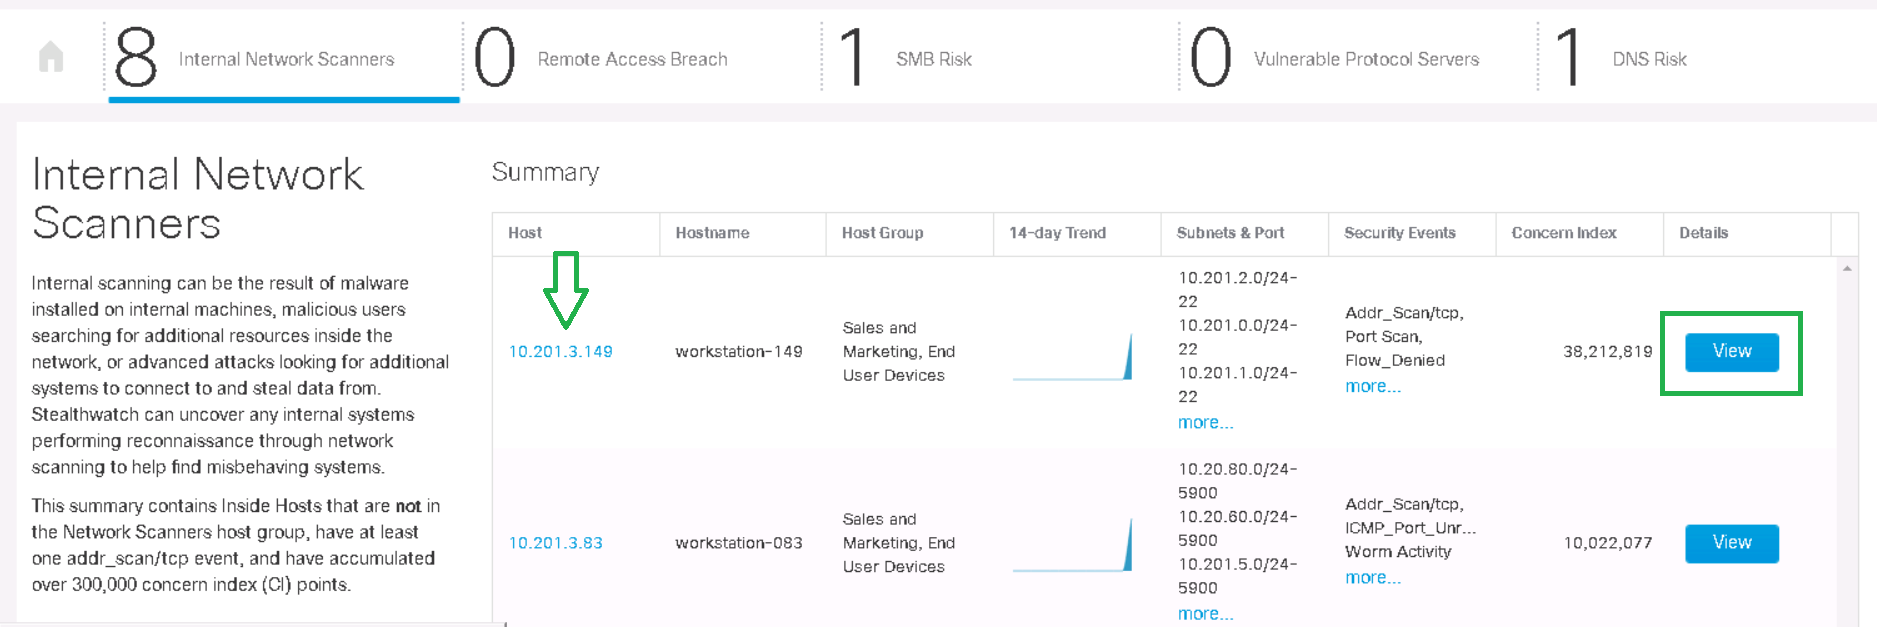
By clicking on the Details button , you will see the start of scanning for each network, the traffic trend and the corresponding alarms.
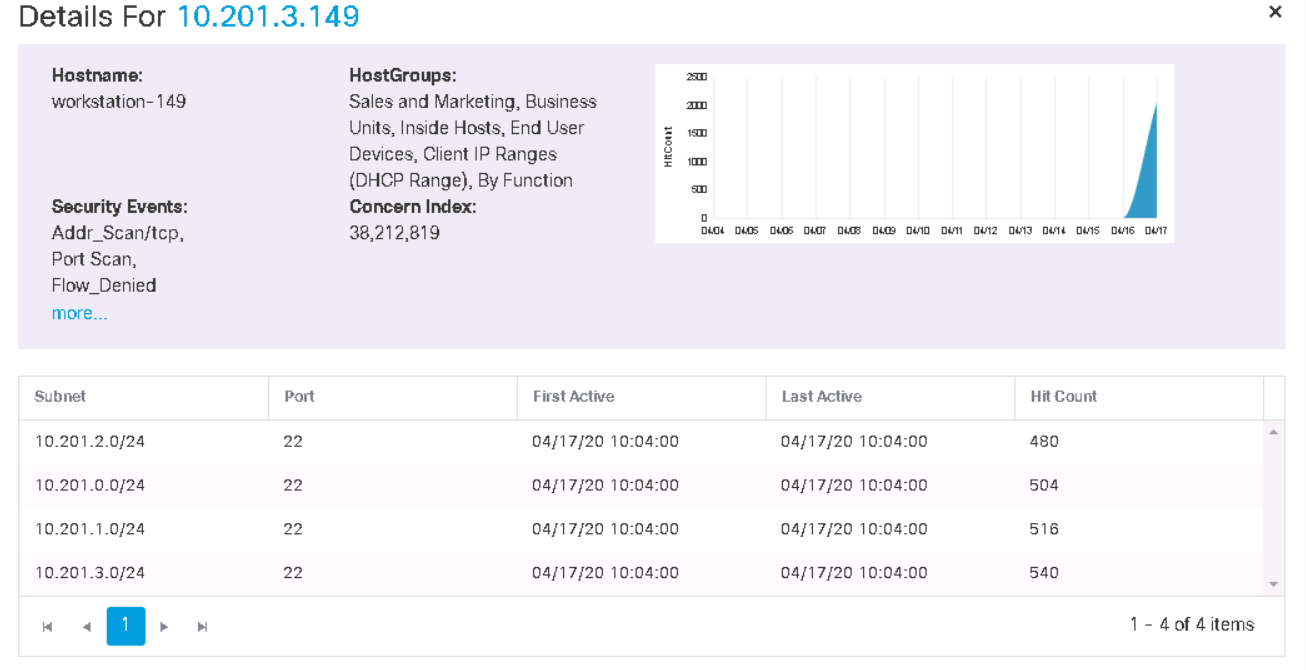
Then you can “fail” into the host from the tab in the previous screenshot and see security events, as well as activity for the last week for this host.
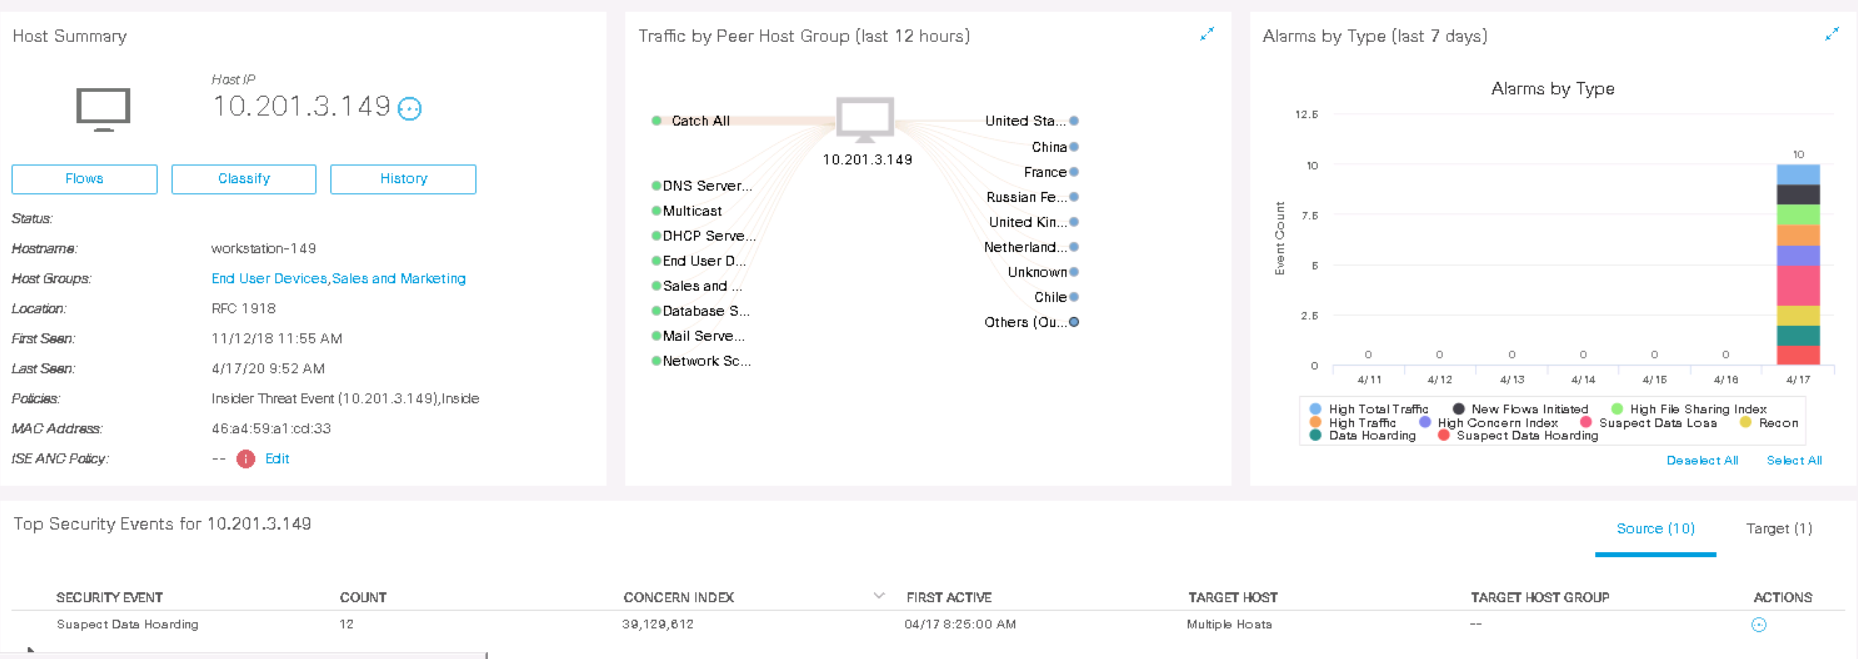

As an example, let's analyze the Port Scan event from host 10.201.3.149 to 10.201.0.72by clicking on Actions> Associated Flows . The stream search starts and the relevant information is displayed.
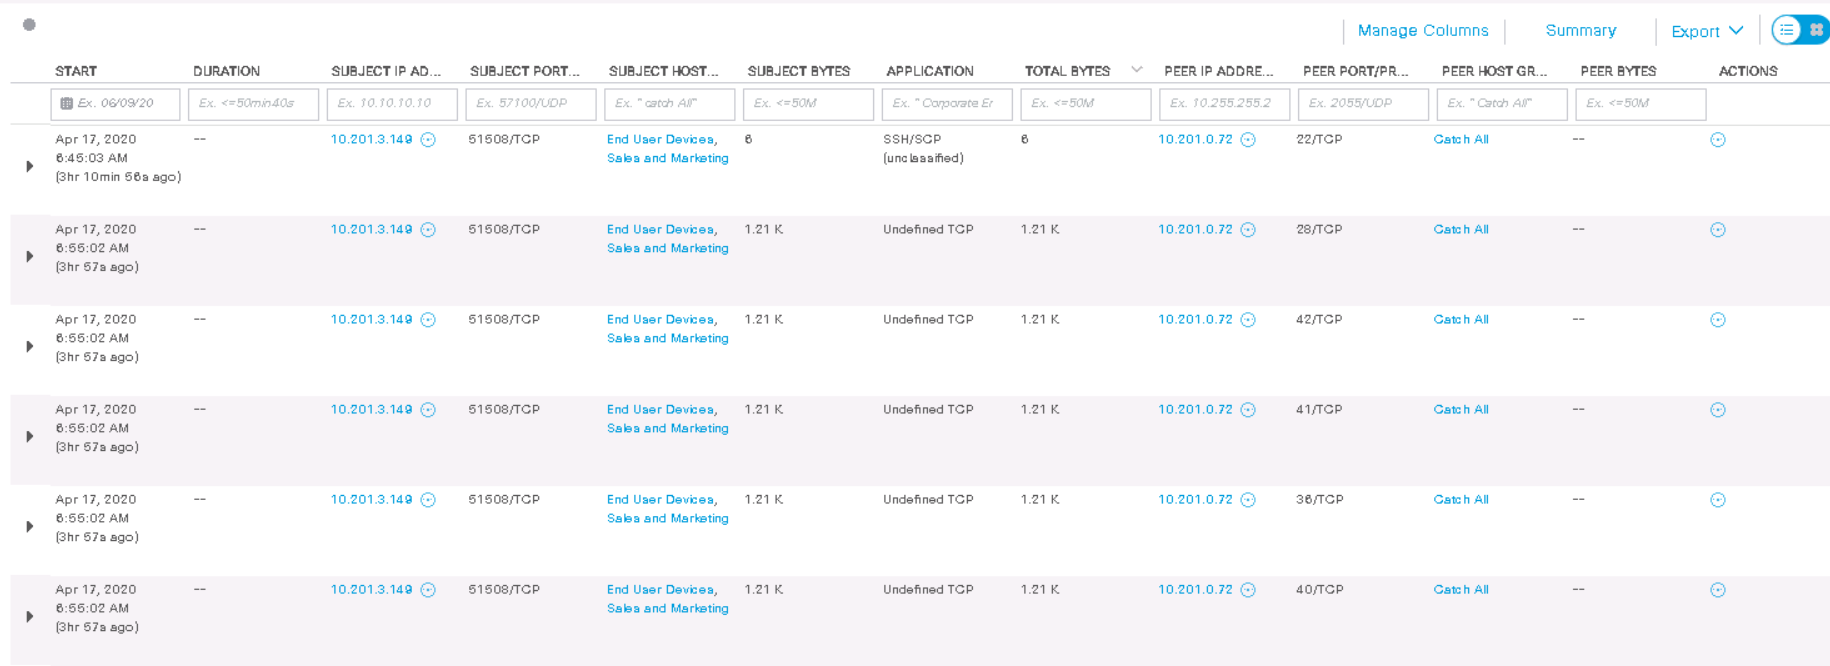
As we can see, this host from one of its port 51508 / TCP scanned the destination host 3 hours ago on ports 22, 28, 42, 41, 36, 40 (TCP) . Some fields do not display information either because not all Netflow fields are supported on the Netflow exporter.
6. Analysis of downloaded malware using CTA
CTA (Cognitive Threat Analytics) is a Cisco cloud analytics that integrates perfectly with Cisco StealthWatch and allows you to complement signatureless analysis with signature analysis. This makes it possible to detect Trojans, network worms, zero-day malware and other malware and spread it within the network. Also, the previously mentioned ETA technology allows analyzing such malicious communications in encrypted traffic.
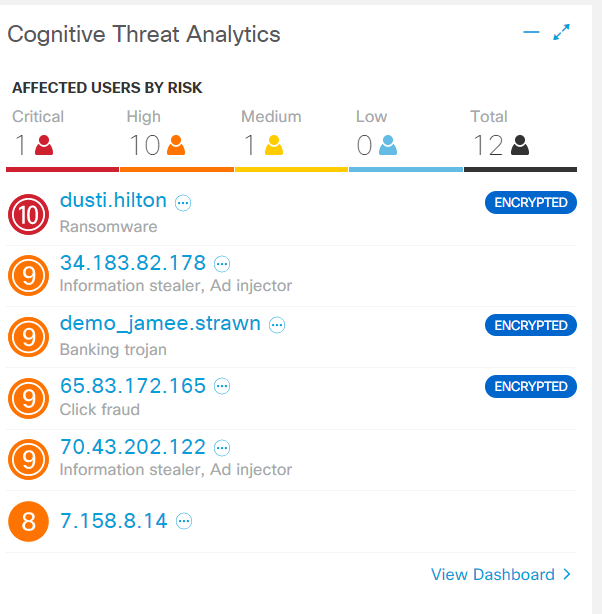
Literally on the very first tab in the web interface there is a special Cognitive Threat Analytics widget... The short summary tells about the detected threats on user hosts: Trojan, rogue software, annoying adware. The word “Encrypted” is exactly the evidence of the work of ETA. By clicking on a host, all information, security events, including CTA logs, drop out on it.
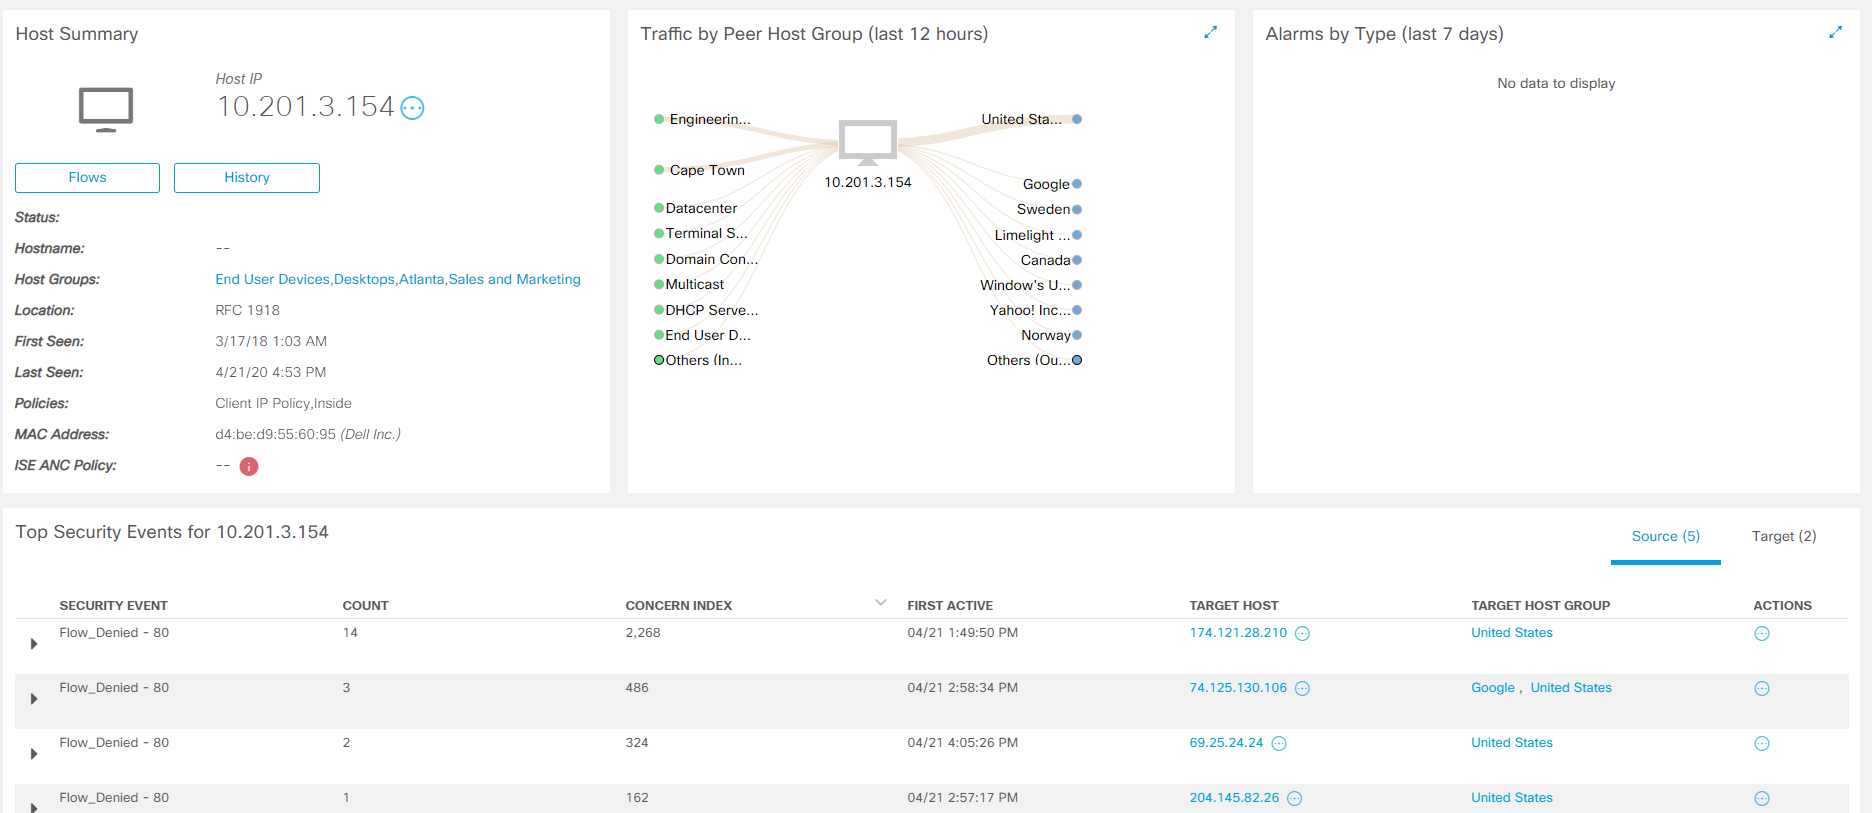
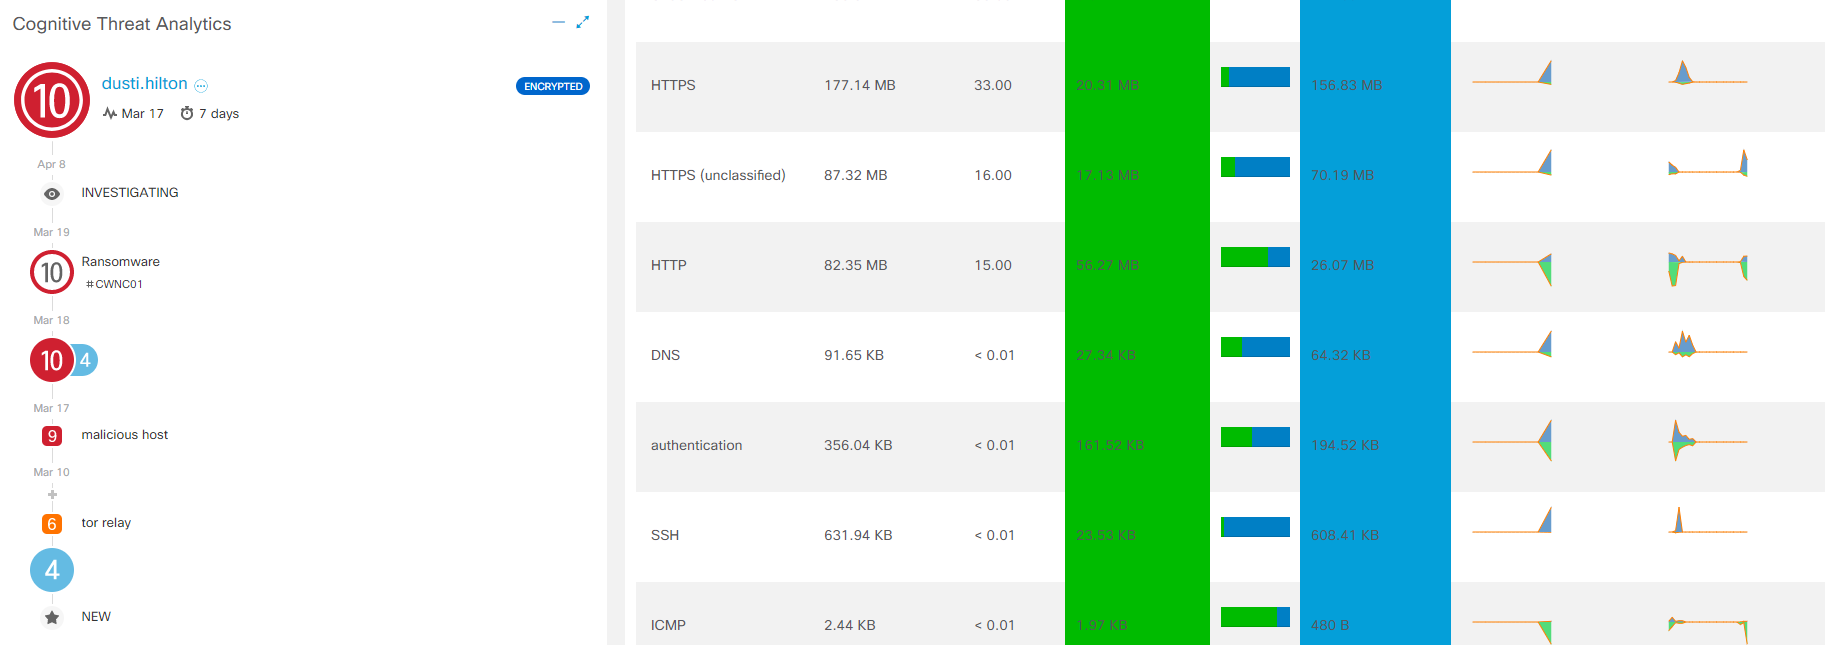
Aiming at each stage of the CTA, detailed information about the interaction is displayed. For full analytics, click View Incident Details , and you will be taken to a separate Cognitive Threat Analytics console .
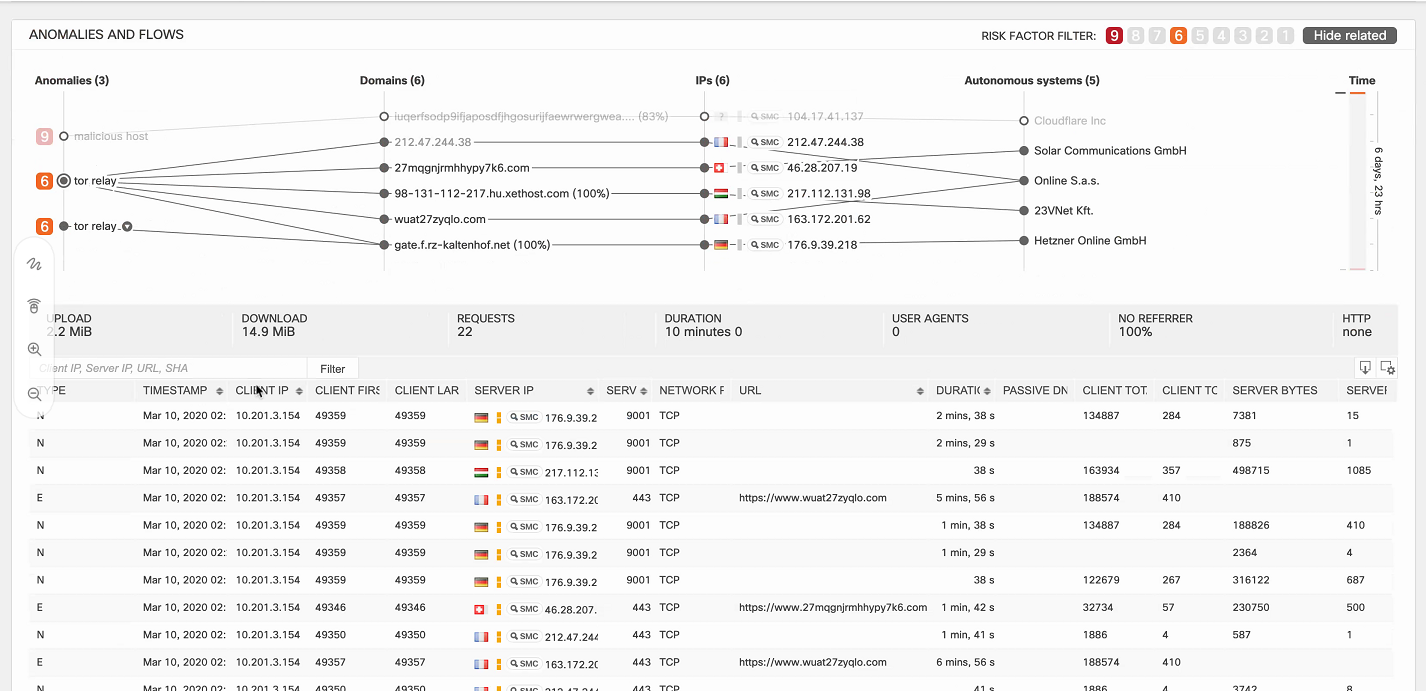
In the upper right corner, the filter allows you to display events by severity level. Pointing to a specific anomaly, logs appear at the bottom of the screen with the corresponding timeline on the right. Thus, the specialist of the information security department clearly understands which infected host, after which actions, began to perform which actions.
Below is another example - a banking Trojan that infected host 198.19.30.36 . This host began to interact with malicious domains, and the logs show information on the flows of these interactions.
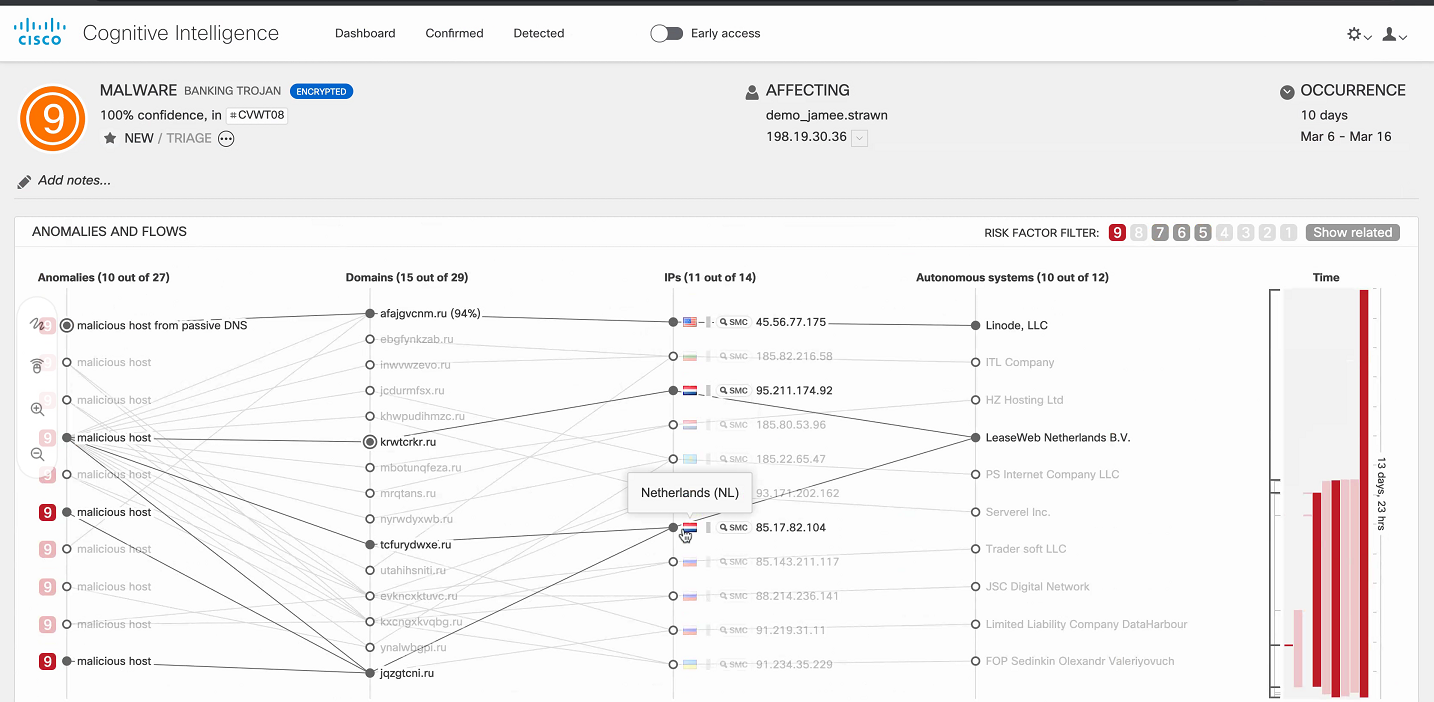
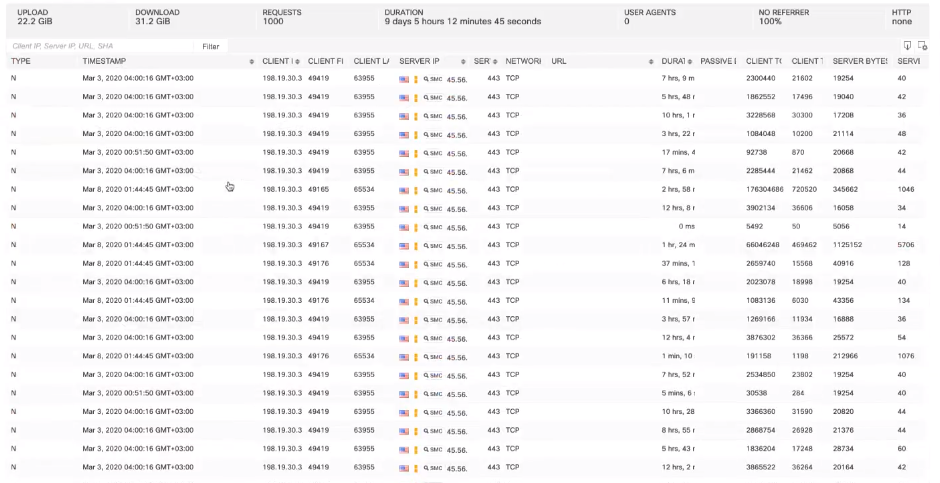
Next, one of the best solutions that could be is to quarantine the host thanks to the native integration with Cisco ISE for further treatment and analysis.
Conclusion
The Cisco StealthWatch solution is one of the leading network monitoring products in terms of both network analysis and information security. Thanks to it, you can detect illegal interactions within the network, application delays, the most active users, anomalies, malware, and APT. Moreover, you can find scans, penetration testers, conduct a crypto audit of HTTPS traffic. You can find even more use cases here .
If you have a desire to check how smoothly and efficiently everything is working in your network, send a request .
In the near future we are planning several more technical publications on various information security products. If you are interested in this topic, then stay tuned to our channels ( Telegram, Facebook , VK , TS Solution Blog )!