
It so happened that my activity is related to the creation of training complexes for personnel of hazardous industries. Since imitators develop in the context of multidirectional scientific vectors - computer graphics, engineering psychology (the study of physiological and psychological characteristics of a person, generalized independent characteristics, psychograms of personality and profession), ergonomics, cognitive science, computer science, etc.
I often hear the question about , why I prefer to work not with the "classic" grade (1-5) or (0-100), but with a whole set (knowledge-skills-skills), and I also use the degree of transfer of skills to the working conditions of the staff.
Why? There will be two answers - one simple, the other detailed.
Plain:
Imagine a situation that 2 people are trained - for example, an operator who is responsible for the operation of a whole complex of equipment and, for example, cleaning personnel.
According to the result of training, the operator gets "4+", and the cleaner gets "4". It can be concluded that the operator was trained better. If we speak only in terms of the "pedagogical scale" 1-5, then it is so.
Why is that bad?
It turns out that both are wrong somewhere? Moreover, the operator was mistaken by 0.5, and the cleaning lady by 1. And now let's ask the question - "what can the errors that stand behind this unit and 0.5 in real production lead to?" The cleaning lady will forget to put the sign "be careful, wet floor", someone with some probability will slip and with some probability will get injured ... Let's say.
And what about the operator, with some probability he will not be able (for example) to perform the correct actions in the event of an emergency, and with some probability the entire object, for example, will take off. What does his "lost" half of the unit hide?
It turns out 4+ for the operator "looks" worse than 4 or even 3 for the cleaning lady.
For this reason, I try never to use the classical rating scale when creating and operating simulators.
I have already written about risk management , and now I will try to walk through the assessment and control of the required level of personnel characteristics ...
In other words, I mean that any single assessment, even 0..5, even 0..100, cannot adequately reflect the readiness of personnel to work. And I show you how you can express “willingness” through the residual risk (in monetary terms, in the number of deaths, etc.).
Because instead of “the trainee got 4” to say “the current training of personnel is at the level of probable losses of 240000 rubles per year, which is at the level of“ acceptable risk ”, i.e. personnel may be allowed to work. ”
Basic assumption:
"The probability of each personnel error is equal to the probability of an error on the simulator (simulator), which is completely identical to the real system (the system reliably reproduces the real one)"

1. Work procedure
An algorithm is a finite set of rules that determines the sequence of operations for solving a specific set of problems and has five important features: finiteness, certainty, input, output, efficiency. (D. E. Knut)For any mastered profession, training goals can be distinguished, for example, personnel should be able to perform adjustment, adjustment of equipment characteristic of the profession being mastered.
An algorithm is a precise prescription that defines a computational process that goes from varying input data to the desired result. (A. Markov)
Achieving the goal presupposes the successful solution of a number of tasks (stages). Thus, the algorithm for performing work (regulations) can be represented as a set of ordered tasks, while the algorithm can be linear, or it can have a more complex structure (figure).

Picture. Linear and nonlinear algorithm (scheme for performing actions by personnel)
Assessment, formation and correction of ZUN (knowledge-skills-skills) of directly performing work implies, thus, the formation of ZUN for each task (element) that is included in the algorithm.
Each task, in turn, must be defined:
- input - set variable initial data;
- a finite set of rules that defines the sequence of operations;
- used equipment, tools and devices;
- the desired result (specified output);
- methodology for assessing effectiveness .
Next, we will try to "reveal" point # 5
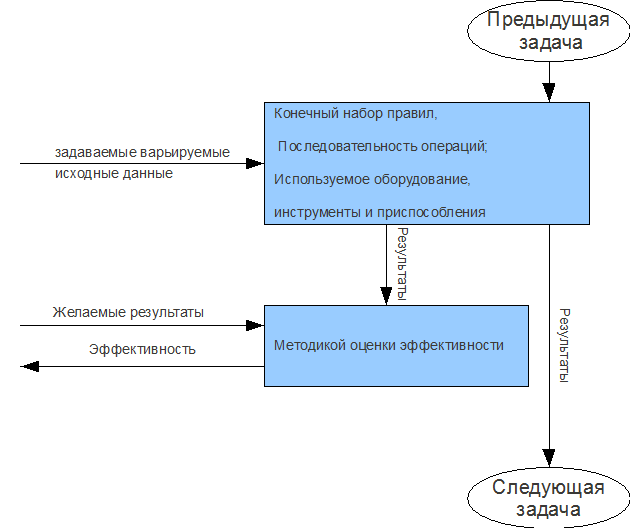
Figure. Scheme of the constituent element of the algorithm - the
Knowledge task :
- Device, purpose and principle of operation.
- main parameters and performance
- Parameter values (make-up torque, starting current, etc.)
- Safety regulations
- Arrangement of platforms, stairs for convenient and safe maintenance ...
- Lighting of objects, passages and places of service.
- Installation and commissioning, wiring diagrams, etc.
- Marking
- rules for the use of tools and measuring devices
- (, )
- , , .
- .
- .
- ( )
- .
- (, )
- ( , ).
- , .
- Filling out standard forms of charts, journals and reports
- etc.
Skills:
- practically (use knowledge) perform the task (with the required accuracy at a given time);
Skills:
- practically complete the task (with the required accuracy at a given time - during the entire work shift);
For example, the formation of ZUN algorithms for performing work - testing of centrifugal pumps (GOST 6134-2007. Dynamic pumps. Test methods) can be divided into the following tasks:
- running in the pump (unit)
- removal of pressure and energy characteristics
- rotation frequency;
- pump feed;
- pressure at the inlet and outlet of the pump or the difference between the specified pressures,
- temperature of the pumped liquid.
- dependence of the power consumption of the pump and its efficiency on the flow
- removal of the cavitation characteristic
- self-priming pump tests
- processing of test results
To implement these tasks, it is necessary to form the following knowledge among trainees:
1. Terms, definitions:
- destination indicators (flow, head, speed);
- efficiency and design indicators (suction head Δh (NPSH), coefficient of performance (COP), pump power, self-priming height, external leakage, weight)
- ergonomic indicators (vibration, noise)
- reliability indicators (mean time to failure, resource)
- characteristics (pressure, energy, cavitation, vibration, noise, self-priming)
2. Test conditions and principles:
- Conditions for determining indicators and characteristics
- Test conditions
- Testing on liquids other than pure cold water
- Tolerances for series production pumps with typical catalog curves
- Test facilities (stands) schemes
- Determination of errors
- Volume measurement method
- Measuring principle of pump head
3. The sequence of testing, presentation and presentation of results.
4. Determination of safety indicators:
- Electrical safety
- Thermal safety
- Mechanical safety
- Other harmful production factors (indicators)
For the formation of skills and abilities, practice is required, including the implementation of all the necessary tasks, i.e., the student must have experience in performing these actions. As a rule, each task is divided into a finite set of elementary operations - subtasks (open the suction valve, close the discharge valve, close the valves on the pressure gauges, check ...., Press the "START" button to turn on the pump, check for vibration and noise, by .. .., etc.)
In this case, for the formation of knowledge, you can use both text material, video films, 3D synthesized animation, and imitators. For the formation of skills, and especially skills, it is necessary to use imitators or real equipment. It is also possible to use them together (figure).
To assess ZUN, it is necessary to use the method of assessing the effectiveness of training
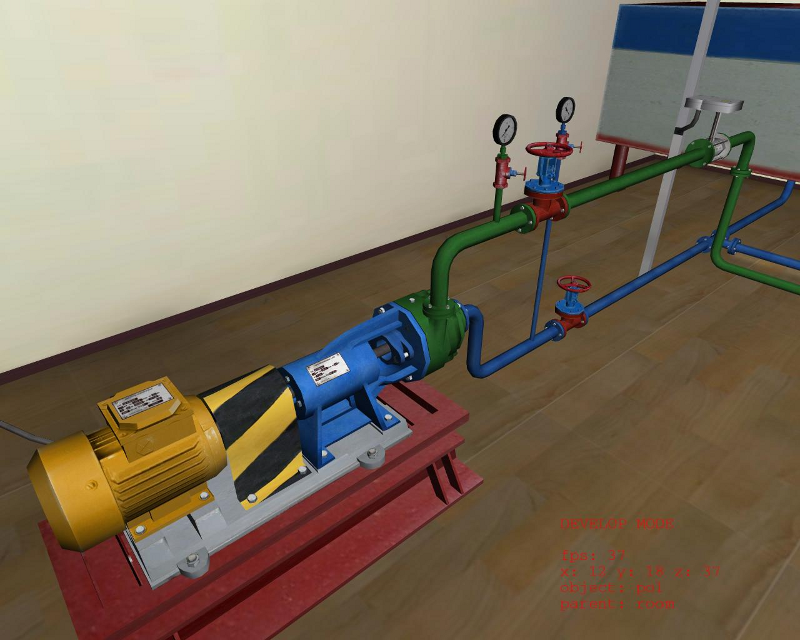
Figure Screen view of the "Testing centrifugal pumps" simulator

Figure. Photo of the real installation
Method (mechanism) for assessing the formation and transfer of knowledge, abilities and skills
Assessment of knowledge, skills and abilities formed as a result of training
Assessment and control of the required level of characteristics - knowledge can be assessed based on how much the student remembered (this can be easily measured, for example, using tests).
In the work of A.M. Novikov “Analysis of the quantitative patterns of the exercise process.
Methodical recommendations "the following data are given:" When teaching real systems, the following characteristics can act as a criterion for the level of learning: .. "
- ( , , , , , ..);
- ( , , . . , );
- ( (, ..), , , , ..);
- ( , , . .).

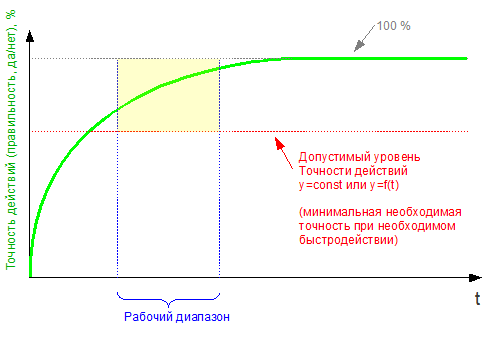
Picture. Assessment (measurement) of personnel knowledge (y = const)

Figure. Assessment (measurement) of personnel knowledge (y = f (t))
If the function (percentage of information recalled) within the operating range is above the permissible level, we can assume that the probability of a personnel error due to this reason is 0. Otherwise, i.e. That is, when a part of a function or a function is entirely below the acceptable level, within the operating range, then the probability of personnel error due to "knowledge" can be calculated as the ratio of the areas of functions above and below the acceptable level, within the operating range.

Functional areas above and below the permissible level (the difference or ratio of these areas actually sets the probability of personnel error due to "knowledge")

it is assumed, as indicated above, that “the probability of each personnel error is equal to the probability of an error on the simulator, which is completely identical to the real system (the system reliably reproduces the real one)”, ie (P = Pf). If we accept such a relationship between the level of characteristics (mismatch, error value) and the probability of personnel error (P = Pf), then P = 1- means 100% probability of an error, P = 0- means there is no possibility of error (0%), P = 0.5 corresponds to a 50% probability of personnel error. Otherwise (when knowledge, skills and abilities are not completely transferred to the real object, due to the differences between the simulator and the real system), the dependence can be given by the expression P = f (Pf).

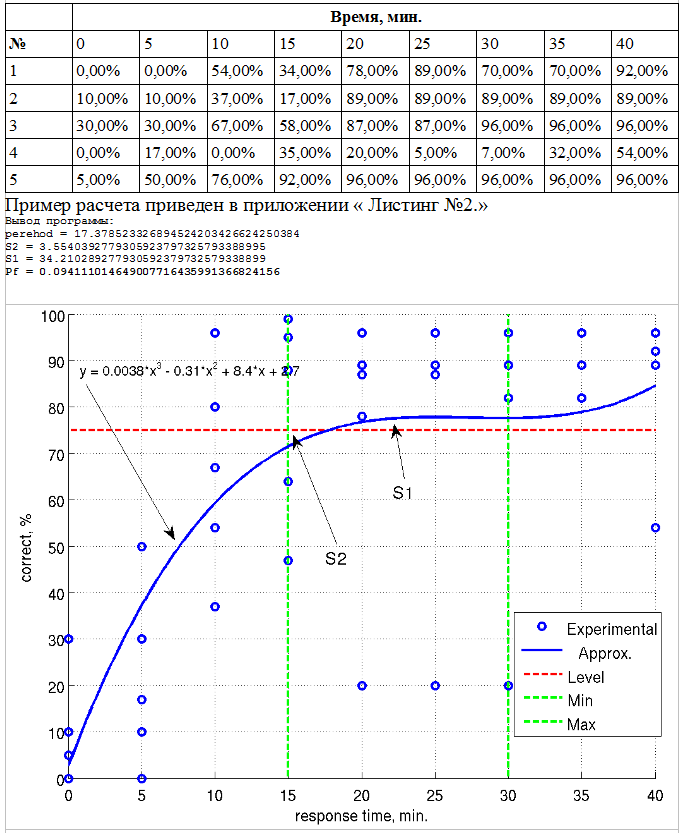
Evaluation and control of the required level of performance - skills can be assessed based on how accurately (correctly) personnel perform actions depending on the available time. This verification can be performed using simulators, by presenting various events to the trained / inspected personnel and measuring the time required to take action or react to the event. Another approach is also possible - present different situations and limit the allowed time for actions / reactions. The result of skill measurements will be a graph similar to the “knowledge” graph.
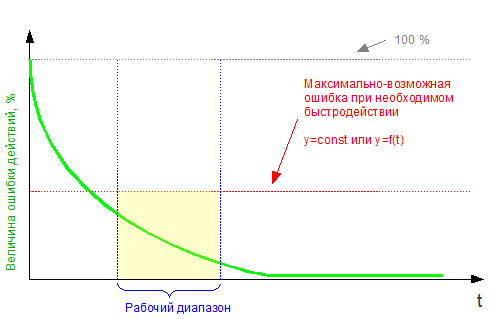
Picture. Graphical representation of the characteristics for skills and abilities as a function of correctness (top) or error ("mismatch") of the performed actions from the time spent
The relationship between personnel skills and the probability of personnel error due to "skills" can be determined using the areas of functions above and below the permissible level within the operating range (the difference or ratio of these areas actually sets the probability of personnel error due to the “skills”, see the figure).
For example, when balancing a pumping unit (pumping unit) in the amount of 5 pieces, it is possible to measure how accurately (correctly) the personnel performs the actions (the quality of balancing) depending on the time spent. In this case, along the Y-axis, the values of% compliance of the current “balancing” level with the accepted norm are plotted.
Assessing and Monitoring Required Performance Level - Skills can be assessed using an approach similar to skill assessment, with the additional consideration of the ability to maintain the required skill level over time in different settings.
The algorithm for assessing the level of skills is performed as follows: the time interval for a shift of an employee is divided into several intervals, for example 10. Using the simulator, the accuracy of personnel actions is measured depending on the time spent and for each interval is calculated (the probability of personnel error). The data obtained is then presented in the form of a graph of magnitude - the ability to maintain a performance level over time.
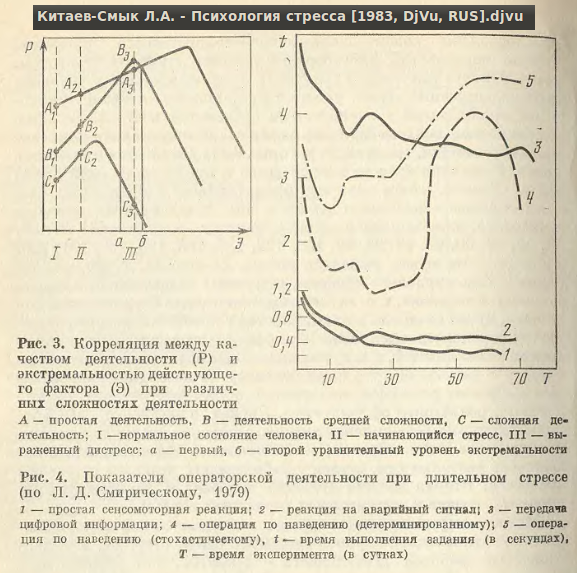
When assessing skills, it is also necessary to take into account the ability of the trained or certified personnel to maintain the level of performance over time (for example, during the work shift, with increasing fatigue, decreased attention, etc.) under moderate load (normal conditions), low load (relaxed state) and high load. In the process of labor activity, the personnel goes through three main states, replacing each other: the phase of training, or increasing efficiency; phase of high stability of performance; phase of decreased performance (fatigue).
Assessment of the ability of personnel to maintain the level of performance over time is necessary, since the efficiency of a person's work largely depends on the current load and to a large extent on the developed "automatism", that is, skills. For example, the following graph shows performance levels over time for normal operating conditions (green line) and when an alarm occurs / simulates (stress) (blue line).

Changes in the probability of personnel error during the work shift under different conditions. (skill values during a work shift)
In the afternoon (according to the experience of Tallinn taxi drivers), the most dangerous period is 11 - 15 o'clock. I agree with the data of Swedish scientists who studied the connection between erroneous actions of workers and daily rhythms, it is during these hours that workers have the most mistakes. And the Slovak scientist J. Kuruc, who cites these data, notes that during these hours of the daytime, drivers have the greatest number of cases of falling asleep while driving. At night, from this point of view, the hours from midnight to 5 am are more dangerous.
Such graphs can be used to assess the "readiness" of a person for a given activity, as well as to obtain the strengths and weaknesses of personnel.
The relationship between personnel skills and the probability of personnel error due to "skills" can be defined as the maximum value of the probability throughout the entire work shift.
Assessment of the transfer of skills achieved during training to real working conditions
Knowledge of the general principles of stereotype transfer is to one degree or another necessary both in the development of training programs and in assessing their effectiveness.
Skill transfer
After learning to track with your right hand, try doing the same with your left hand - this is one example of stereotype transfer. To a certain extent, any training is associated with the transfer of a stereotype, since the acquisition of a new skill is never completely independent of other activities that precede it. For most training programs, the issue of stereotype transfer is very important, since, except for the case when training is conducted directly in the workplace, the value of the training program will depend on what part of the skills taught will be transferred to real work conditions. So, for example, it was shown that for piloting a helicopter at low altitudes, only 15 hours of specialized navigation training gives the same amount as about 2 thousand hours of general flight practice - the result,fully justifying the time spent on training. Knowledge of the general principles of stereotype transfer is to one degree or another necessary both in the development of training programs and in assessing their effectiveness.
If, when mastering task A, the grades obtained for another task B improve in comparison with the assessments of the control group, which studied only task B, then the transfer from A to B is positive. Task A may consist, for example, of tracking the rotation of the disc with one hand, and task B in tracking with the other hand. Sometimes it happens that mastering task A makes it difficult to master task B, and in this case they speak of negative transference. In more complex cases, the so-called retroactive effects can be observed, which arise when A is first mastered, then B, after which a second test is performed on A. If such an insertion of a task B improved the performance of A, then there is a retroactive amplification; if insertion B worsened the performance for A, then retroactive interference (or retroactive inhibition) occurred.
The more similar tasks A and B are, the more they influence each other. Whether the transference is positive or negative in this case depends on how the characteristics of both tasks, such as showing and control, or stimulus and reaction, are related. Osgood's three-dimensional surface [47] is an attempt to summarize the results of early work on the relationship between transfer and retroaction. If both the presented stimuli and the required response in both tasks are so similar that they are practically indistinguishable, then the transference will obviously be maximum. In all respects, items A and B are variants of the same item, so learning A is equivalent to learning B.
Other cases contained in table. 9.5 can be illustrated with an example taken from the shoe industry. Let task A be to make a seam on the boot, consisting of individual stitches (stimulus), by repeatedly pressing the pedal with the required force (reaction), and task B, to light a series of neon lamps (stimulus) by repeating pressing the telegraph key (reaction). Under these conditions, both stimulus and response are different for both tasks, and therefore there is no stereotype transfer [56]. However, if you ask a previously trained group of shoemakers to light a series of neon lamps by pressing a conventional foot pedal, the response in both tasks will be the same, although the stimuli are different.
Therefore, a positive transfer will occur; experienced shoemakers are better at performing task B in this variant than untrained persons.

The last of the relationship options presented in the table is more difficult to analyze, and Osgood's surface describes it inaccurately. In our example, demanding a different response to the same stimuli means asking the shoemakers to sew stitches by pressing the telegraph key. Such a procedure can result in negative carryover. In a new situation, other things being equal, a person usually tends to do the same as in the old one. If conditions have changed, but the change is not entirely clear, an old reaction that does not correspond to the new conditions may occur. In the example under consideration, experienced sewing machine operators, instead of a series of light clicks on the telegraph key, can sometimes try to press on it for a long time and with great effort. But it is also possible that, in spite of individual errors, experienced operators in general will show better results,than the untrained group, due to the common similarity of both tasks. The result will depend in part on how the points are awarded. In any case, it may turn out that as you further master the task B, the initially negative transfer will be replaced by a positive one, since errors will become less and less frequent.It is important to prevent negative transfer from a training device, such as a simulator, to real working conditions, but, unfortunately it is not easy to predict when negative carryover will occur. However, from work [25], where an attempt was made to predict intrusive errors using a three-dimensional surface linking the similarity of stimuli and reactions with the expected characteristics of transference, it follows that as the degree of similarity of reactions increases, the interference between the two tasks increases.Whether these occasional errors are material depends on the nature of the engagement. When sewing shoes, an accidental error due to negative carryover may not be important, but when landing an airplane, such an error can lead to disaster. Such errors are most likely to occur in cases where the reactions required in tasks L and B are easily confused. Trainees are unlikely to confuse cycling with pouring coffee, even if the incentive for both is the green light. However, reactions such as raising and lowering the lever, turning the handwheel clockwise and counterclockwise are very easy to confuse.but when the plane lands, such a mistake can lead to disaster. Such errors are most likely to occur in cases where the reactions required in tasks L and B are easily confused. Trainees are unlikely to confuse cycling with pouring coffee, even if the incentive for both is the green light. However, reactions such as raising and lowering the lever, turning the handwheel clockwise and counterclockwise are very easy to confuse.but when the plane lands, such a mistake can lead to disaster. Such errors are most likely to occur in cases where the reactions required in tasks L and B are easily confused. Trainees are unlikely to confuse cycling with pouring coffee, even if the incentive for both is the green light. However, reactions such as raising and lowering the lever, turning the handwheel clockwise and counterclockwise are very easy to confuse.it is very easy to confuse.it is very easy to confuse.
Measurement of transference
The depth of transference of a stereotype to real conditions tends to increase with increasing training time. In some cases, training volume may be more important than the training method adopted. A study of training programs for car drivers showed that with 6 hours of practice, the depth of transfer of skills to real driving was higher than with 3 hours of practice, regardless of whether a movie or a car simulator was used for training. However, the transfer depth is not a linear function of the training time. With a further increase in this time, the return usually decreases, so to determine the effectiveness of training, it is necessary to constantly measure the transfer depth.
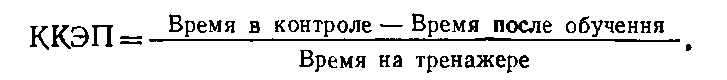
In the traditional method of measurement, the initial transfer to a new task is assessed by calculating the degree of improvement in indicators in those who have mastered task A, compared with those who have mastered only B. The difference in indicators of the transfer group and the control group (transfer minus control - for indicators characterizing the accuracy ; control minus transfer - for indicators characterizing the speed or error), usually related to the first attempt to complete task B, is presented as a fraction (percentage) of the total volume of potential learning. A typical formula is

However, the carryover may not remain constant as you study task B, so more flexible assessment methods may be required to monitor the effectiveness of learning.
Some sensitive measure of the value delivered over different training volumes is especially needed when using simulators, when the cost of training and the cost of fieldwork are usually high, but known and amenable to regulation. We do not discuss the simulators themselves, the degree of their proximity to real conditions and the corresponding transfer characteristics. However, the flight simulator can be a good example of mastering task A, the results of which should be transferred to a real flight - task B. A typical task is to determine how much training on the ground simulator should be before admitting newcomers to flying.
The most useful metrics are "savings" or "replacement rate". Transfer efficiency can be estimated by the number of DST hours saved by ground training in any given amount. In [49], differential and cumulative meters of such efficiency are proposed. If it takes 10 flight hours to achieve the required skills, and in the case of pilot simulator training for 1 hour, only 8.6 flight hours are needed, then the savings are 1.4 hours. Another hour on the simulator may provide slightly less savings - say, 1.2 hours, so the accumulated savings after 2 hours on the simulator will be 2.6 hours.Dividing this value by 2 (the number of training hours), we get the cumulative transfer efficiency factor (CECE) equal to 1.3 by hour of ground training.The corresponding formula can be written as follows:

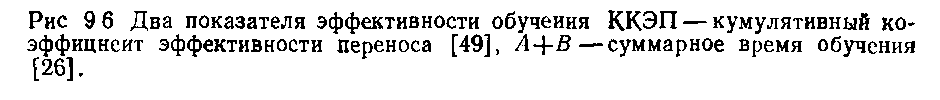
As Fig. the transfer efficiency, as measured by this indicator, usually decreases monotonically. With 5 hours of simulator training, 5 hours of flight time would still be required and the carryover ratio would drop to 1.0. It is clear that from the point of view of the total time spent on training a pilot, a further increase in training time does not make sense. If the criterion is cost, which is quite possible in the example under consideration, then it may be advisable to extend ground training. For example, if 1 hour of flight time costs three times as much as 1 hour on a simulator, then it is beneficial to continue ground training until the efficiency factor drops to 0.33. 15 hours of training time plus 5 hours of flight time will cost the same as 10 hours of flight time. Obviouslyin this case, you just need to express the transfer efficiency factor in terms of cost, not training time. There are also more sophisticated ways to maximize cost efficiency based on differential calculus methods.
An easier way to assess the effectiveness of training is also shown in Fig. In the "L + B" method, the hours of study time (or the number of practical exercises, or the cost of training) for task L are added with the same indicators characterizing the amount of training required after the transfer for task B, and this sum is calculated for each of the possible values of the amount of practice on task A. As soon as the total value of the indicator for both tasks exceeds its value for only one task A, it can be concluded that training has become uneconomical. On the graph, this occurs at the point where each task takes 5 hours, since 5 hours of training time and 5 hours of flight time obviously do not provide any savings over the standard 10 hours of flight time. It is clear that this boundary point coincides with the onewhich is determined using the transfer efficiency factor.
A properly constructed training program should be focused on maximizing the transfer of the stereotype to the task for which it is intended. When a high degree of transfer is achieved, an attempt should be made to optimize the total training time. The use of quantitative indicators of transference, as in the methods discussed above for assessing verbal, visual and practical skills, should contribute to ensuring the effectiveness of learning.