While languages such as Python and R are becoming more and more popular for data science, C and C ++ can be strong choices for efficiently solving problems in Data Science. In this article, we will use C99 and C ++ 11 to write a program that works with the Anscombe quartet, which I will discuss next.
I wrote about my motivation to constantly learn languages in an article on Python and GNU Octave that is worth reading. All programs are for the command line, not a graphical user interface (GUI). Full examples are available in the polyglot_fit repository.
Programming challenge
The program you'll write in this series:
- Reads data from a CSV file
- Interpolates data with a straight line (i.e., f (x) = m ⋅ x + q).
- Writes the result to an image file
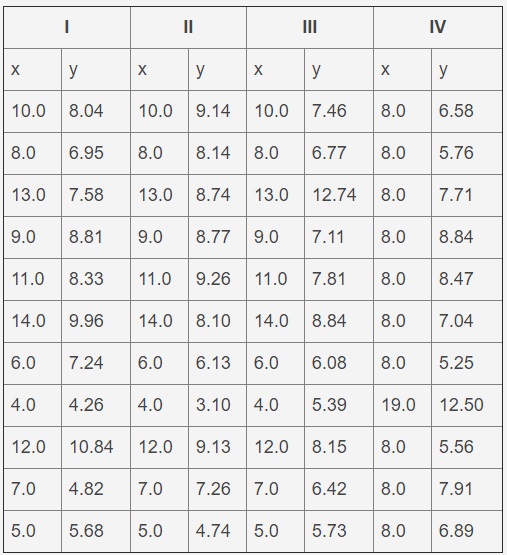
This is a common challenge faced by many data scientists. An example of data is the first set of the Anscombe quartet, presented in the table below. This is a set of artificially constructed data that gives the same results when fitted to a straight line, but their graphs are very different. A data file is a text file with tabs for separating columns and several lines that form a header. This problem will only use the first set (i.e. the first two columns).
Anscombe Quartet
Solution in C
C is a general-purpose programming language that is one of the most popular languages in use today (according to the TIOBE Index , RedMonk Programming Language Rankings , Programming Language Popularity Index , and GitHub research ). It is an old language (it was created around 1973) and many successful programs have been written in it (for example, the Linux kernel and Git). This language is also as close as possible to the inner workings of a computer, as it is used for direct memory management. It is a compiled language , so the source code must be translated into machine code by the compiler . Histhe standard library is small and light in size, so other libraries have been developed to provide the missing functionality.
This is the language I use the most for number crushing , mainly because of its performance. I find it quite tedious to use as it requires a lot of boilerplate code , but it is well supported in a variety of environments. The C99 standard is a recent revision that adds some nifty features and is well supported by compilers.
I will cover the prerequisites for programming in C and C ++ so that both beginners and experienced users can use these languages.
Installation
C99 development requires a compiler. I usually use Clang , but GCC , another full-fledged open source compiler , will do . To fit the data, I decided to use the GNU scientific library . For plotting, I could not find any reasonable library and therefore this program relies on an external program: Gnuplot . The example also uses a dynamic data structure to store data, which is defined in the Berkeley Software Distribution (BSD ).
Installation on Fedora is very simple:
sudo dnf install clang gnuplot gsl gsl-develCode Comments
In C99, comments are formatted by adding // to the beginning of the line, and the rest of the line will be discarded by the interpreter. Anything between / * and * / is also discarded.
//    .
/*     */
Required libraries
Libraries consist of two parts:
- Header file containing description of functions
- Source file containing function definitions
Header files are included in the source code, and the source code of the libraries is linked to the executable. Hence the header files are required for this example:
//  -
#include <stdio.h>
//
#include <stdlib.h>
//
#include <string.h>
//   ""  BSD
#include <sys/queue.h>
//   GSL
#include <gsl/gsl_fit.h>
#include <gsl/gsl_statistics_double.h>
Main function
In C, the program must be inside a special function called main () :
int main(void) {
    ...
}
Here you can notice a difference from Python, which was discussed in the last tutorial, because in the case of Python, whatever code it finds in the source files will execute.
Defining Variables
In C, variables must be declared before they are used, and they must be associated with a type. Whenever you want to use a variable, you must decide what data to store in it. You can also indicate if you are going to use the variable as a constant value, which is not required, but the compiler can benefit from this information. Example from the fitting_C99.c program in the repository:
const char *input_file_name = "anscombe.csv";
const char *delimiter = "\t";
const unsigned int skip_header = 3;
const unsigned int column_x = 0;
const unsigned int column_y = 1;
const char *output_file_name = "fit_C99.csv";
const unsigned int N = 100;
Arrays in C are not dynamic in the sense that their length must be determined in advance (i.e., before compilation):
int data_array[1024];Since you usually don't know how many data points are in the file, use a singly linked list . It is a dynamic data structure that can grow indefinitely. Fortunately BSD provides singly linked lists . Here's an example definition:
struct data_point {
    double x;
    double y;

    SLIST_ENTRY(data_point) entries;
};

SLIST_HEAD(data_list, data_point) head = SLIST_HEAD_INITIALIZER(head);
SLIST_INIT(&head);
This example defines a list data_point , consisting of structured values that contain both x and y values . The syntax is quite complex, but intuitive, and a detailed description would be too verbose.
Printout
To print to the terminal, you can use the printf () function , which works like the printf () function in Octave (described in the first article):
printf("#### C99 ####\n");The printf () function does not automatically add a newline at the end of the printed line, so you need to add it yourself. The first argument is a string, which can contain information about the format of other arguments that can be passed to the function, for example:
printf("Slope: %f\n", slope);Reading data
Now comes the tricky part ... There are several libraries for parsing CSV files in C, but none have proven stable or popular enough to be in the Fedora package repository. Instead of adding a dependency for this tutorial, I decided to write this part myself. Again, it would be too wordy to go into details, so I will only explain the general idea. Some lines in the source code will be ignored for brevity, but you can find a complete example in the repository.
First open the input file:
FILE* input_file = fopen(input_file_name, "r");Then read the file line by line until an error occurs or until the file ends:
while (!ferror(input_file) && !feof(input_file)) {
    size_t buffer_size = 0;
    char *buffer = NULL;

    getline(&buffer, &buffer_size, input_file);

    ...
}
The getline () function is a nice recent addition to the POSIX.1-2008 standard . It can read an entire line in a file and take care of allocating the necessary memory. Each line is then split into tokens using the strtok () function . Looking at the token, select the columns you need:
char *token = strtok(buffer, delimiter);

while (token != NULL)
{
    double value;
    sscanf(token, "%lf", &value);

    if (column == column_x) {
        x = value;
    } else if (column == column_y) {
        y = value;
    }

    column += 1;
    token = strtok(NULL, delimiter);
}
Finally, with the x and y values selected, add a new point to the list:
struct data_point *datum = malloc(sizeof(struct data_point));
datum->x = x;
datum->y = y;

SLIST_INSERT_HEAD(&head, datum, entries);
The malloc () function dynamically allocates (reserves) some amount of permanent memory for a new point.
Fitting data
GSL's linear interpolation function gsl_fit_linear () accepts regular arrays as input. Therefore, since you cannot know the size of the created arrays in advance, you must manually allocate memory for them:
const size_t entries_number = row - skip_header - 1;

double *x = malloc(sizeof(double) * entries_number);
double *y = malloc(sizeof(double) * entries_number);
Then go through the list to store the relevant data in the arrays:
SLIST_FOREACH(datum, &head, entries) {
    const double current_x = datum->x;
    const double current_y = datum->y;

    x[i] = current_x;
    y[i] = current_y;

    i += 1;
}
Now that you're done with the list, clean up the order. Always free memory that was manually allocated to prevent memory leaks . Memory leaks are bad, bad, and again bad. Every time the memory is not freed, the garden gnome loses his head:
while (!SLIST_EMPTY(&head)) {
    struct data_point *datum = SLIST_FIRST(&head);

    SLIST_REMOVE_HEAD(&head, entries);

    free(datum);
}
Finally, finally (!), You can fit your data:
gsl_fit_linear(x, 1, y, 1, entries_number,
               &intercept, &slope,
               &cov00, &cov01, &cov11, &chi_squared);
const double r_value = gsl_stats_correlation(x, 1, y, 1, entries_number);

printf("Slope: %f\n", slope);
printf("Intercept: %f\n", intercept);
printf("Correlation coefficient: %f\n", r_value);
Plotting a graph
To build a graph, you must use an external program. So keep the fitting function in an external file:
const double step_x = ((max_x + 1) - (min_x - 1)) / N;

for (unsigned int i = 0; i < N; i += 1) {
    const double current_x = (min_x - 1) + step_x * i;
    const double current_y = intercept + slope * current_x;

    fprintf(output_file, "%f\t%f\n", current_x, current_y);
}
The Gnuplot plotting command looks like this:
plot 'fit_C99.csv' using 1:2 with lines title 'Fit', 'anscombe.csv' using 1:2 with points pointtype 7 title 'Data'results
Before running the program, you need to compile it:
clang -std=c99 -I/usr/include/ fitting_C99.c -L/usr/lib/ -L/usr/lib64/ -lgsl -lgslcblas -o fitting_C99This command tells the compiler to use the C99 standard, read the fitting_C99.c file, load the gsl and gslcblas libraries, and save the result to fitting_C99. The resulting output on the command line:
####      C99 ####
 : 0.500091
: 3.000091
 : 0.816421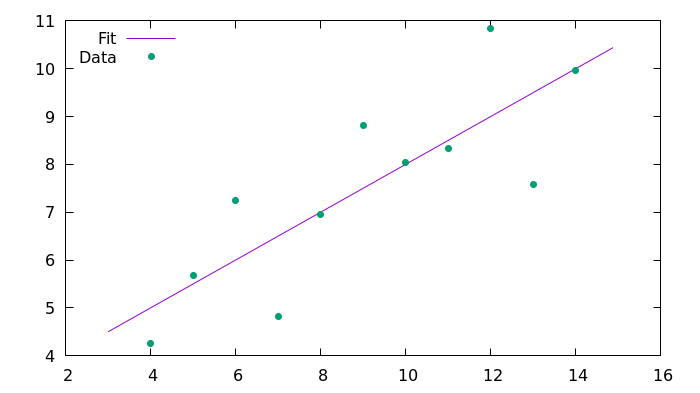
Here is the resulting image generated using Gnuplot.
C ++ 11 solution
C ++ is a general-purpose programming language that is also one of the most popular languages in use today. It was created as the successor to the C language (in 1983) with an emphasis on object-oriented programming (OOP). C ++ is generally considered a superset of C, so a C program must be compiled with a C ++ compiler. This is not always the case, as there are some edge cases where they behave differently. In my experience, C ++ requires less boilerplate code than C, but its syntax is more complex if you want to design objects. The C ++ 11 standard is a recent revision that adds some nifty features that are more or less supported by compilers.
Since C ++ is pretty much C compatible, I'll just focus on the differences between the two. If I do not describe a section in this part, it means that it is the same as in C.
Installation
The dependencies for C ++ are the same as for example C. On Fedora, run the following command:
sudo dnf install clang gnuplot gsl gsl-develRequired libraries
The libraries work the same as in C, but the include directives are slightly different:
#include <cstdlib>
#include <cstring>
#include <iostream>
#include <fstream>
#include <string>
#include <vector>
#include <algorithm>

extern "C" {
#include <gsl/gsl_fit.h>
#include <gsl/gsl_statistics_double.h>
}
Since the GSL libraries are written in C, the compiler needs to be informed about this feature.
Defining Variables
C ++ supports more data types (classes) than C, for example, the string type, which has many more features than its C counterpart. Update your variable definitions accordingly:
const std::string input_file_name("anscombe.csv");For structured objects such as strings, you can define a variable without using the = sign .
Printout
You can use the printf () function , but it is more common to use cout . Use the << operator to specify the string (or objects) that you want to print with cout :
std::cout << "####      C++11 ####" << std::endl;
...
std::cout << " : " << slope << std::endl;
std::cout << ": " << intercept << std::endl;
std::cout << " : " << r_value << std::endl;
Reading data
The circuit is the same as before. The file is opened and read line by line, but with a different syntax:
std::ifstream input_file(input_file_name);

while (input_file.good()) {
    std::string line;

    getline(input_file, line);

    ...
}
String tokens are retrieved by the same function as in the C99 example. Use two vectors instead of standard C arrays . Vectors are an extension of C arrays in the C ++ standard library to dynamically manage memory without calling malloc () :
std::vector<double> x;
std::vector<double> y;

//    x  y
x.emplace_back(value);
y.emplace_back(value);
Fitting data
To fit data in C ++, you don't have to worry about lists, since vectors are guaranteed to have sequential memory. You can directly pass pointers to vector buffers to the fitting functions:
gsl_fit_linear(x.data(), 1, y.data(), 1, entries_number,
               &intercept, &slope,
               &cov00, &cov01, &cov11, &chi_squared);
const double r_value = gsl_stats_correlation(x.data(), 1, y.data(), 1, entries_number);

std::cout << " : " << slope << std::endl;
std::cout << ": " << intercept << std::endl;
std::cout << " : " << r_value << std::endl;
Plotting a graph
The plotting is done in the same way as before. Write to file:
const double step_x = ((max_x + 1) - (min_x - 1)) / N;

for (unsigned int i = 0; i < N; i += 1) {
    const double current_x = (min_x - 1) + step_x * i;
    const double current_y = intercept + slope * current_x;

    output_file << current_x << "\t" << current_y << std::endl;
}

output_file.close();
Then use Gnuplot to plot the graph.
results
Before running the program, it must be compiled with a similar command:
clang++ -std=c++11 -I/usr/include/ fitting_Cpp11.cpp -L/usr/lib/ -L/usr/lib64/ -lgsl -lgslcblas -o fitting_Cpp11Resulting output on the command line:
####      C++11 ####
 : 0.500091
: 3.00009
 : 0.816421
And here's the resulting image, generated with Gnuplot.
Conclusion
This article provides examples of data fitting and plotting in C99 and C ++ 11. Since C ++ is largely compatible with C, this article uses the similarities to write a second example. In some aspects, C ++ is easier to use, since it partially relieves the burden of explicit memory management, but its syntax is more complex, since it introduces the ability to write classes for OOP. However, you can also write in C using OOP techniques, since OOP is a programming style, it can be used in any language. There are some great examples of OOP in C, such as the GObject and Jansson libraries .
I prefer to use C99 for working with numbers because of its simpler syntax and wider support. Until recently, C ++ 11 was not widely supported and I tried to avoid the rough edges in previous versions. For more complex software, C ++ might be a good choice.
Are you using C or C ++ for Data Science? Share your experience in the comments.

Find out the details of how to get a high-profile profession from scratch or Level Up in skills and salary by taking SkillFactory's paid online courses:
- Machine Learning Course (12 weeks)
- Learning Data Science from scratch (12 months)
- Analytics profession with any starting level (9 months)
- Python for Web Development Course (9 months)
Read more
- Data Sciene 2020
- Data Science . Business Science
- Data Scientist
- Data Scientist -
- 450
- Data Science : «data»
- Data Sciene : Decision Intelligence