Antifraud head Andrey Popov Nox_andrygave a presentation on how we were able to meet all these conflicting requirements. The central topic of the report is a model for calculating complex factors on a data stream and ensuring system fault tolerance. Andrey also briefly described the next, even faster iteration of antifraud, which we are currently developing.
The anti-fraud team essentially solves the binary classification problem. Therefore, the report may be of interest not only to anti-fraud specialists, but also to those who make various systems that need fast, reliable and flexible factors on large amounts of data.
- Hi My name is Andrey. I work at Yandex, I am in charge of the development of antifraud. I was told that people prefer to use the word “features”, so I’ll mention it throughout the talk, but the title and introduction remained the same, with the word “factors”.
What is antifraud?
What is antifraud anyway? It is a system that protects users from negative impact on the service. By negative influence, I mean deliberate actions that can degrade the quality of the service and, accordingly, worsen the user experience. These can be fairly simple parsers and robots that worsen our statistics, or deliberately complex fraudulent activities. The second, of course, is more difficult and more interesting to define.
What does antifraud fight against? A couple of examples.
For example, imitation of user actions. This is done by the guys we call "black SEO" - those who do not want to improve the quality of the site and the content on the site. Instead, they write robots that go to Yandex search, click on their site. They expect their site to rise higher this way. Just in case, I remind you that such actions contradict the user agreement and may lead to serious sanctions from Yandex.

Or, for example, cheating reviews. Such a review can be seen from the organization on Maps, which puts plastic windows. She herself paid for this review.
The top-level anti-fraud architecture looks like this: a certain set of raw events fall into the anti-fraud system itself like a black box. At the exit from it, tagged events are generated.
Yandex has many services. All of them, especially large ones, one way or another face different types of fraud. Search, Market, Maps and dozens of others.
Where were we two or three years ago? Each team survived under the onslaught of fraud as best they could. She generated her anti-fraud teams, her systems, which did not always work well, were not very convenient for interacting with analysts. And most importantly, they were poorly integrated with each other.
I want to tell you how we solved this by creating a single platform.

Why do we need a single platform? Reuse of experience and data. Centralization of experience and data in one place allows you to respond faster and better to large attacks - they are usually cross-service.
Unified toolkit. People have the tools they are used to. And obviously the connection speed. If we launched a new service that is currently under active attack, then we must quickly connect a high-quality antifraud to it.
We can say that we are not unique in this regard. All large companies face similar problems. And everyone with whom we communicate comes to the creation of their single platform.
I'll tell you a little about how we classify antifrauds.
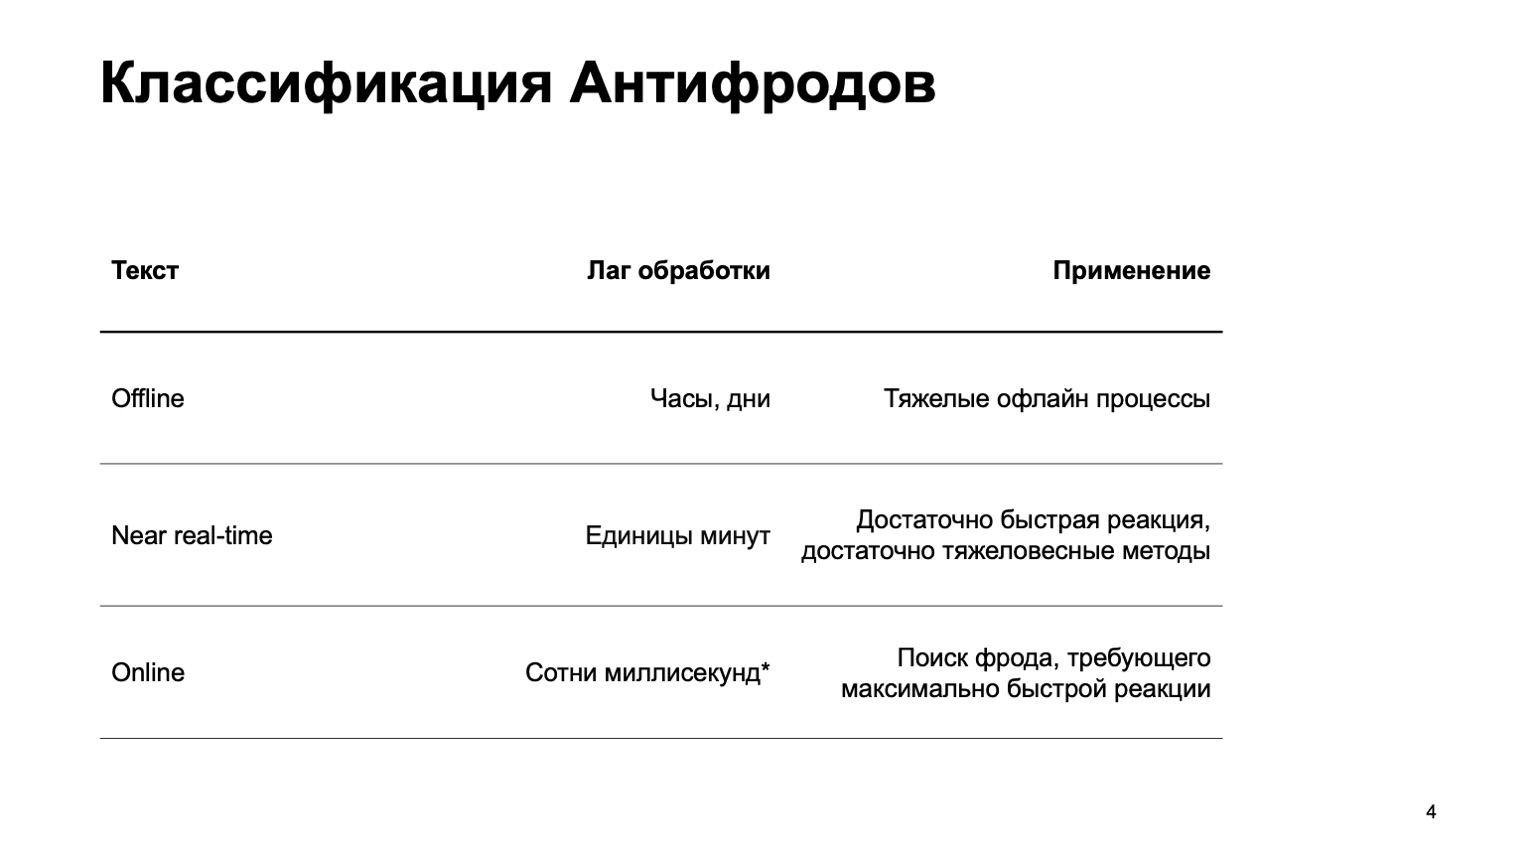
This can be an offline system that counts hours, days and heavy offline processes: for example, complex clustering or complex retraining. I will practically not touch on this part in the report. There is a near real-time part that works in a few minutes. This is a kind of golden mean, she has quick reactions and heavy methods. First of all, I will focus on her. But it is equally important to say that at this stage we are using data from the stage above.
There are also online parts that are needed in places where a quick response is required and it is critical to weed out fraud even before we have received the event and passed it to the user. Here we reuse data and machine learning algorithms computed at higher levels again.
I will talk about how this unified platform is arranged, about the language for describing features and interacting with the system, about our path to increasing speed, that is, just about the transition from the second stage to the third.
I will hardly touch upon the ML methods themselves. Basically, I will talk about platforms that create features, which we then use in training.
Who might be interested in this? Obviously, to those who write anti-fraud or fight scammers. But also for those who just start the data stream and read the features, ML considers. Since we have made a fairly general system, maybe you will be interested in some of this.
What are the system requirements? There are quite a few of them, here are some of them:
- Large data stream. We process hundreds of millions of events in five minutes.
- Fully configurable features.
- .
- , - exactly-once- , . — , , , , .
- , , .
Further I will tell you about each of these points separately.
Since for security reasons I cannot talk about real services, let's introduce a new Yandex service. Actually no, forget, this is a fictional service that I came up with to show examples. Let it be a service on which people have a database of all existing books. They go in, give ratings from one to ten, and the attackers want to influence the final rating so that their books are bought.
All coincidences with real services are, of course, random. Let's consider first of all the near real-time version, since online is not specifically needed here at the first approximation.
Big data
Yandex has a classic way to solve big data problems: use MapReduce. We use our own MapReduce implementation called YT . By the way, Maxim Akhmedov has a story about her tonight . You can use your implementation or an open source implementation like Hadoop.
Why don't we use the online version right away? It is not always needed, it can complicate recalculations into the past. If we have added a new algorithm, new features, we often want to recalculate the data in the past in order to change the verdicts on it. It's harder to use heavyweight methods - I think it's clear why. And the online version, for a number of reasons, can be more demanding in terms of resources.
If we use MapReduce, we get something like this. We use a kind of mini-batching, that is, we divide the batch into the smallest possible pieces. In this case, it is one minute. But those who work with MapReduce know that less than this size, probably, there are already too large overheads of the system itself - overhead. Conventionally, it will not be able to cope with processing in one minute.
Next, we run the Reduce set on this set of batches and get a marked-up batch.
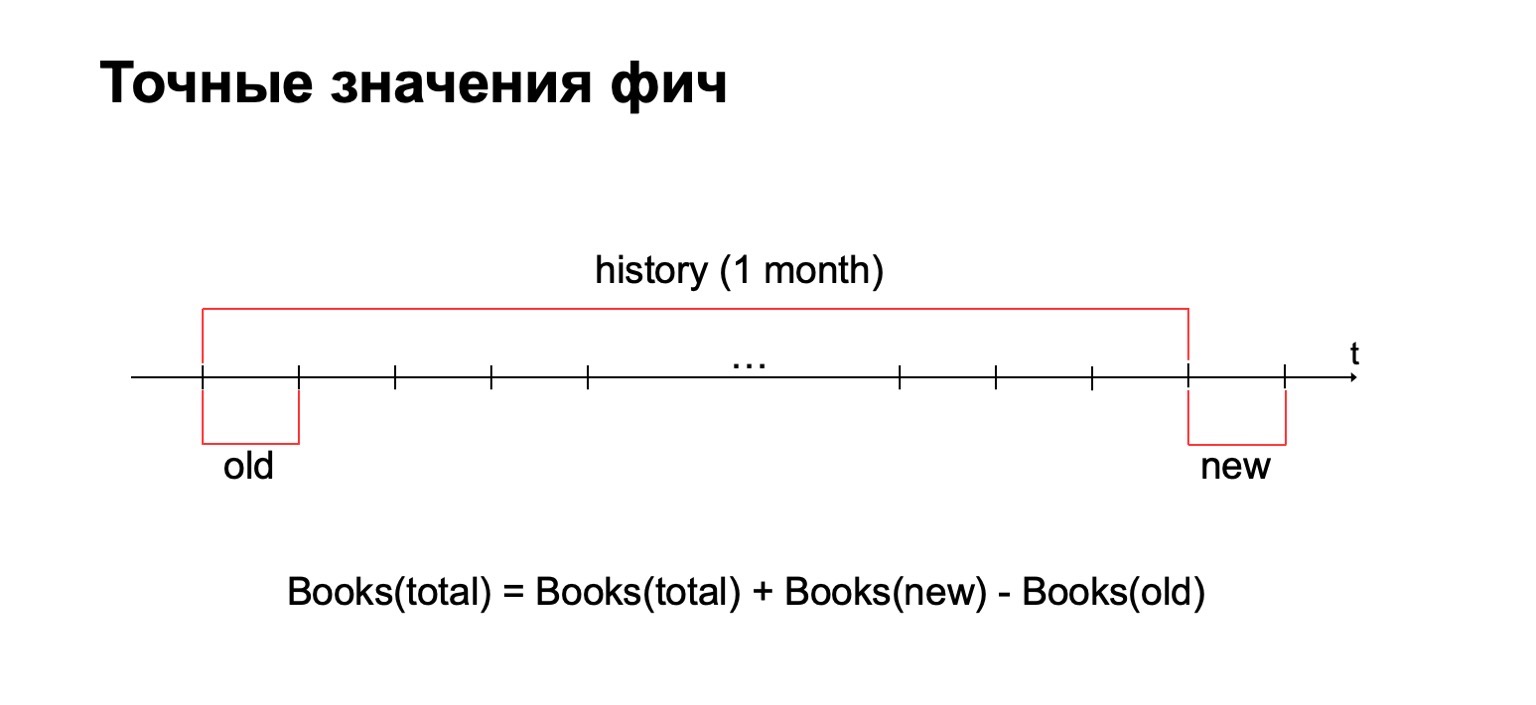
In our tasks, it is often necessary to calculate the exact value of features. For example, if we want to calculate the exact number of books that a user has read in the last month, then we will calculate this value for each batch and must store all the collected statistics in a single place. And then remove old values from it and add new ones.
Why not use rough counting methods? Short answer: we also use them, but sometimes in anti-fraud problems it is important to have exactly the exact value for some intervals. For example, the difference between two and three books read can be quite significant for certain methods.
As a consequence, we need a large data history in which we will store these statistics.
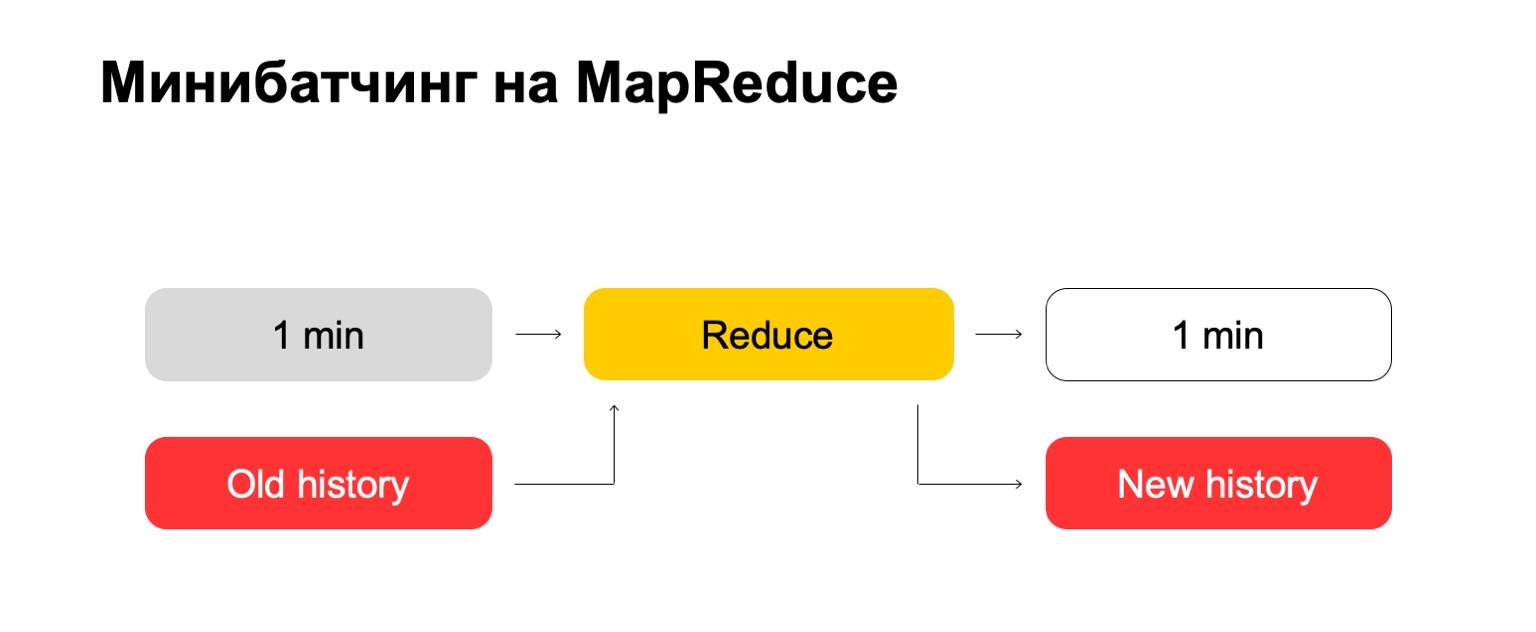
Let's try "head-on". We have one minute and a big old story. We put it into the Reduce input and output an updated history and a marked up log, data.
For those of you who have worked with MapReduce, you probably know that this can work quite poorly. If the history can be hundreds, or even thousands, tens of thousands of times larger than the batch itself, then such processing can work in proportion to the size of the history, and not the size of the batch.
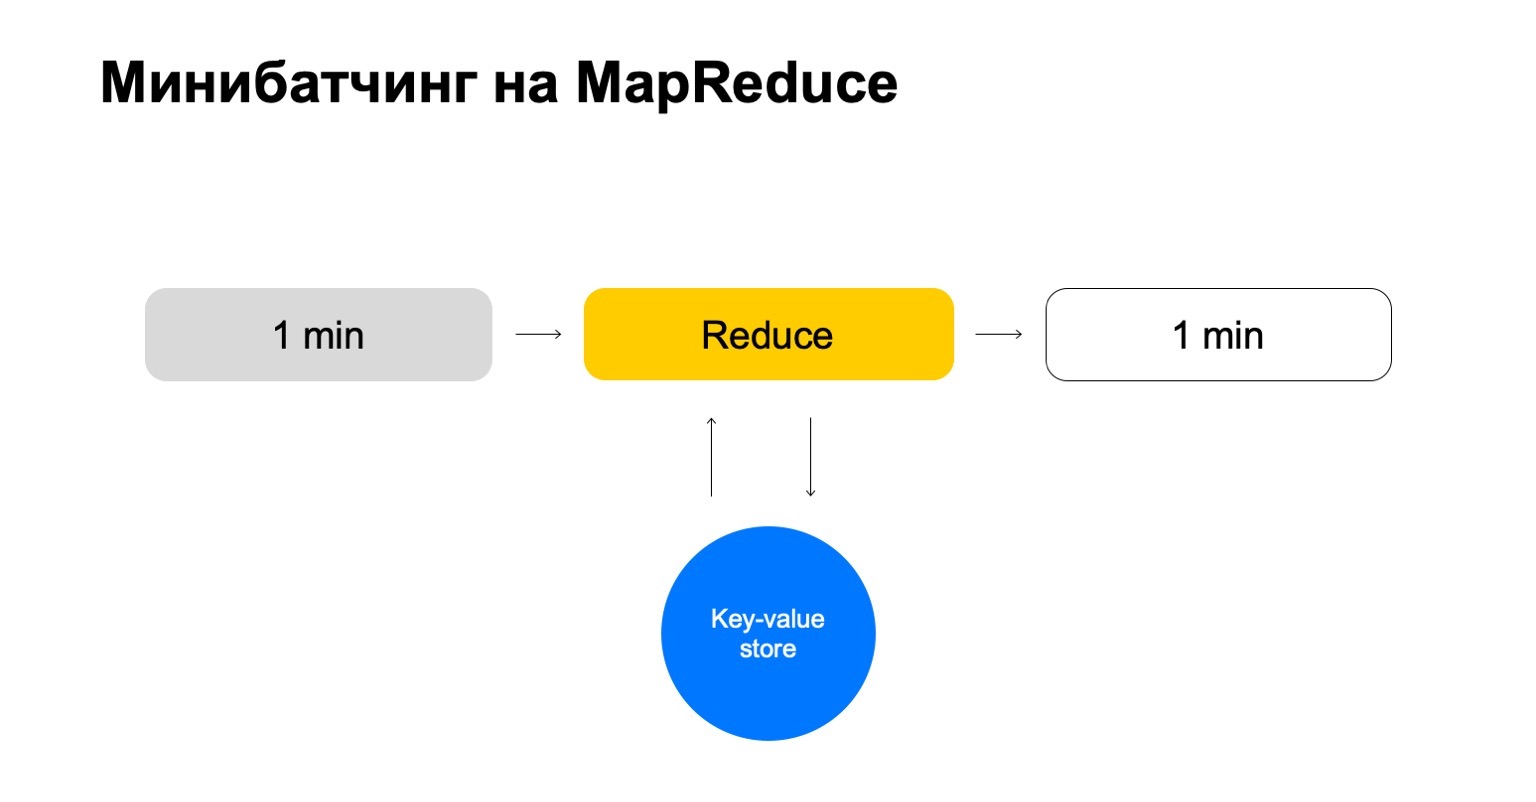
Let's replace this with some key-value store. This is again our own implementation, key-value storage, but it stores data in memory. Probably the closest analogue is some kind of Redis. But we get a slight advantage here: our implementation of the key-value store is very tightly integrated with MapReduce and the MapReduce cluster on which it runs. It turns out a convenient transactionality, convenient data transfer between them.
But the general scheme is that in each job of this Reduce we will go to this key-value storage, update the data and write it back after forming a verdict on it.
We end up with a story that only handles the keys we need and scales easily.
Configurable features
A little about how we configure features. Simple counters are often not enough. To search for scammers, you need a variety of features, you need a smart and convenient system for configuring them.
Let's break it down into three steps:
- Extract, where we extract data for the given key and from the log.
- Merge, where we merge this data with the statistics that are in history.
- Build, where we form the final value of the feature.
For example, let's calculate the percentage of detective stories read by a user.
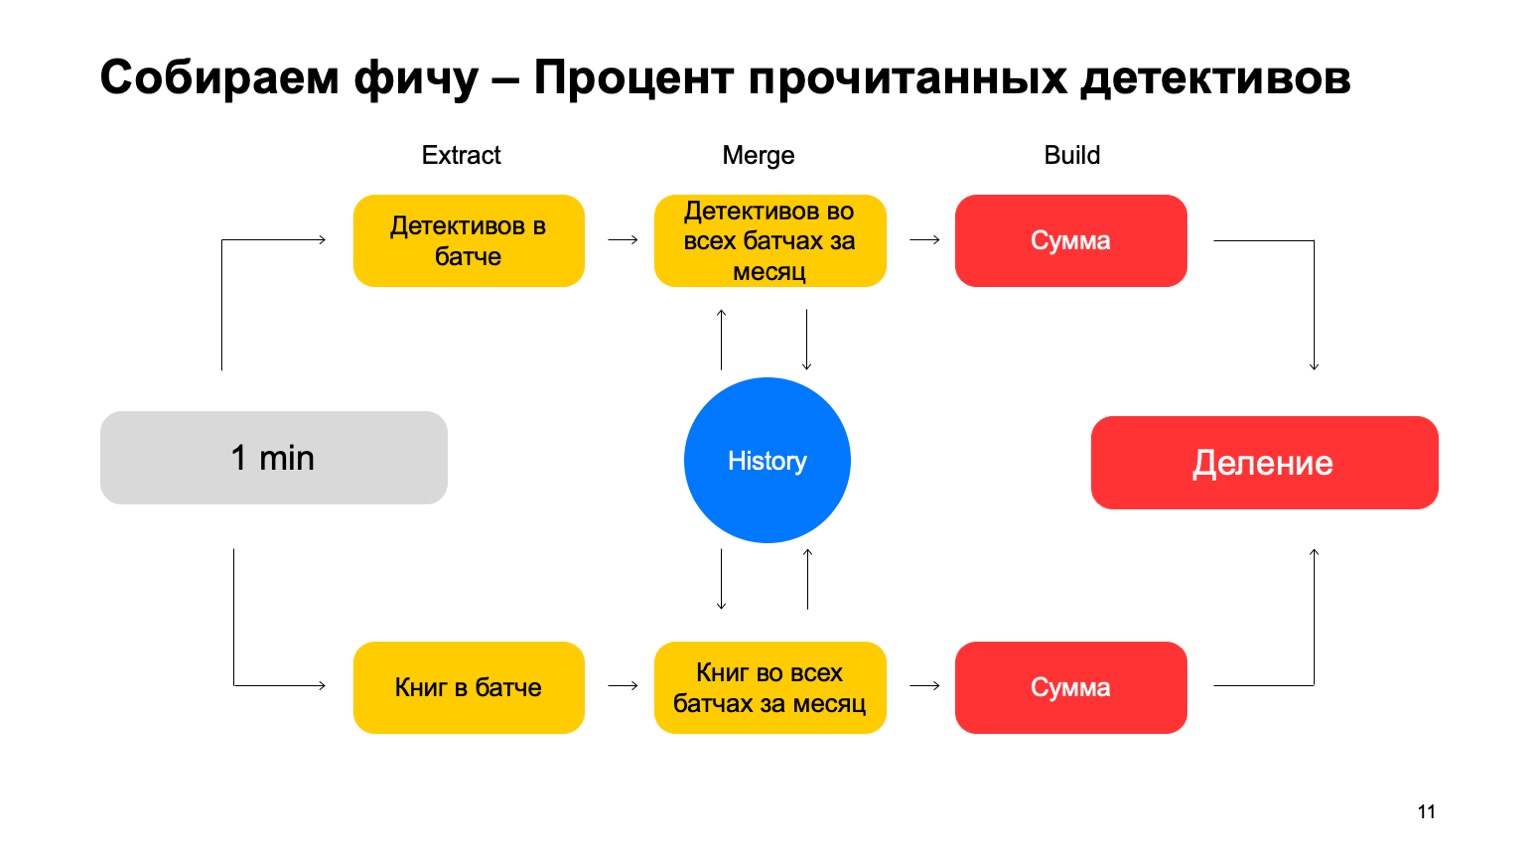
If the user reads too many detective stories, he is too suspicious. It is never clear what to expect from him. Then Extract is the removal of the number of detectives that the user read in this batch. Merge - taking all detectives, all this data from batches for a month. And Build is some amount.
Then we do the same for the value of all the books he read, and we end up with division.
What if we want to count different values, for example, the number of different authors that a user reads?
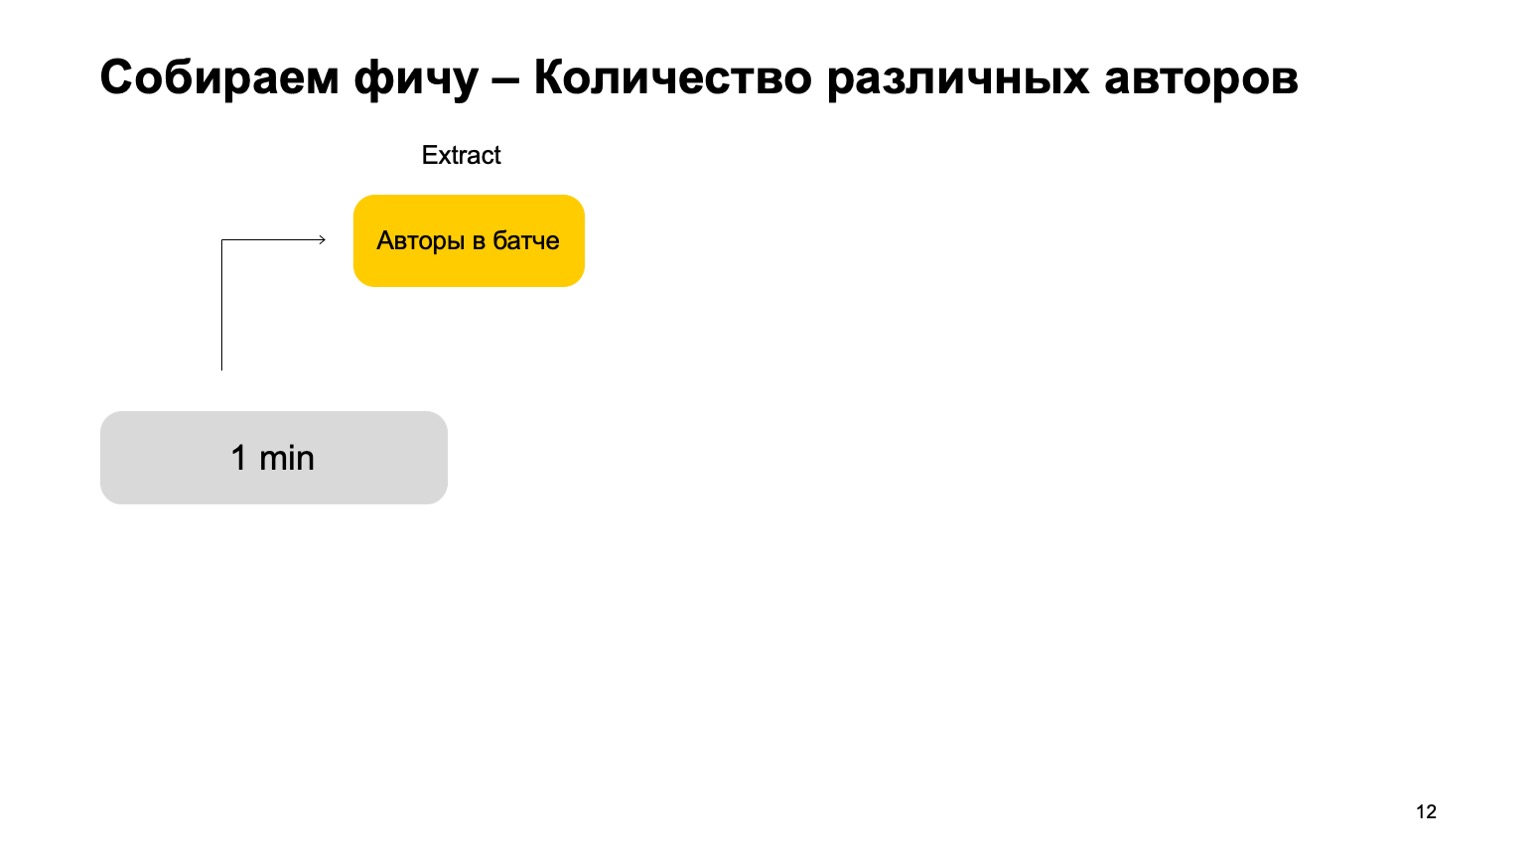
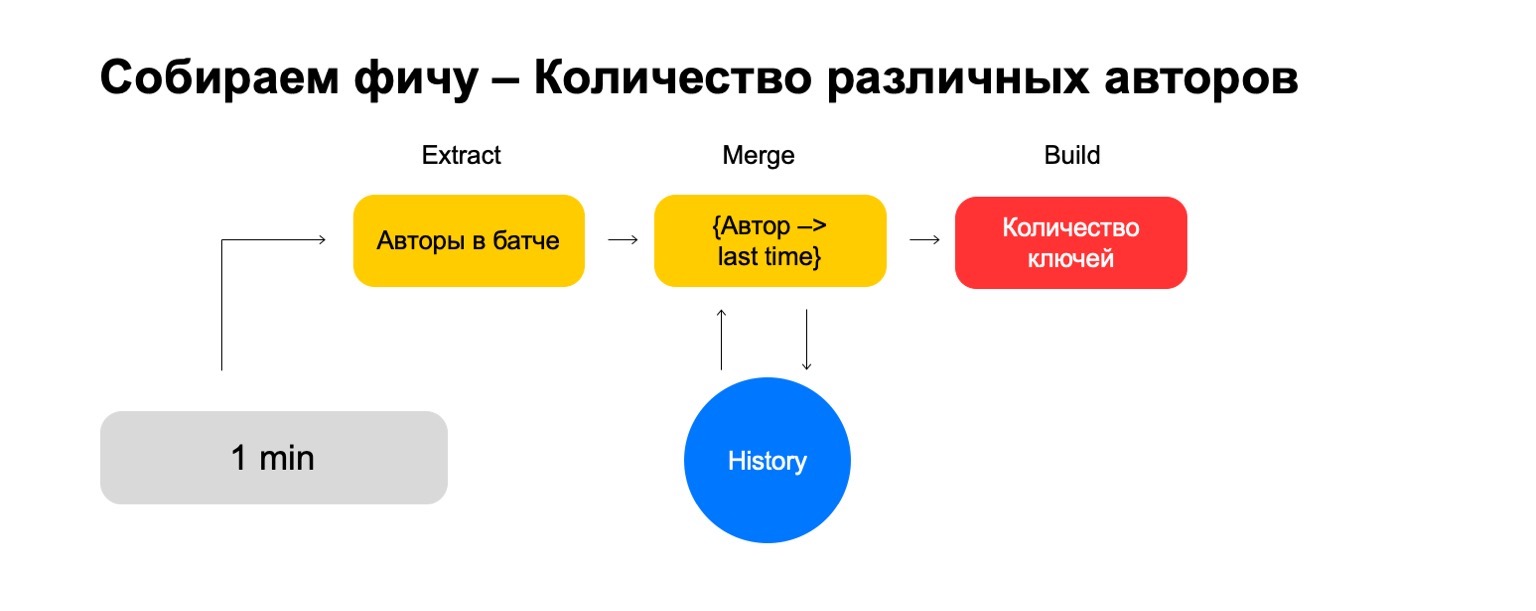
Then we can take the number of different authors that the user has read in this batch. Further, store some structure where we make an association of authors recently, when the user read them. Thus, if we again meet this author at the user, then we update this time. If we need to delete old events, we know what to delete. To calculate the final feature, we simply count the number of keys in it.
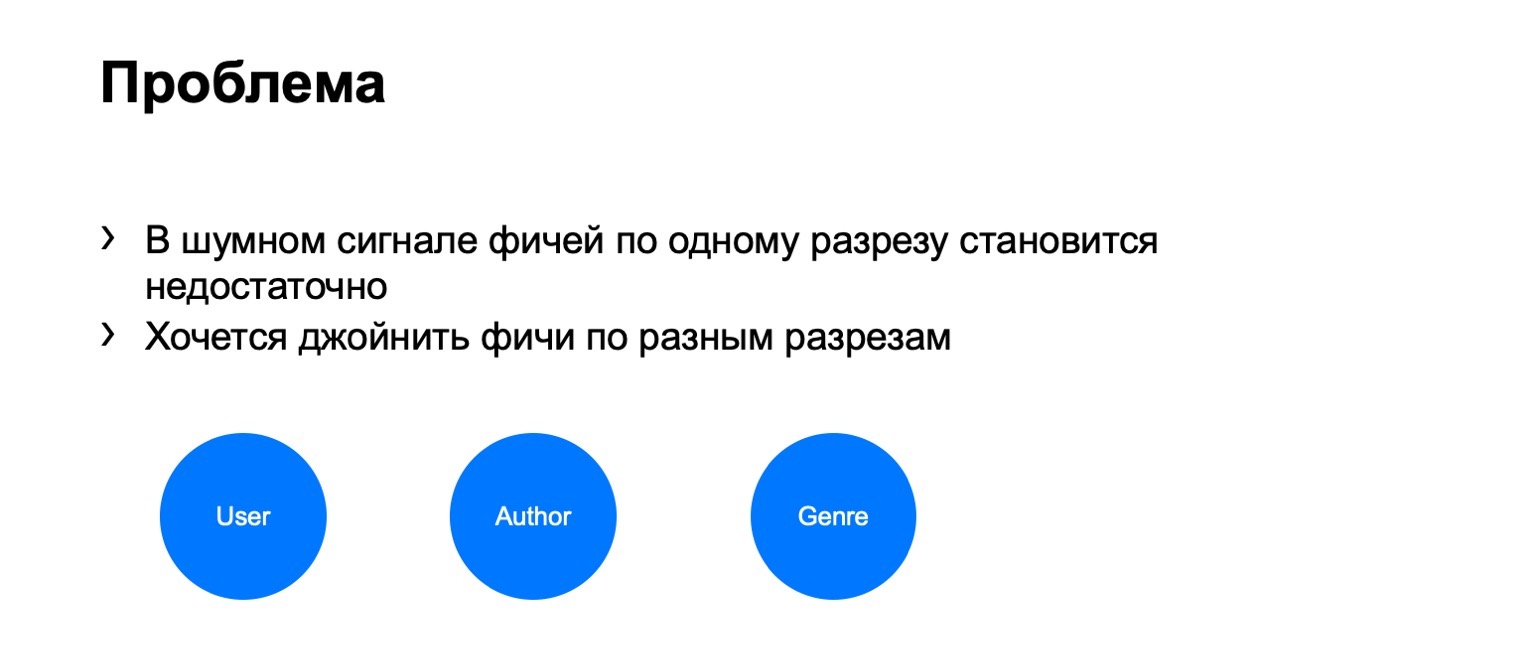
But in a noisy signal, such features are not enough for one cut, we need a system for gluing their joins, gluing these features from different cuts.
Let's, for example, introduce such cuts - user, author and genre.
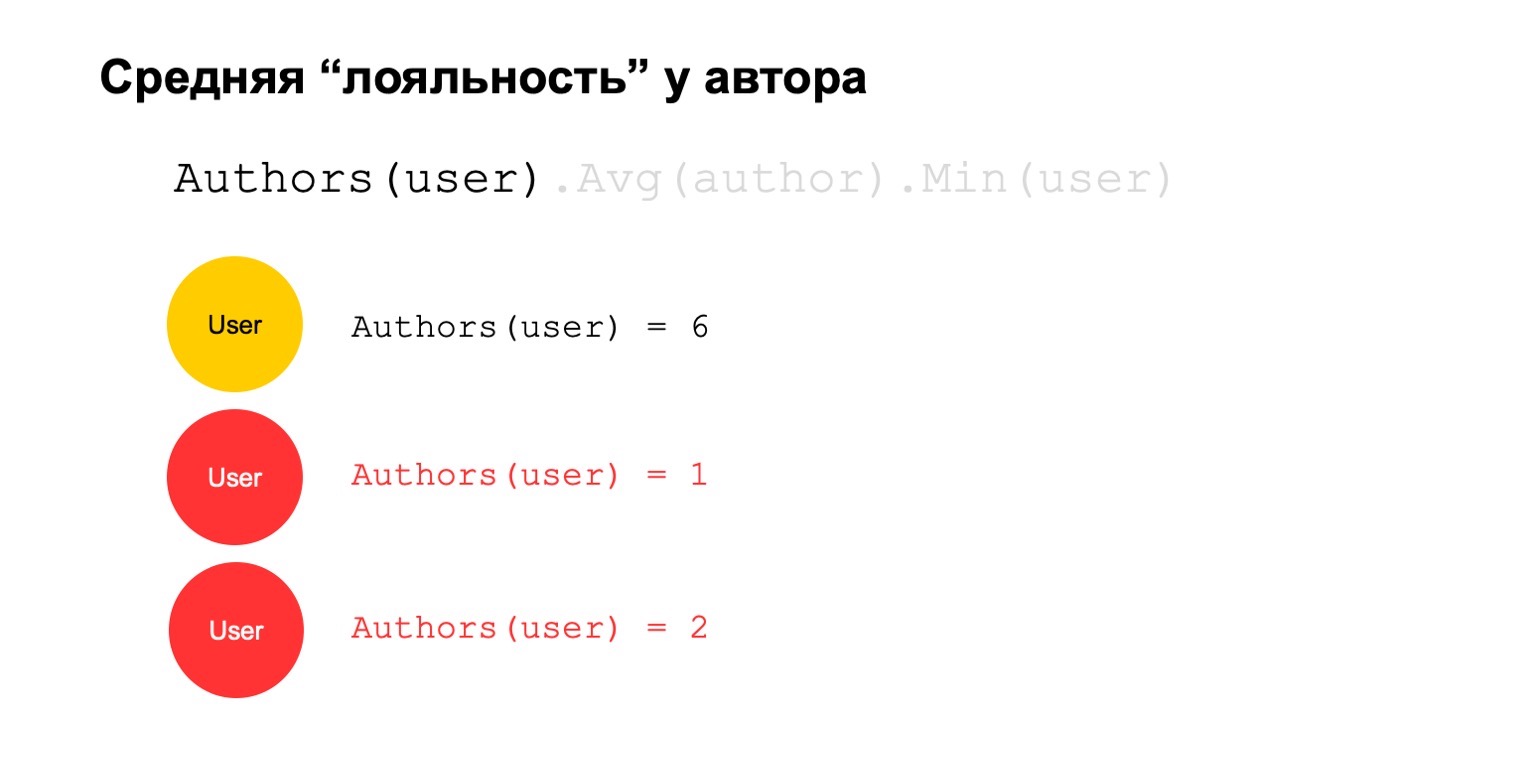
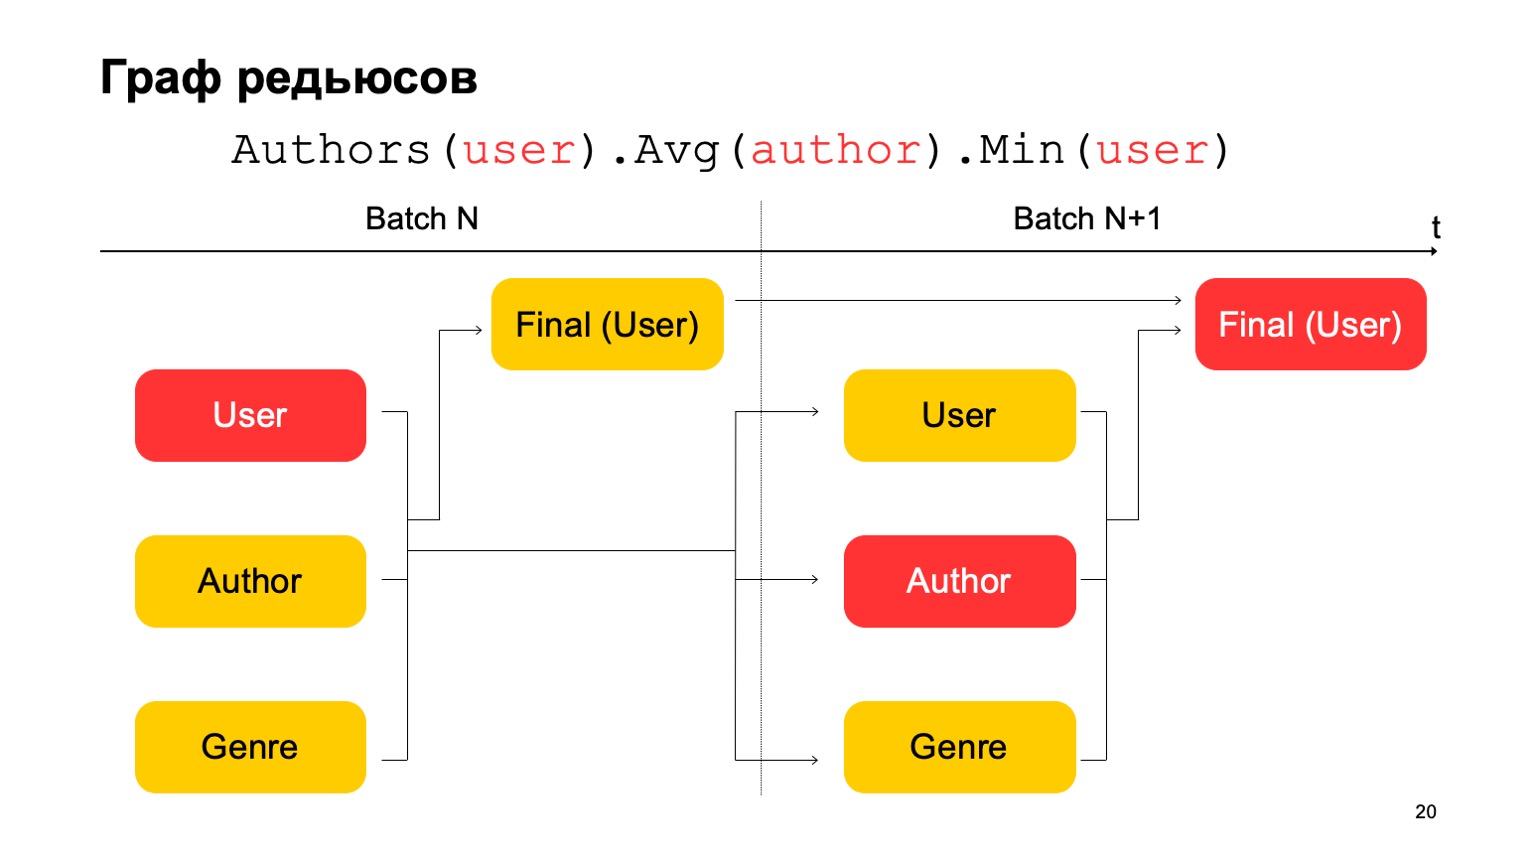
Let's calculate something difficult. For example, average author loyalty. By loyalty, I mean that users who read the author - they almost only read it. Moreover, this average value is quite low for the average number of authors read by users who read it.
This could be a potential signal. He, of course, can mean that the author is just like that: there are only fans around him, everyone who reads him reads only him. But it can also mean that the author himself is trying to cheat the system and create these fake users who supposedly read it.
Let's try to calculate it. Let's count a feature that counts the number of different authors over a long interval. For example, here the second and third values seem suspicious to us, there are too few of them.
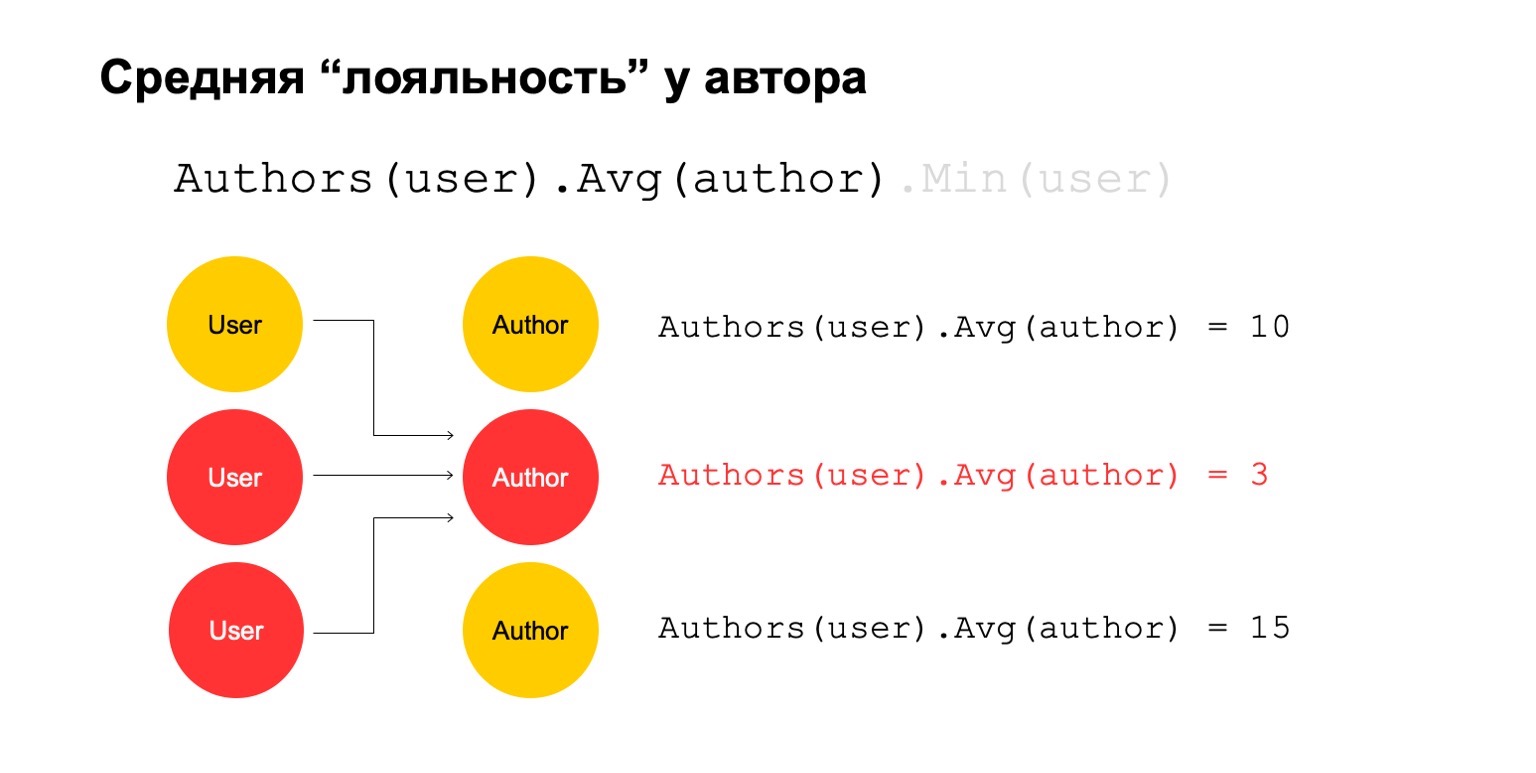
Then let's calculate the average value for the authors who are related over a large interval. And then here the average value is again quite low: 3. For some reason, this author seems suspicious to us.
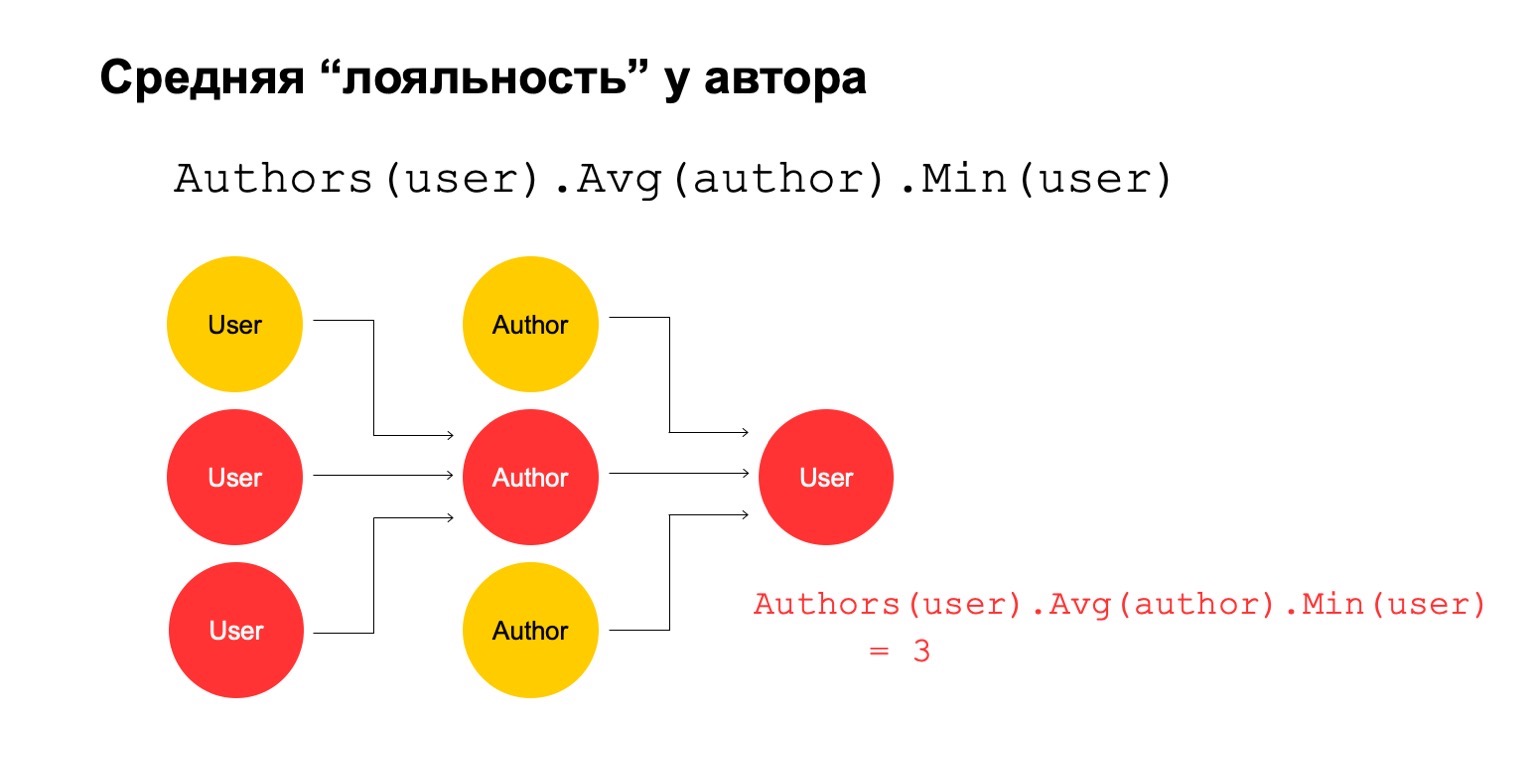
And we can return it back to the user in order to understand that this particular user has a connection with the author, which seems suspicious to us.
It is clear that this in itself cannot be an explicit criterion that the user should be filtered or something like that. But this could be one of the signals that we can use.
How to do this in the MapReduce paradigm? Let's make several consecutive reductions and the dependencies between them.

We get a graph of reductions. It influences on what slices we count features, which joins are generally allowed, on the amount of resources consumed: obviously, the more reductions, the more resources. And Latency, throughput.
Let's construct, for example, such a graph.
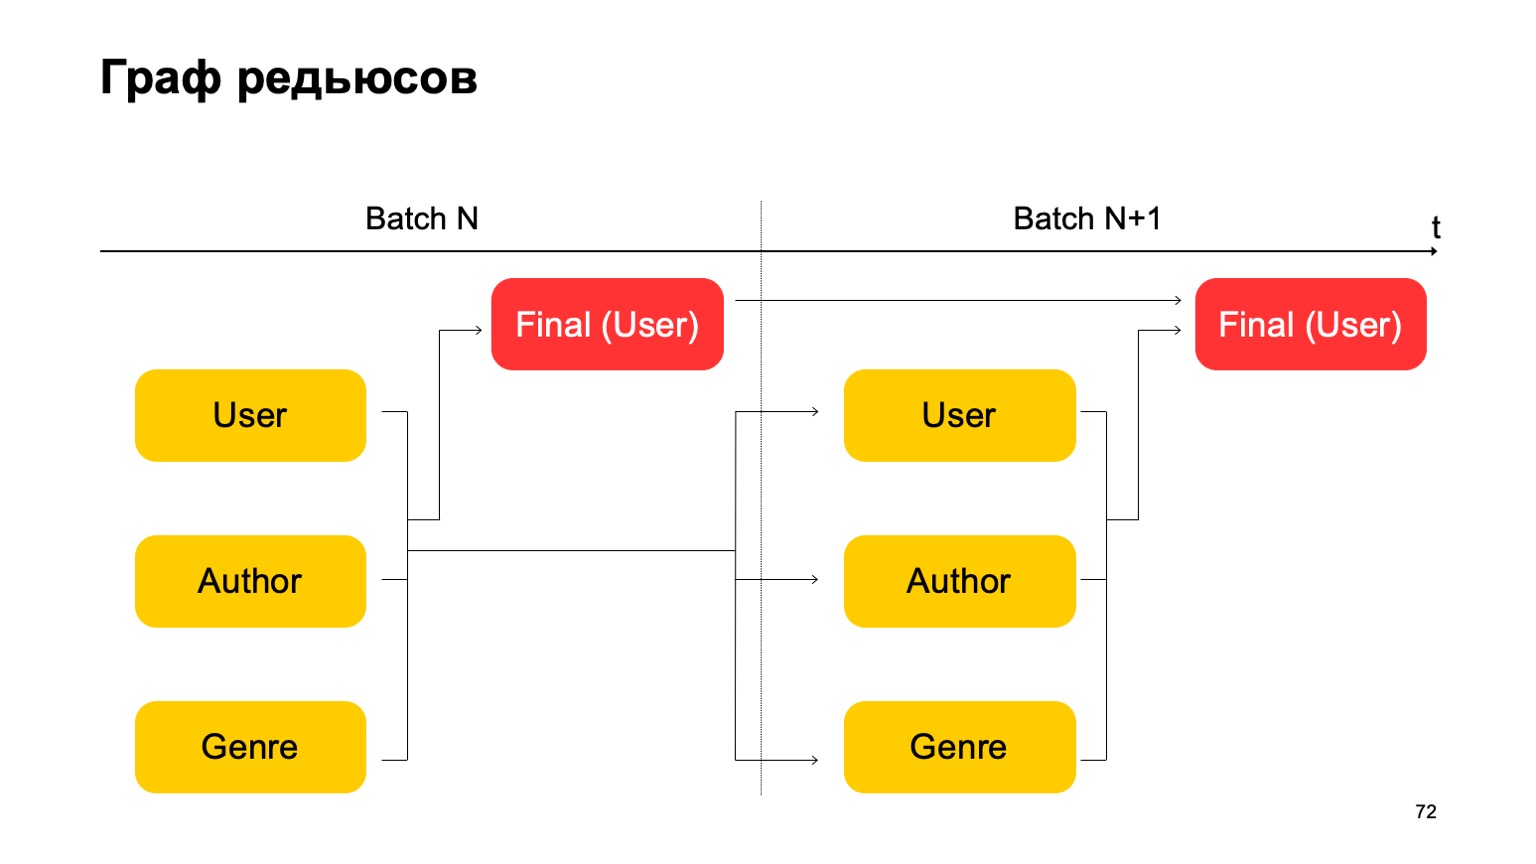
That is, we will divide the reductions that we have into two stages. At the first stage, we will calculate different reductions in parallel for different sections - our users, authors and genre. And we need some kind of second stage, where we will collect features from these different reductions and accept the final verdict.
For the next batch, we do the same. Moreover, we have a dependence of the first stage of each batch on the first stage of the past and the second stage on the second stage of the past.
It is important here that we do not have such a dependency:
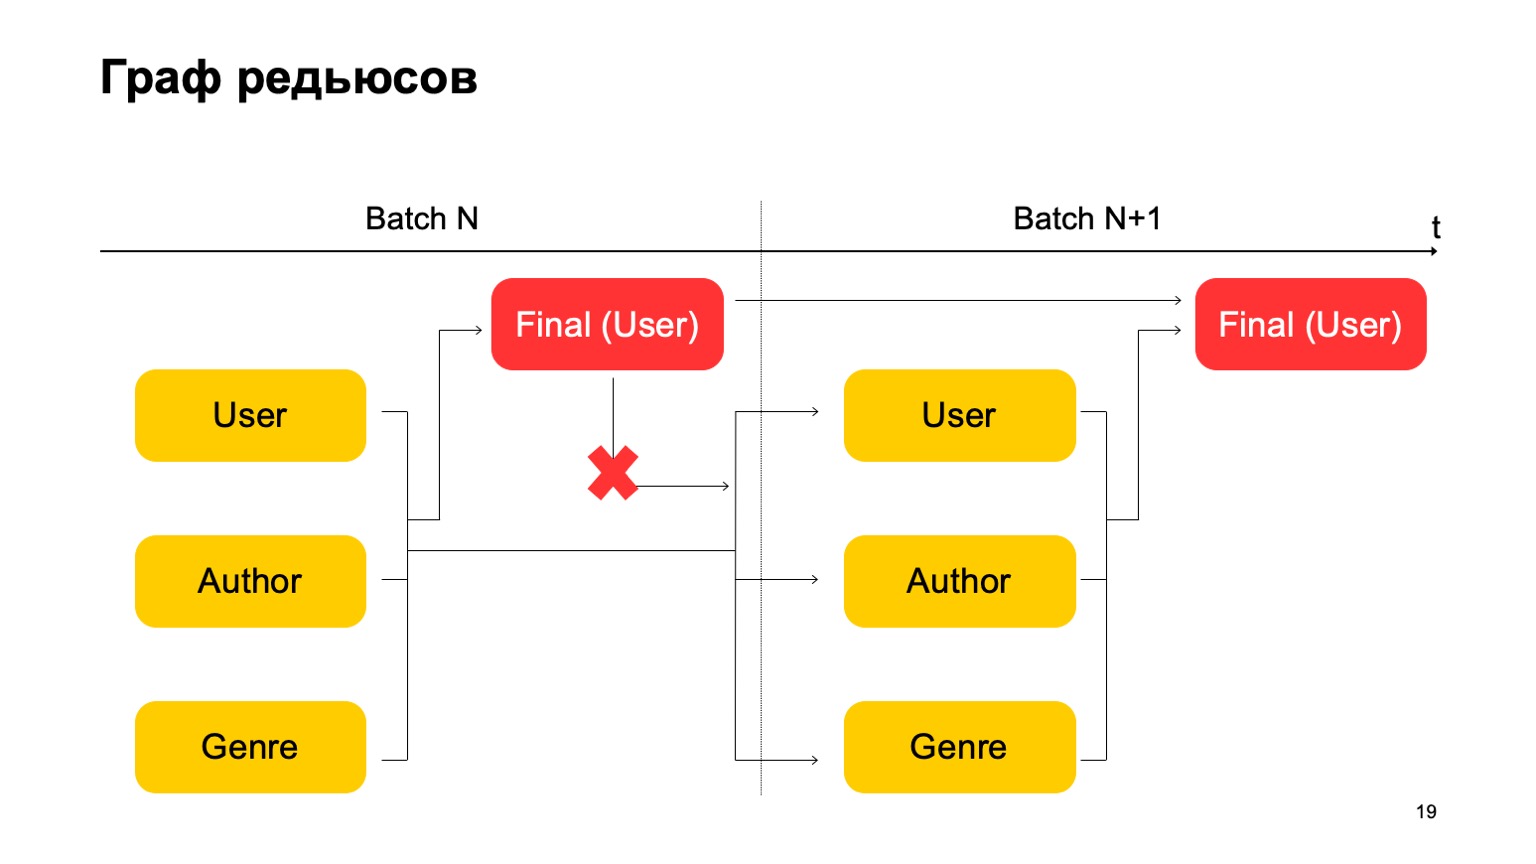
That is, we actually get a conveyor. That is, the first stage of the next batch can work in parallel with the second stage of the first batch.
How can we make the three-stage statistics in this, which I gave above, if we have only two stages? Very simple. We can read the first value at the first stage of the batch N.
The second value at the first stage of the batch is N + 1, and the final value must be read at the second stage of the batch N + 1. Thus, during the transition between the first stage and the second, there will be, perhaps, not quite accurate statistics for the N + 1 batch. But usually this is enough for such calculations.
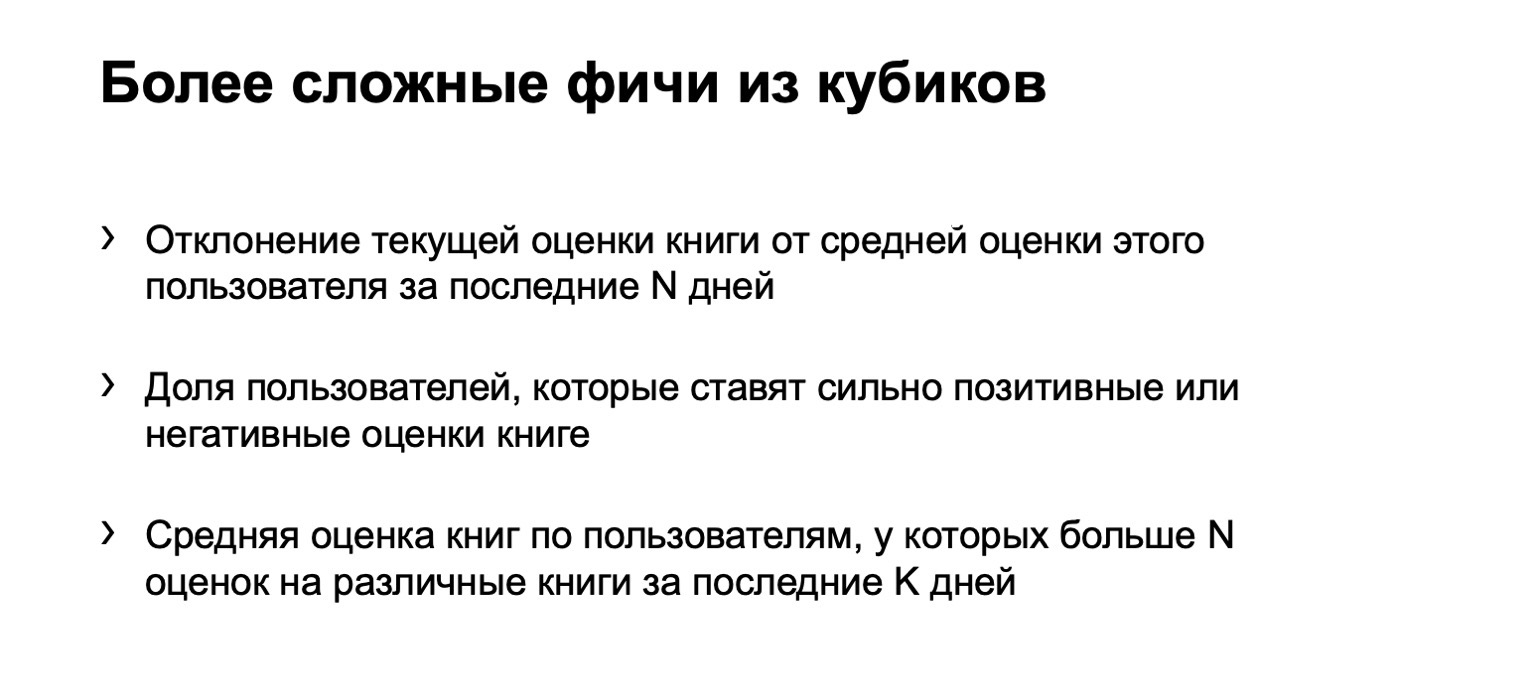
Having all these things, you can build more complex features from cubes. For example, the deviation of the book's current rating from the user's average rating. Or the proportion of users who rate a book very positively or very negatively. Also suspicious. Or the average book rating by users who have more than N ratings for different books. This is perhaps a more accurate and fair assessment from some point of view.
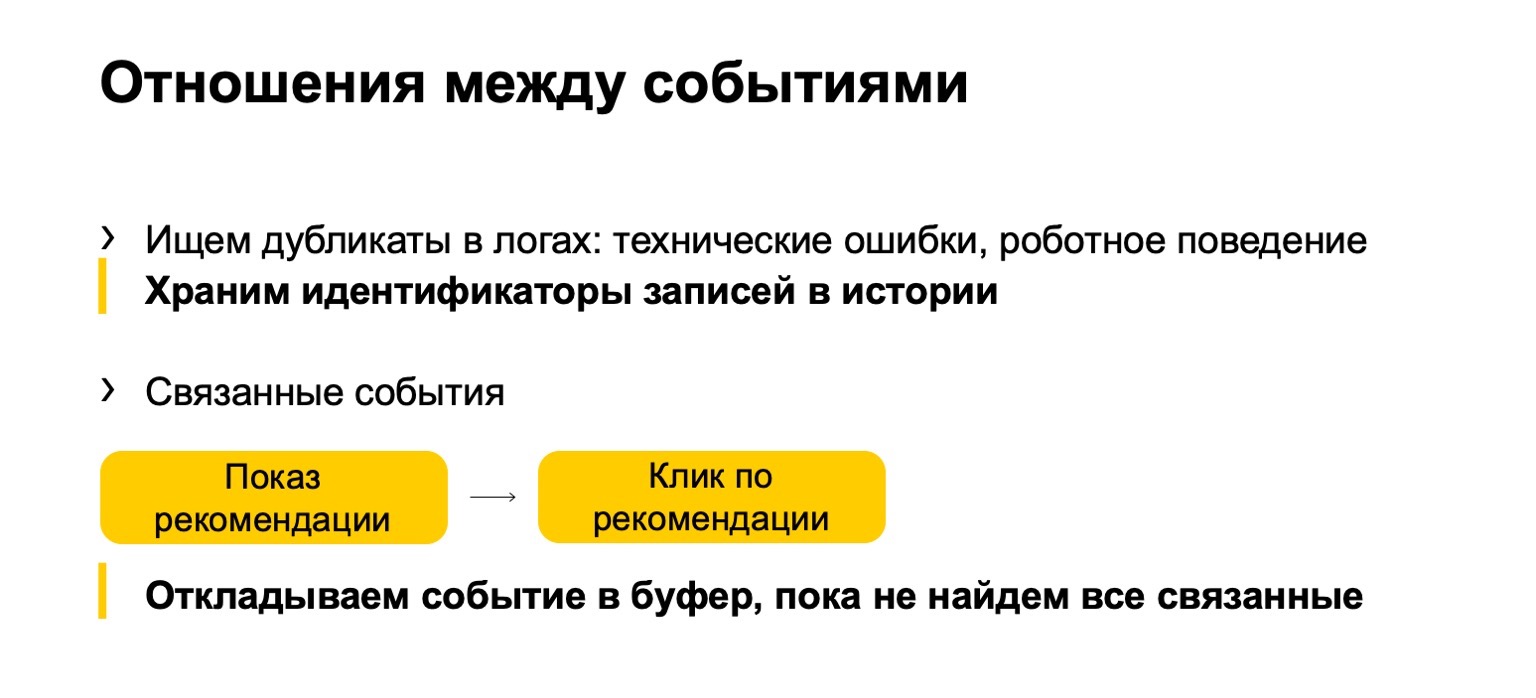
Added to this is what we call the relationship between events. Often duplicates appear in the logs or in the data that are sent to us. These can be either technical events or robotic behavior. We also find such duplicates. Or, for example, some related events. Let's say your system displays book recommendations, and users click on these recommendations. So that the final statistics that affect the ranking are not spoiled, we need to make sure that if we filter the impression, then we must also filter the click on the current recommendation.
But since our flow may come unevenly, first a click, we must postpone it until we see the show and accept a verdict based on it.
Feature description language
I'll tell you a little about the language used to describe all this.
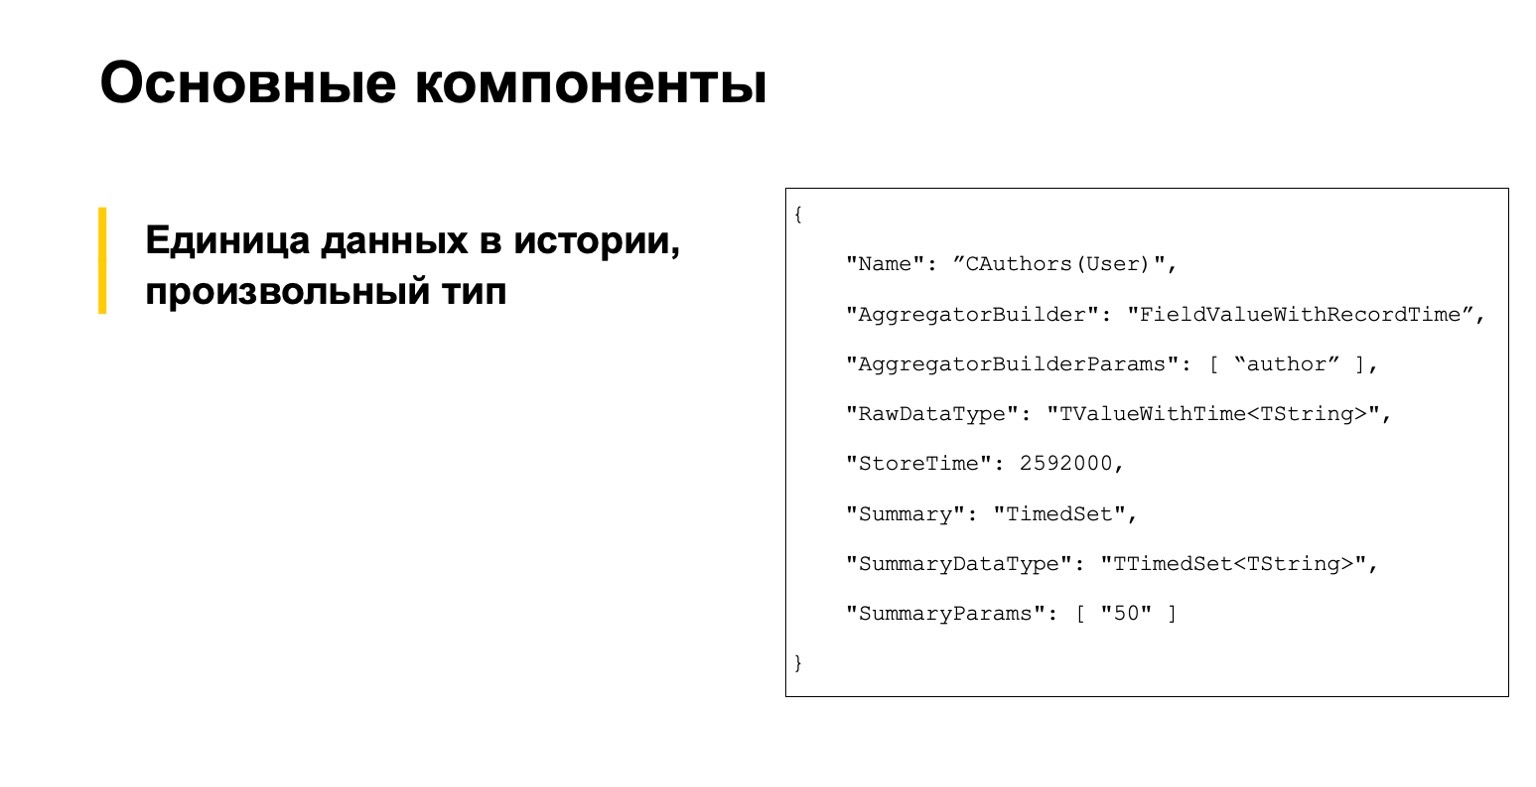
You don't have to read it, this is for example. We started with three main components. The first is a description of data units in history, generally speaking, of an arbitrary type.
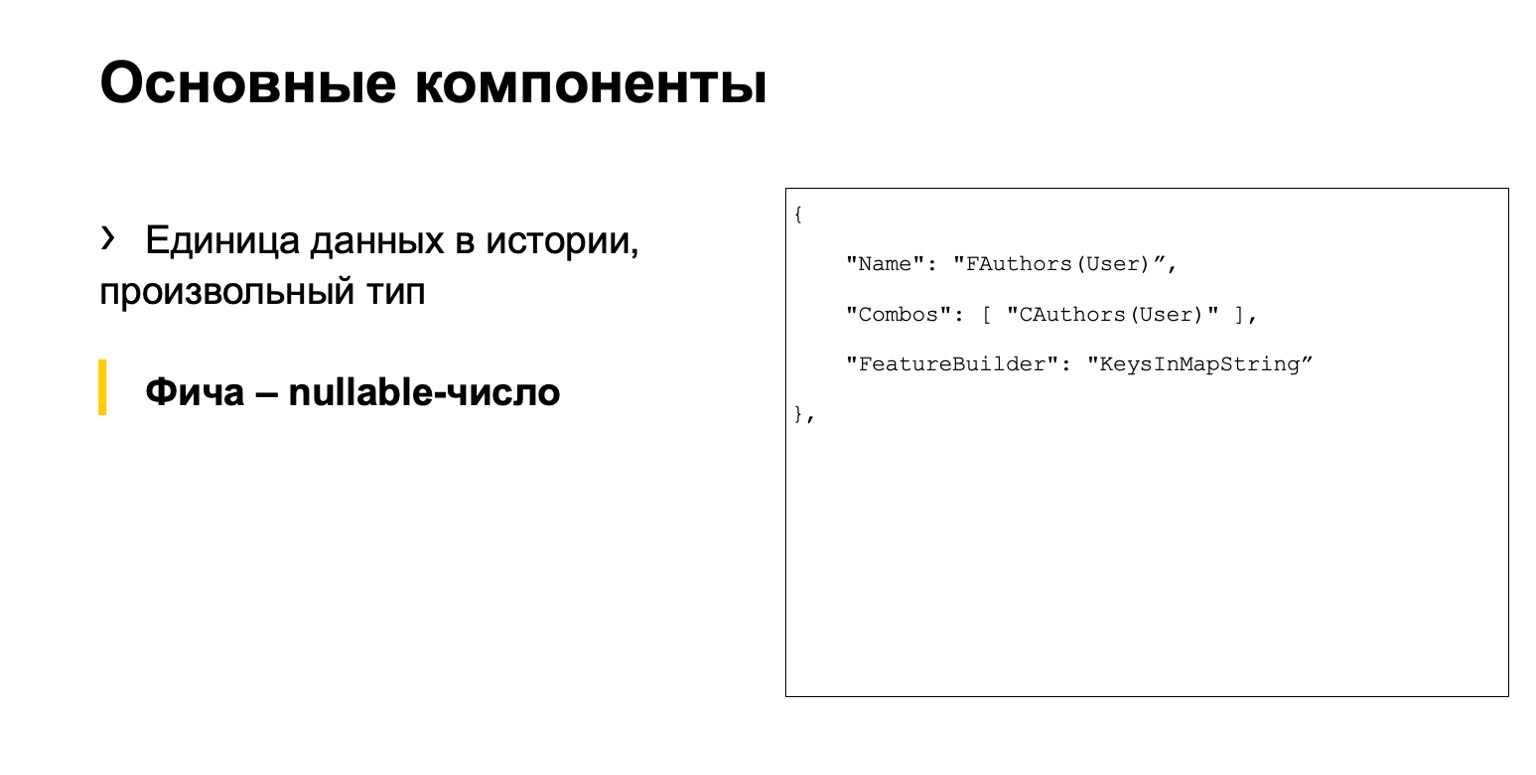
This is some kind of feature, a nullable number.
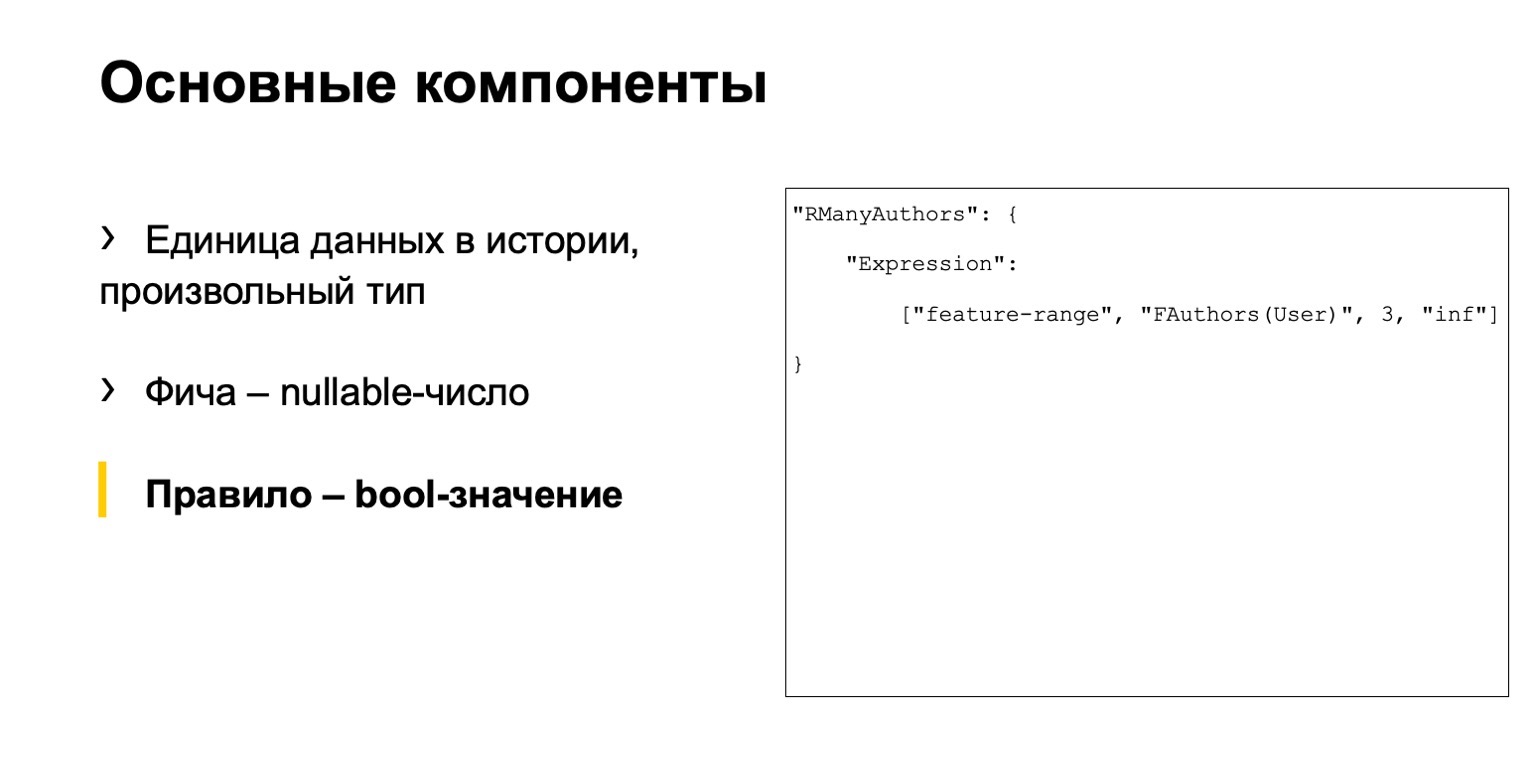
And some kind of rule. What do we call a rule? This is a set of conditions for these features and something else. We had three separate files.
The problem is that here one chain of actions is spread over different files. A large number of analysts need to work with our system. They were uncomfortable.
The language turns out to be imperative: we describe how to calculate the data, and not declarative, when we would describe what we need to calculate. This is also not very convenient, it is easy enough to make a mistake and a high entry threshold. New people come, but they don't quite understand how to work with it at all.
Solution - let's make our own DSL. It describes our scenario more clearly, it is easier for new people, it is more high-level. We took inspiration from SQLAlchemy, C # Linq and the like.
I will give a couple of examples similar to those I gave above.
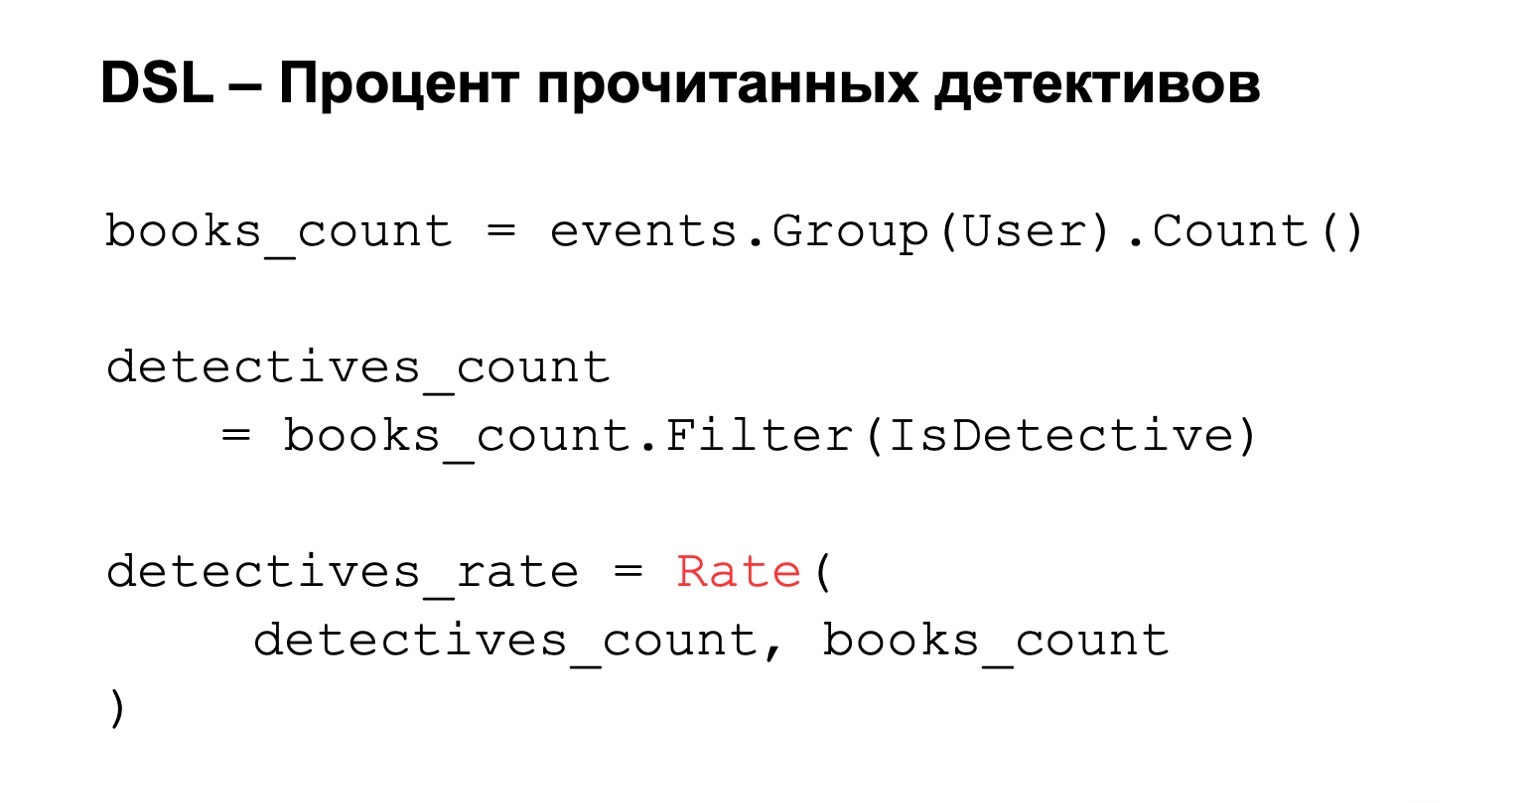
Percentage of detective stories read. We count the number of books read, that is, we group by user. We add filtering to this condition, and if we want to calculate the final percentage, we just calculate the rating. Everything is simple, clear and intuitive.
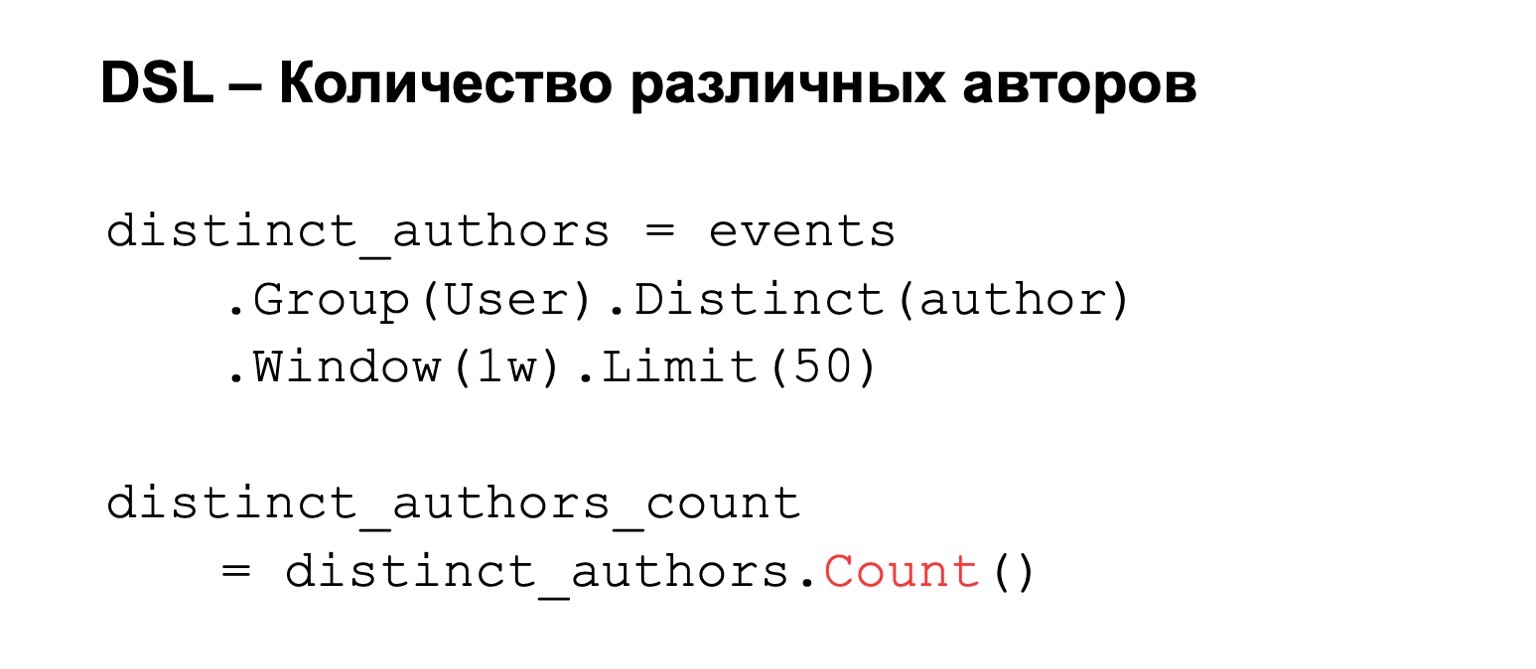
If we count the number of different authors, then we group by user, set distinct authors. To this we can add some conditions, for example, a calculation window or a limit on the number of values that we store due to memory constraints. As a result, we count count, the number of keys in it.
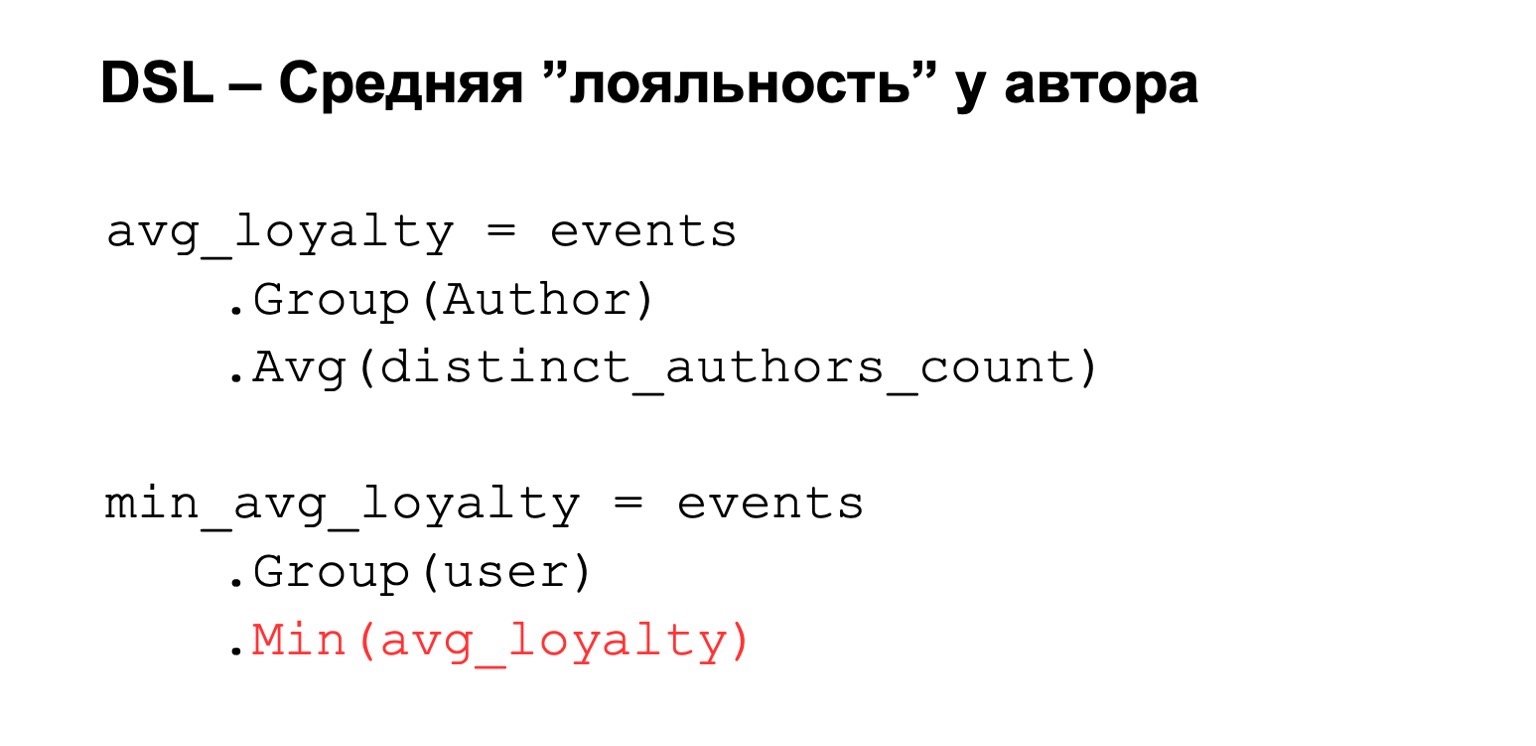
Or the average loyalty I was talking about. That is, again, we have some kind of expression calculated from above. We group by author and set some average value among these expressions. Then we narrow it back to the user.
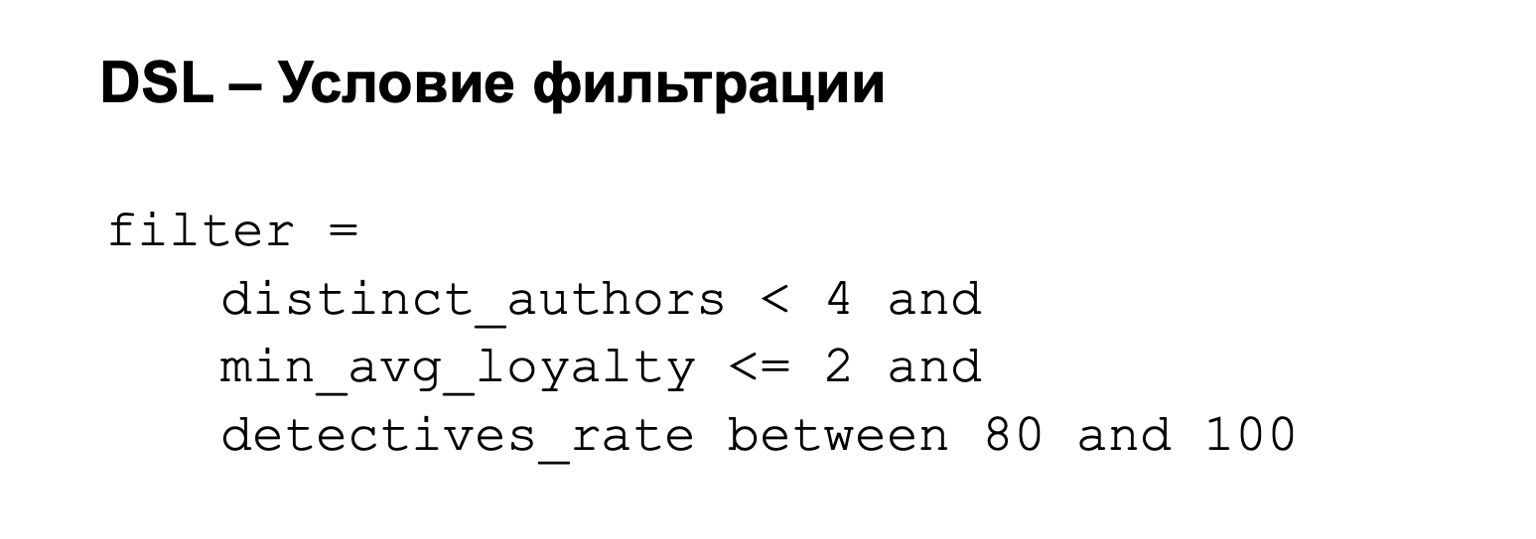
To this we can then add a filter condition. That is, our filter can be, for example, the following: loyalty is not too high and the percentage of detectives is between 80 out of 100.
What do we use for this under the hood?
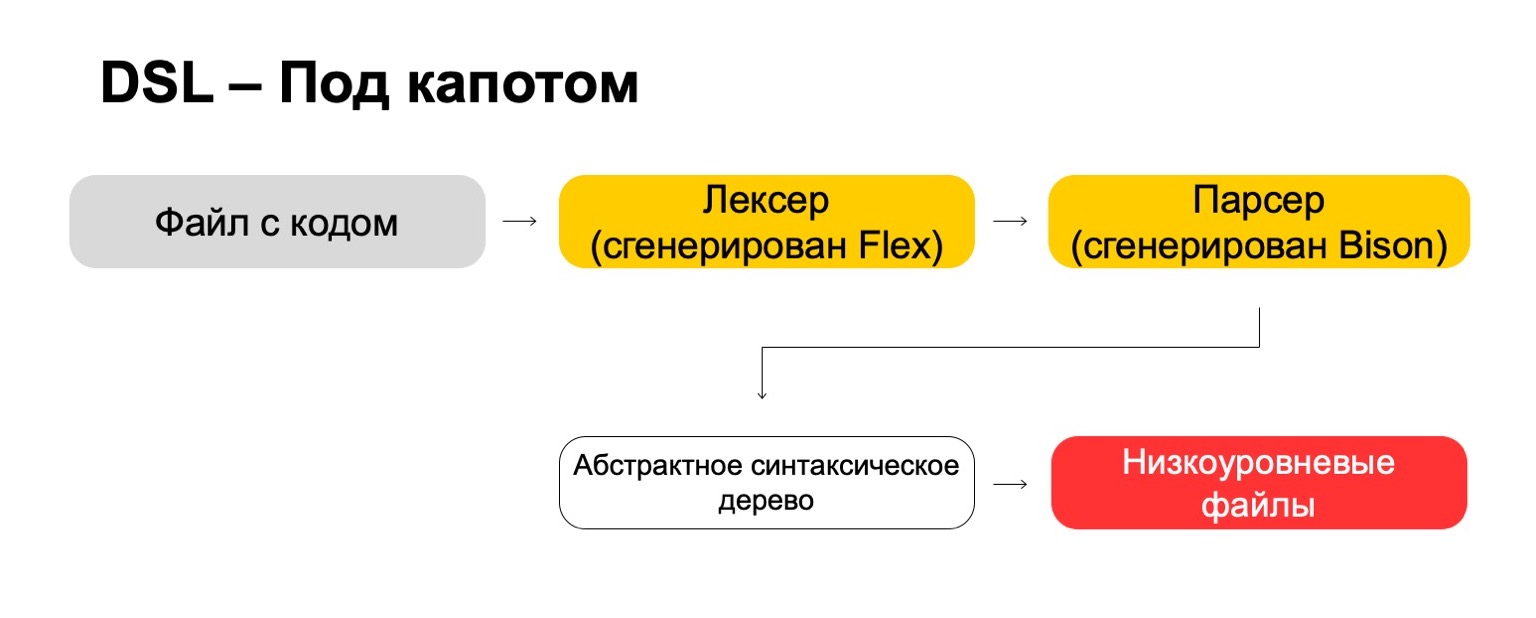
Under the hood, we use the most modern technologies directly from the 70s, such as Flex, Bison. Maybe you heard. They generate code. Our code file goes through our lexer, which is generated in Flex, and through the parser, which is generated in Bison. The lexer generates terminal symbols or words in the language, the parser generates syntax expressions.
From this we get an abstract syntax tree, with which we can already do transformations. And in the end, we turn it into low-level files that the system understands.
What is the result? This is more complicated than it might seem at first glance. It takes a lot of resources to think through the little things like priorities for operations, edge cases, and the like. You need to learn rare technologies that are unlikely to be useful to you in real life, unless you write compilers, of course. But in the end it's worth it. That is, if you, like us, have a large number of analysts who often come from other teams, then in the end this gives a significant advantage, because it becomes easier for them to work.
Reliability
Some services require fault tolerance: cross-DC and exactly-once processing. A violation can cause discrepancy in statistics and losses, including monetary losses. Our solution for MapReduce is such that we read the data at a time on only one cluster and synchronize it on the second.
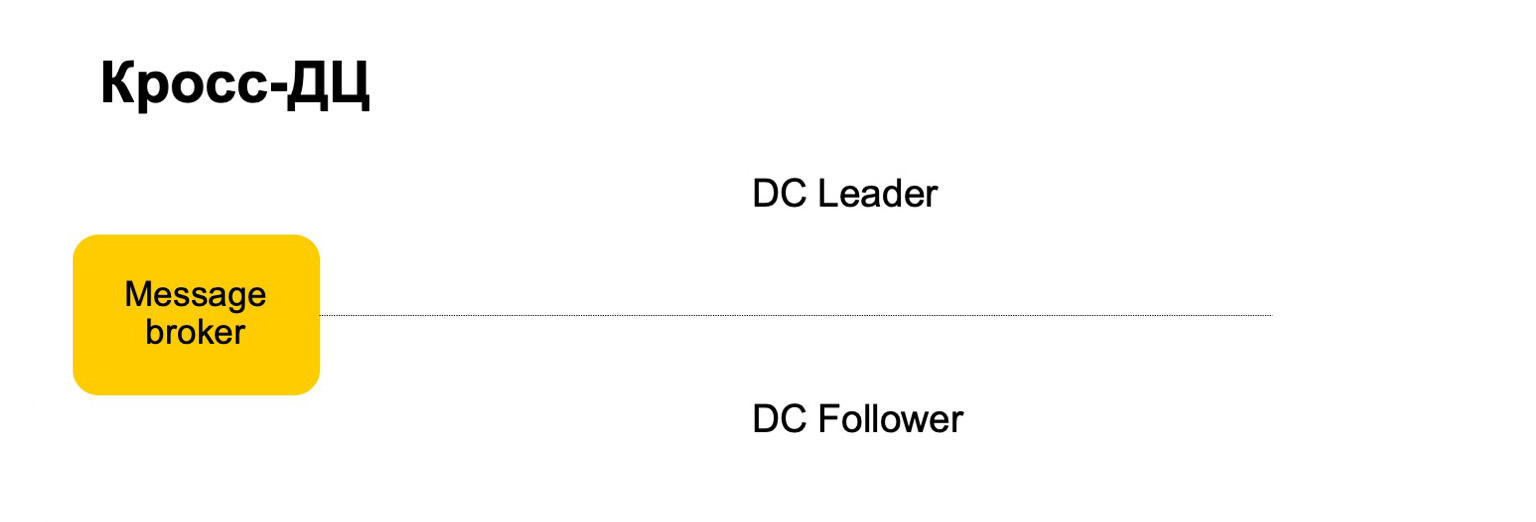
For example, how would we behave here? There is a leader, follower and message broker. It can be considered that this is a conditional kafka, although here, of course, its own implementation.
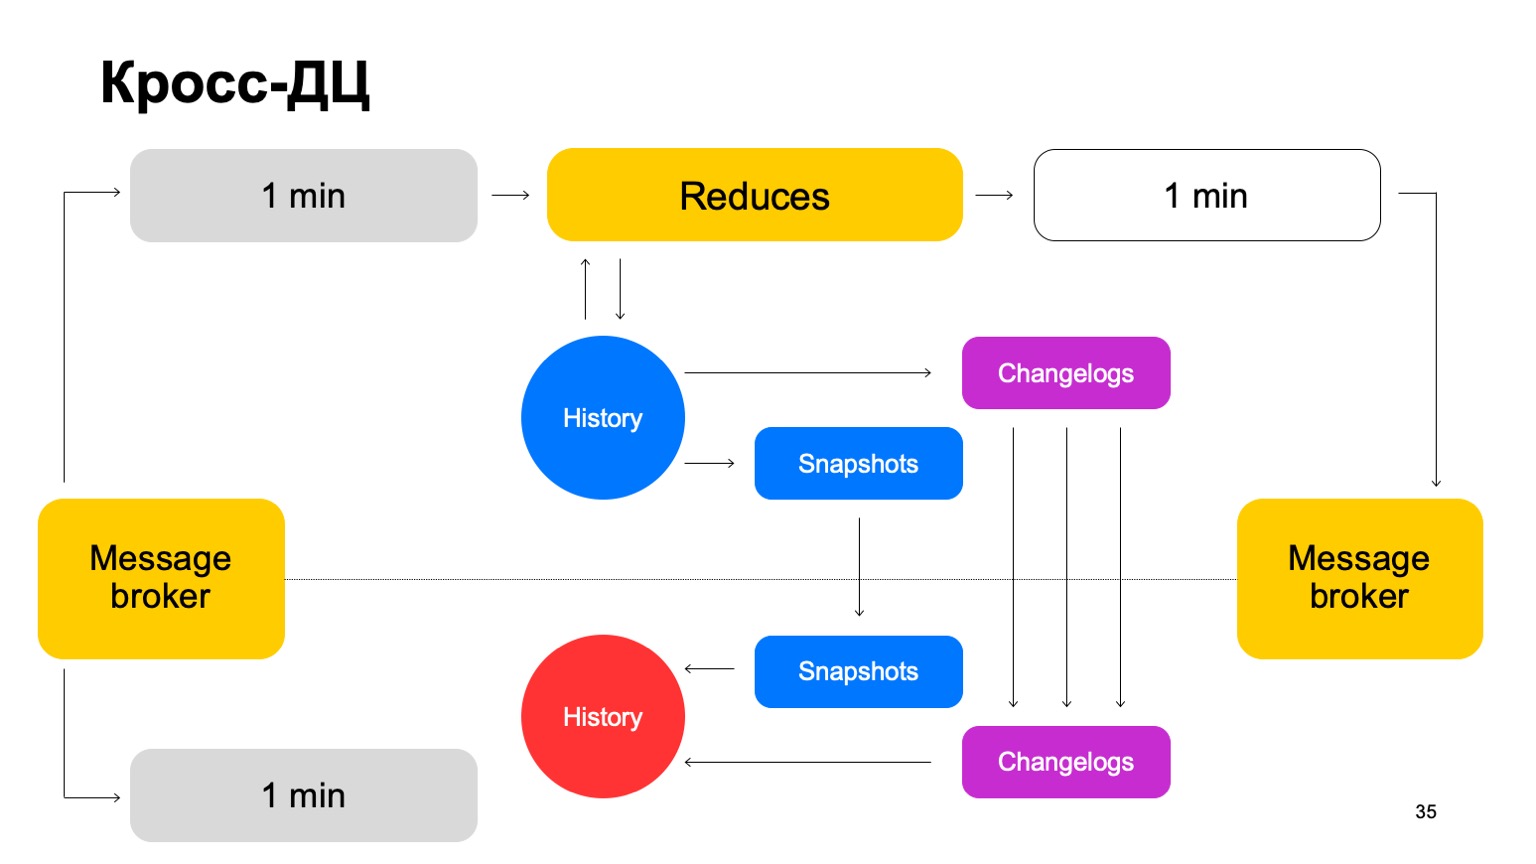
We deliver our batches to both clusters, launch a set of reductions on the same leader, accept the final verdicts, update the history and send the results back to the service to the message broker.
Once in a while, we naturally have to do replication. That is, we collect snapshots, collect changes - changes for each batch. We synchronize both to the second cluster follower. And also bringing up a story that is so hot. Let me remind you that history is kept in memory here.
Thus, if one DC for some reason becomes unavailable, we can quickly enough, with minimal lag, switch to the second cluster.
Why not count on two clusters in parallel at all? External data can differ on two clusters, they can be supplied by external services. What is external data anyway? This is something that rises from this higher level. That is, complex clustering and the like. Or just data auxiliary for calculations.
We need an agreed solution. If we count verdicts in parallel using different data and periodically switch between results from two different clusters, the consistency between them will drop dramatically. And, of course, saving resources. Since we use CPU resources on only one cluster at a time.
What about the second cluster? When we work, he is practically idle. Let's use his resources for a full-fledged pre-production. By full-fledged pre-production, I mean here a full-fledged installation that accepts the same data stream, works with the same data volumes, etc.
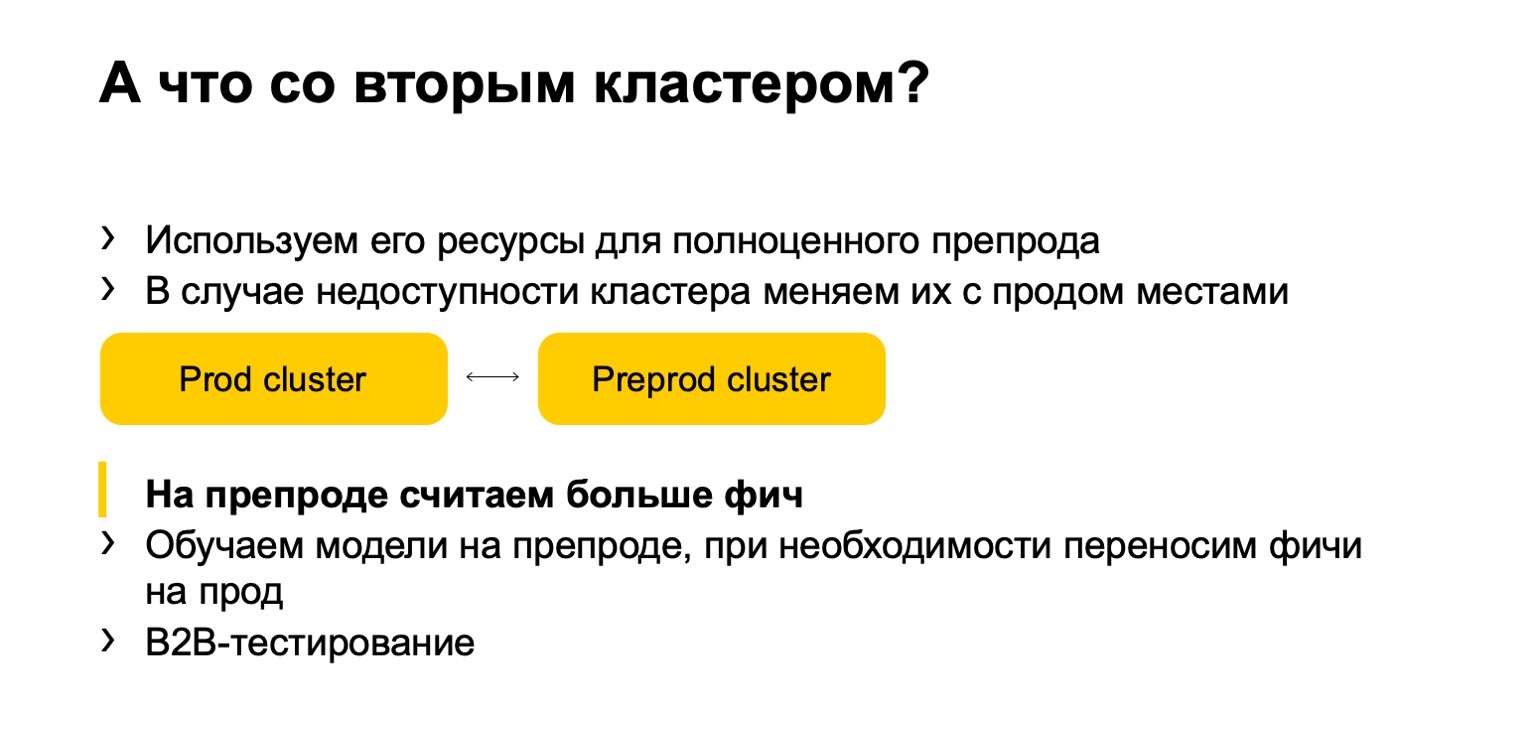
If the cluster is unavailable, we change these installations from sale to pre-production. Thus, we have a preprod for some time, but it's okay.
The advantage is that we can count more features on the preprocess. Why is this even necessary? Because it is clear that if we want to count a large amount of features, then we often do not need to count all of them on sale. There, we only count what is needed to obtain final verdicts.
(00:25:12)
But at the same time, we have a kind of hot cache at the preprocess, large, with a wide variety of features. In case of an attack, we can use it to close the problem and transfer these features to production.
Added to this are the benefits of B2B testing. That is, we all roll out, of course, first for pre-sale. We fully compare any differences, and, thus, we will not be mistaken, we minimize the likelihood that we can make a mistake when rolling out for sale.
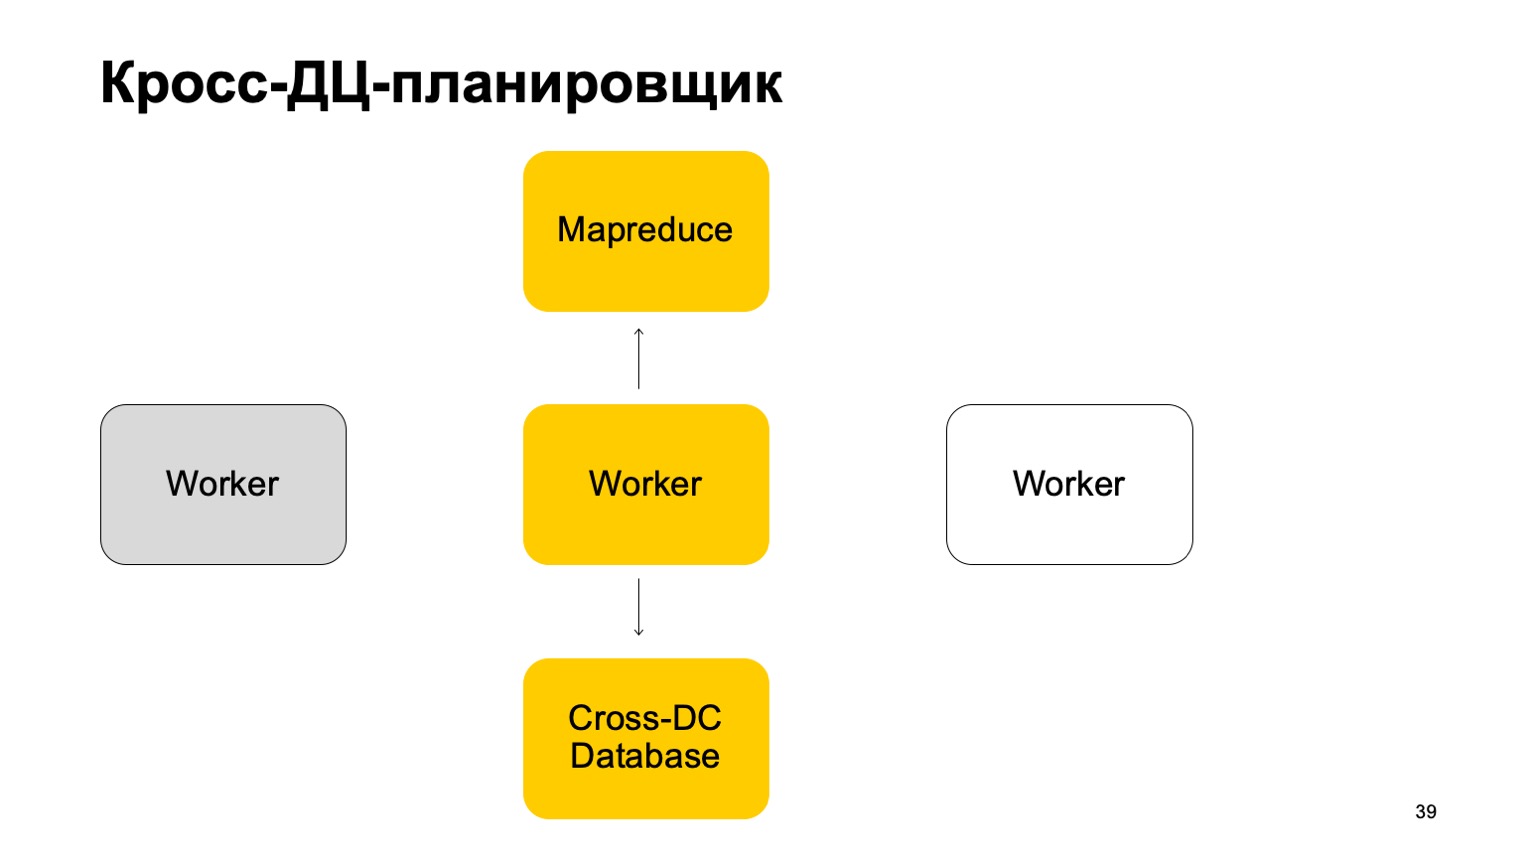
A little about the scheduler. It is clear that we have some kind of machines that run the task in MapReduce. These are some kind of workers. They regularly sync their data to the Cross-DC Database. This is just the state of what they have managed to calculate at the moment.
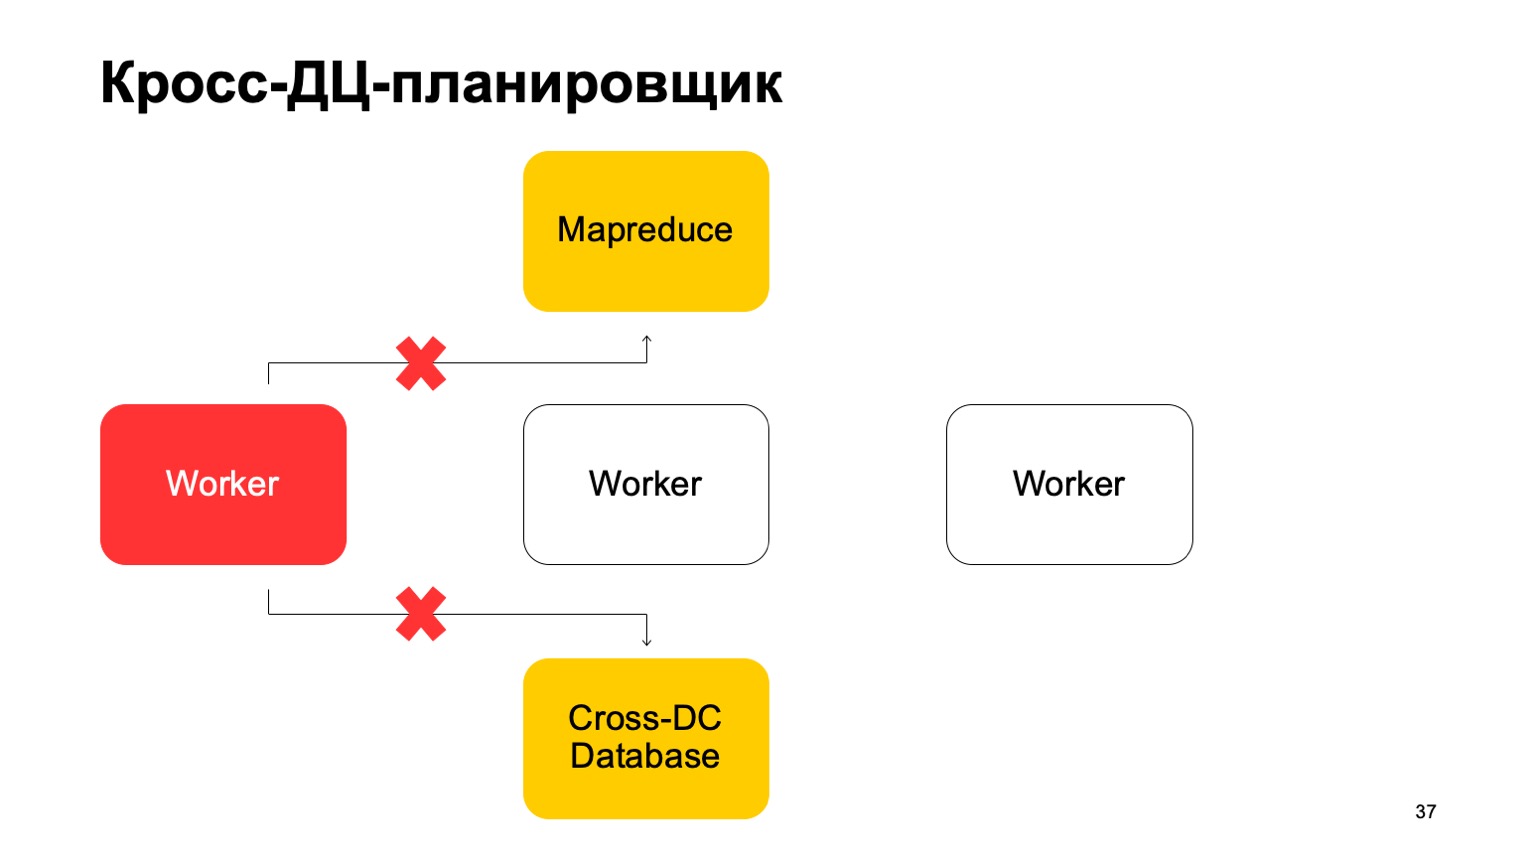
If a worker becomes unavailable, then another worker tries to capture the log, take the state.
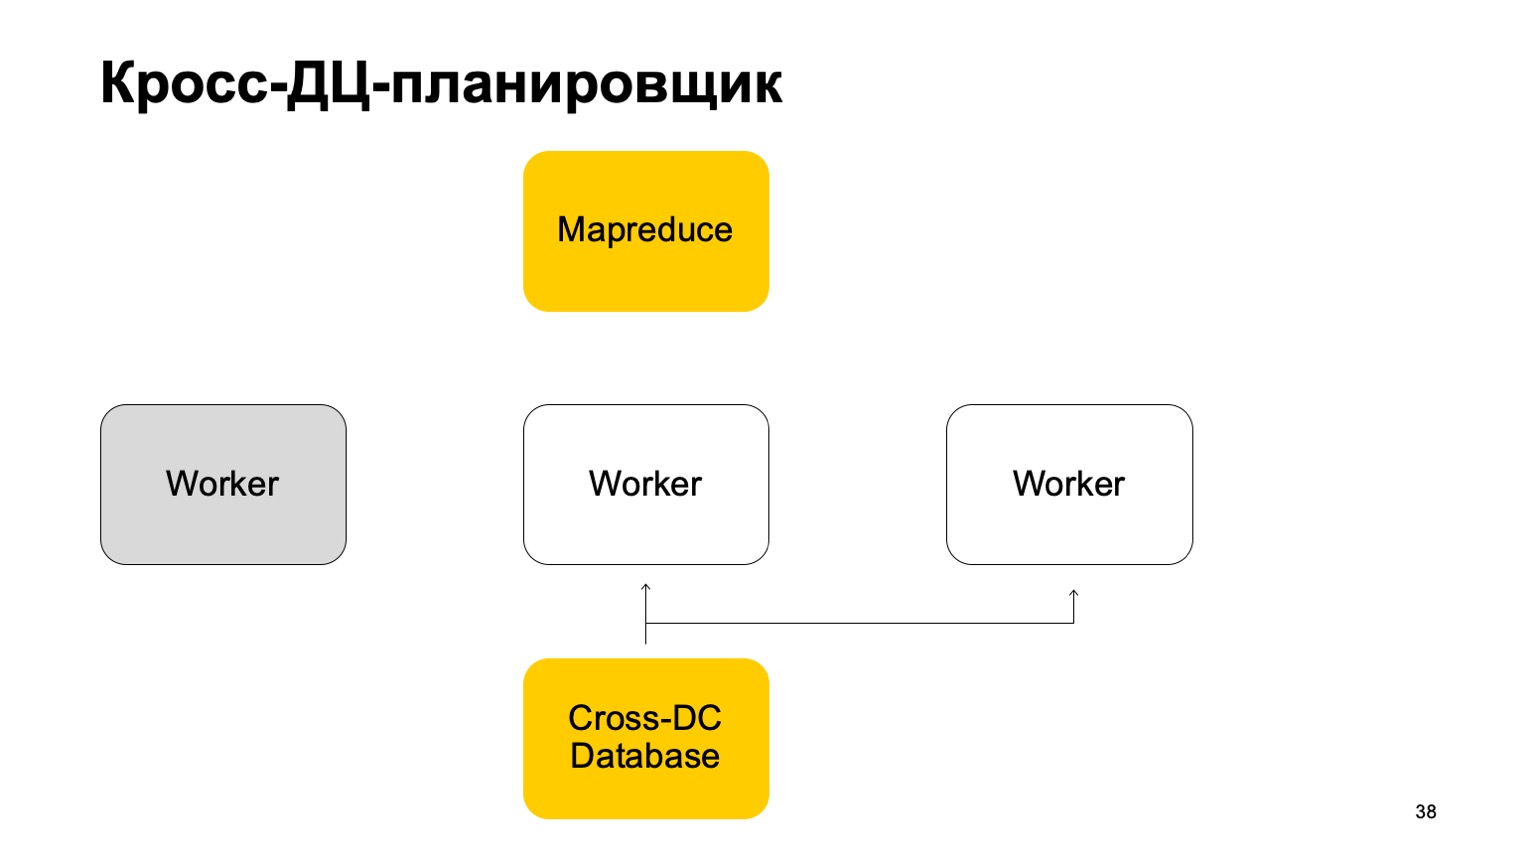
Get up from it and continue working. Continue setting tasks on this MapReduce.
It is clear that in case of overriding these tasks, some of them may be restarted. Therefore, there is a very important property for us here: idempotency, the ability to restart each operation without consequences.
That is, all the code must be written in such a way that this works fine.
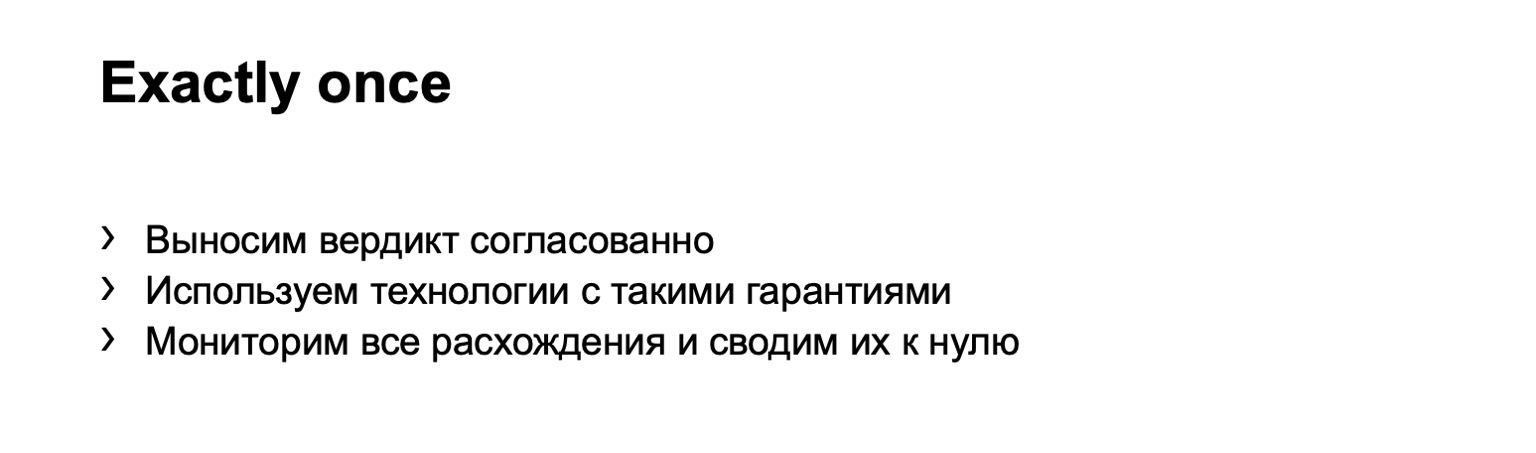
I'll tell you a little about exactly-once. We are reaching a verdict in concert, this is very important. We use technologies that give us such guarantees, and, naturally, we monitor all discrepancies, we reduce them to zero. Even when it seems that this has already been reduced, from time to time a very tricky problem arises that we did not take into account.
Instruments
Very briefly about the tools we use. Maintaining multiple antifrauds for different systems is a difficult task. We have literally dozens of different services, we need some kind of single place where you can see the state of their work at the moment.
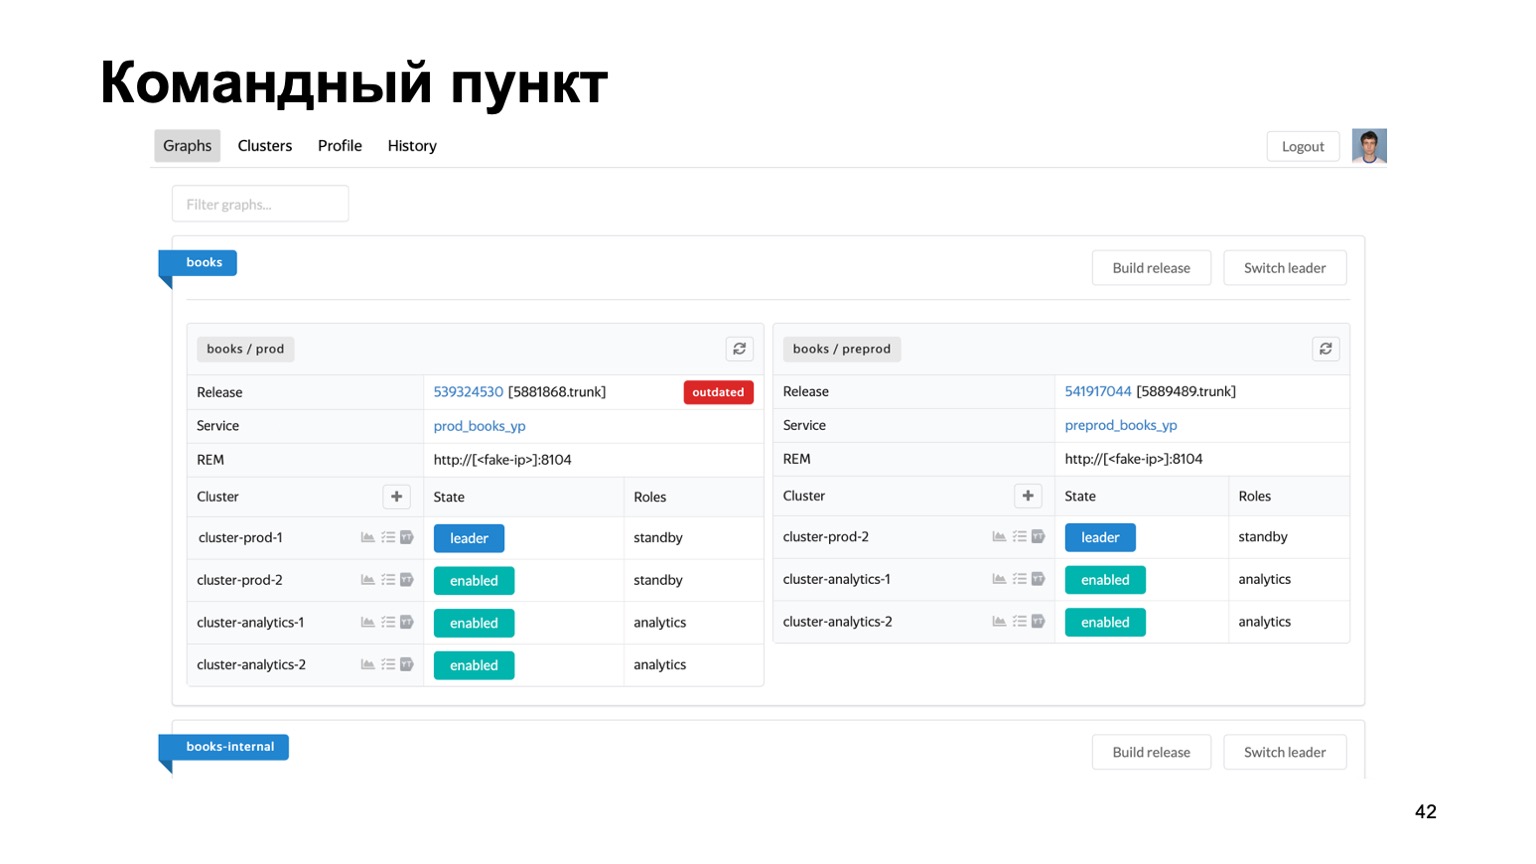
Here is our command post, where you can see the status of the clusters with which we are currently working. You can switch them between each other, roll out a release, etc.
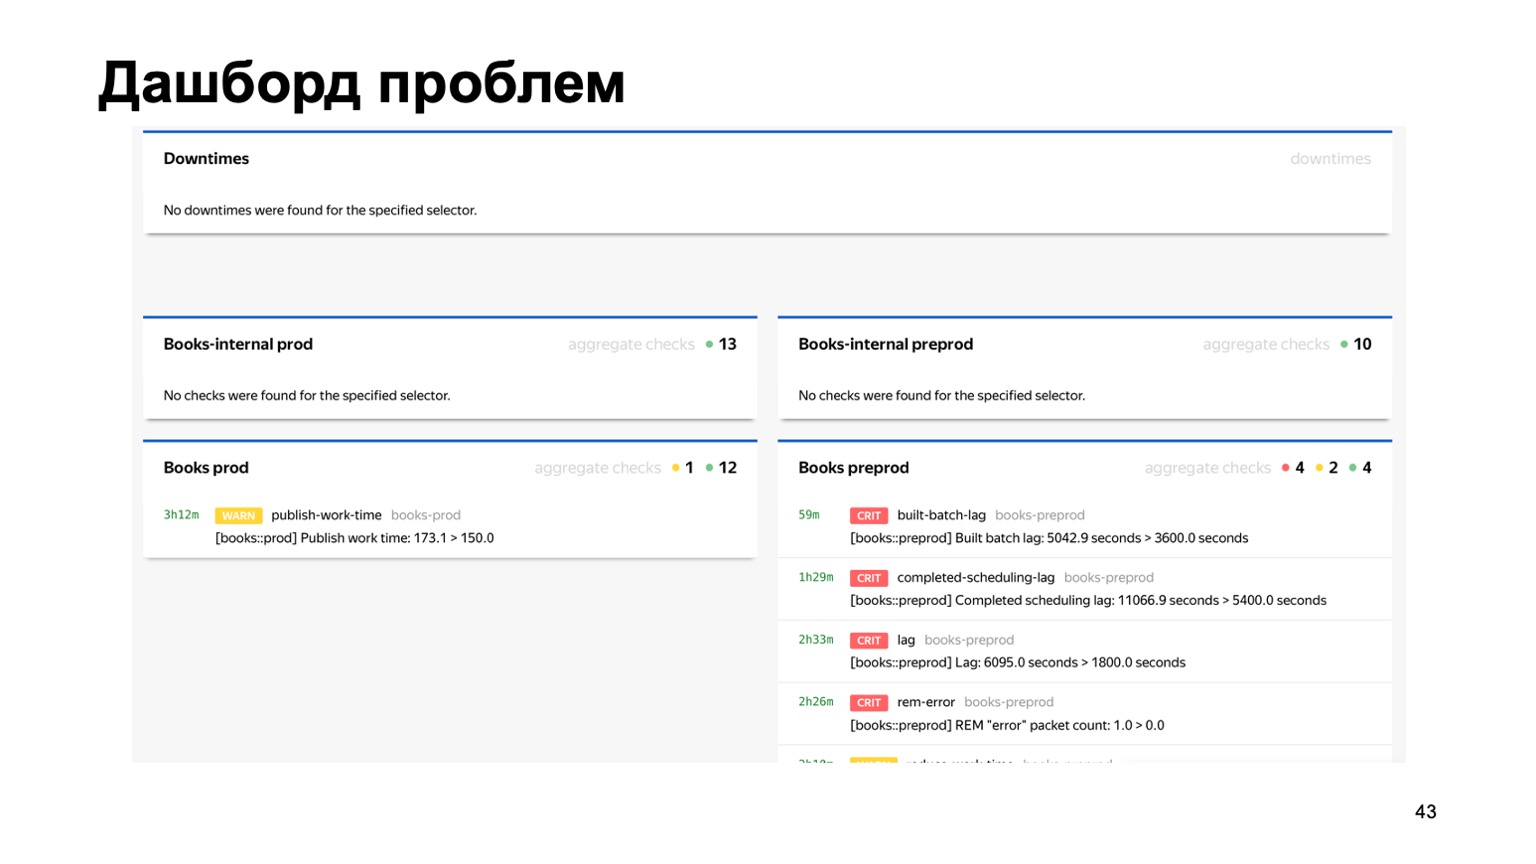
Or, for example, a dashboard of problems, where we immediately see on one page all the problems of all antifrauds of different services that are connected to us. Here you can see that something is clearly wrong with our Book service at the moment. But monitoring will work, and the person on duty will look at it.
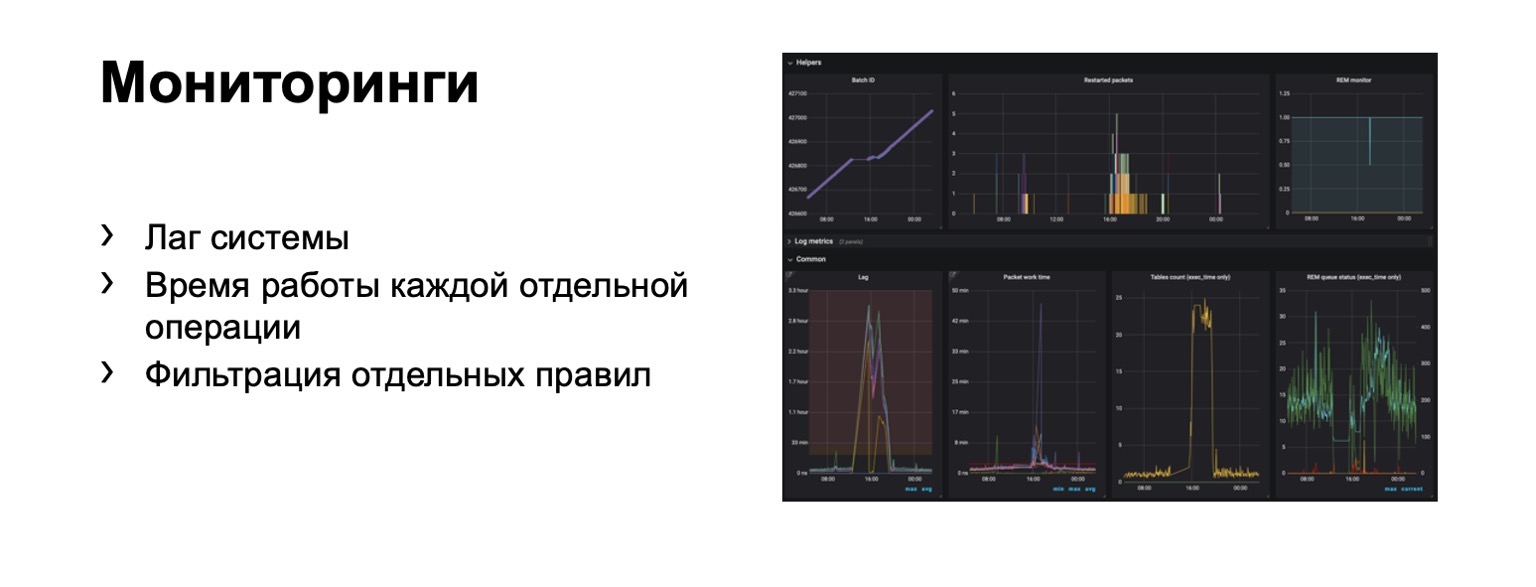
What are we monitoring at all? Obviously, system lag is extremely important. Obviously, the running time of each individual stage and, of course, the filtering of individual rules. This is a business requirement.
Hundreds of graphs and dashboards appear. For example, on this dashboard, you can see that the contour was bad enough now that we got a significant lag.
Speed
I'll tell you about the transition to the online part. The problem here is that the lag in a full circuit can reach a few minutes. It's in the outline on MapReduce. In some cases, we need to ban, detect fraudsters faster.
What could it be? For example, our service now has the ability to buy books. And at the same time, a new type of payment fraud has appeared. You need to react to it faster. The question arises - how to transfer this whole scheme, ideally preserving as much as possible the language of interaction familiar to analysts? Let's try to transfer it "to the forehead".
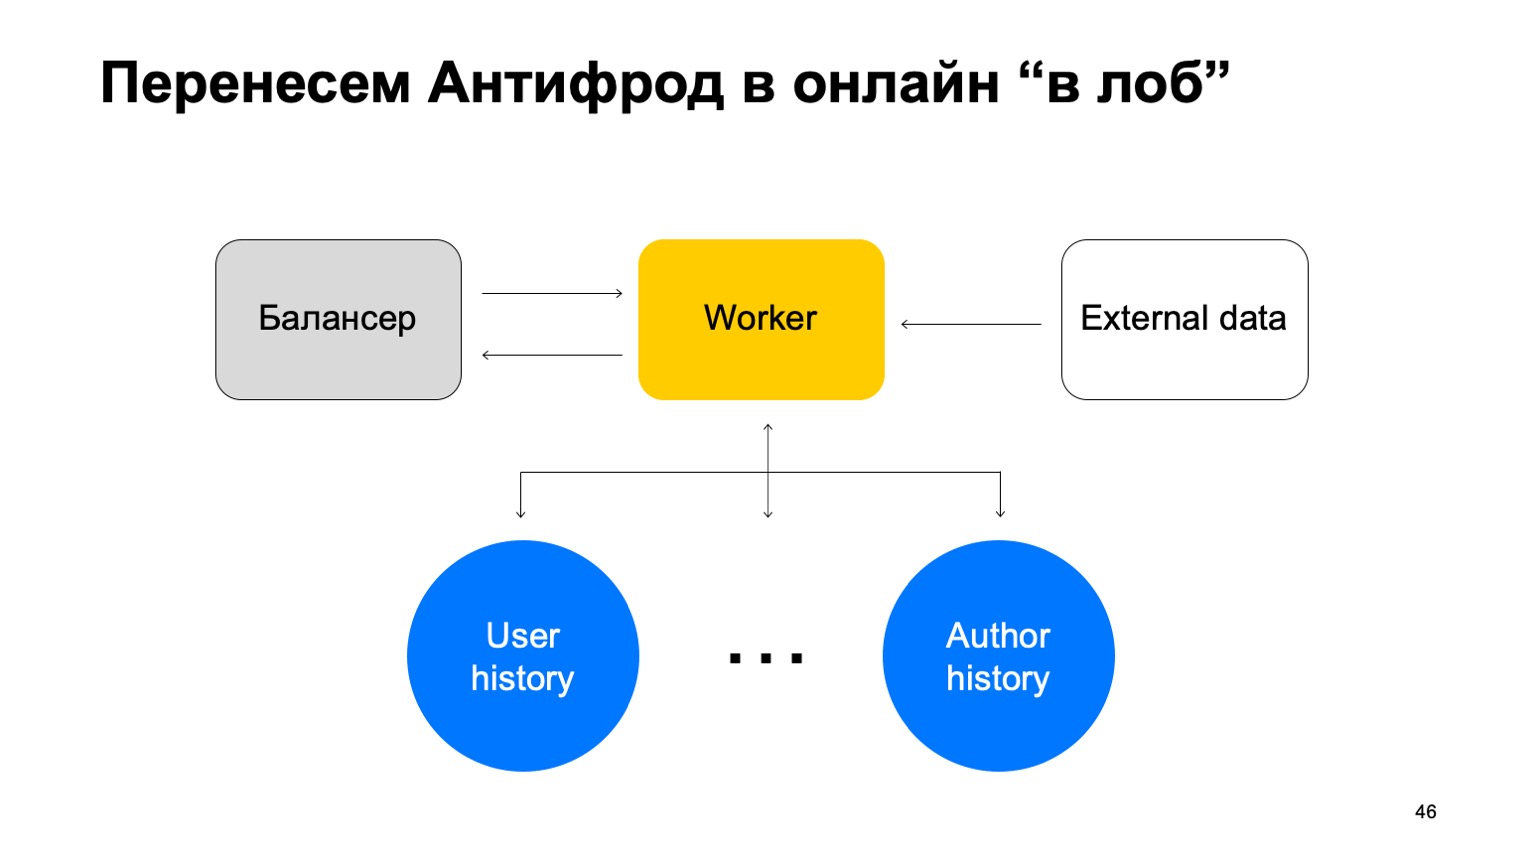
Let's say we have a balancer with data from the service and a certain number of workers to which we shard data from the balancer. There are external data that we use here, they are very important, and a set of these stories. Let me remind you that each such story is different for different reductions, because it has different keys.
The following problem may arise in such a scheme.
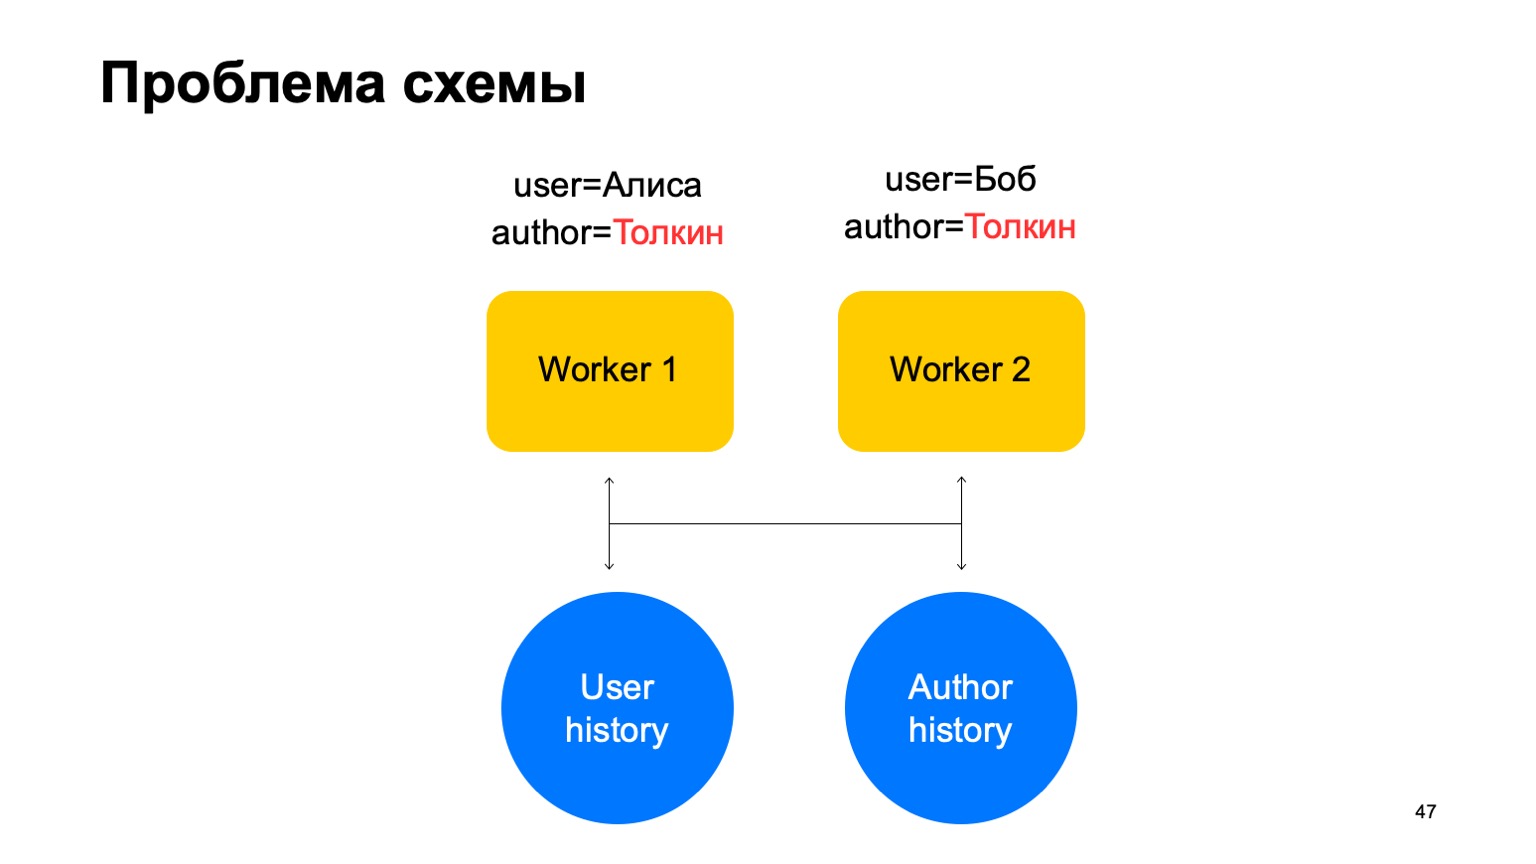
Let's say we have two events on our worker. In this case, with any sharding of these workers, a situation may arise when one key gets to different workers. In this case, this is the author Tolkien, he got into two workers.
Then we read data from this key-value storage to both workers from history, we will update it in different ways and a race will arise when we try to write back.
Solution: Let's make the assumption that read and write can be separated, that writing can take place with a slight delay. This is usually not very important. By a small delay, I mean units of seconds here. This is important, in particular, because our implementation of this key-value store takes longer to write data than read it.
We will update statistics with a lag. On average, this works more or less well, given the fact that we will keep cached state on the machines.
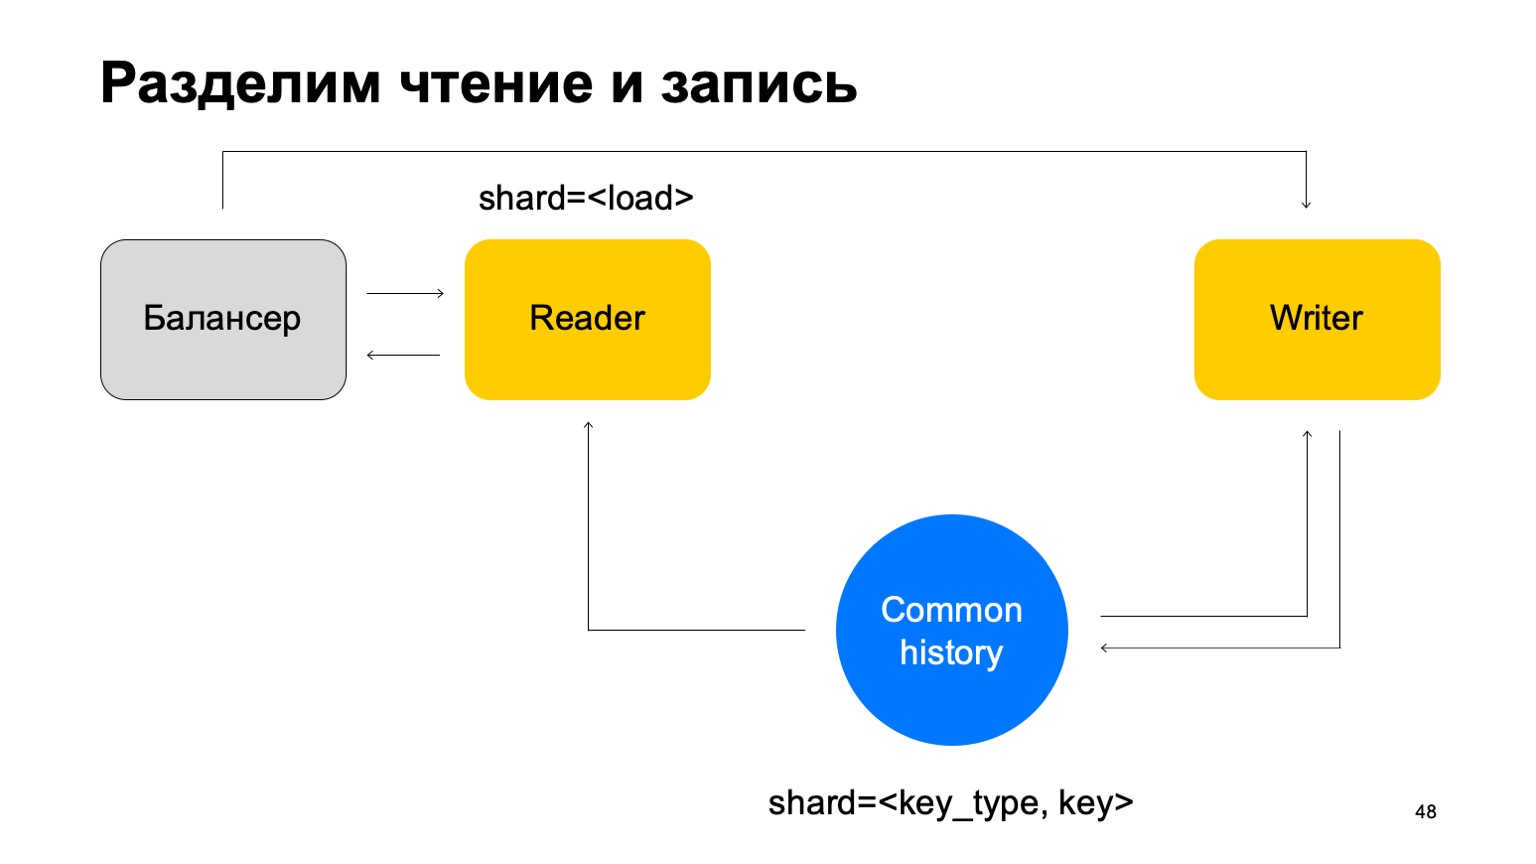
And another thing. For simplicity, let's merge these stories into one and jot down it by the type and key of the cut. We have some kind of common history.
Then we will add the balancer again, add the readers' machines, which can be sharded in any way - for example, simply by load. They will simply read this data, accept the final verdicts and return them to the balancer.
In this case, we need a set of writers machines to which this data will be sent directly. Writers will update the story accordingly. But here the problem still arises, which I wrote about above. Let's change the structure of the writer a little then.
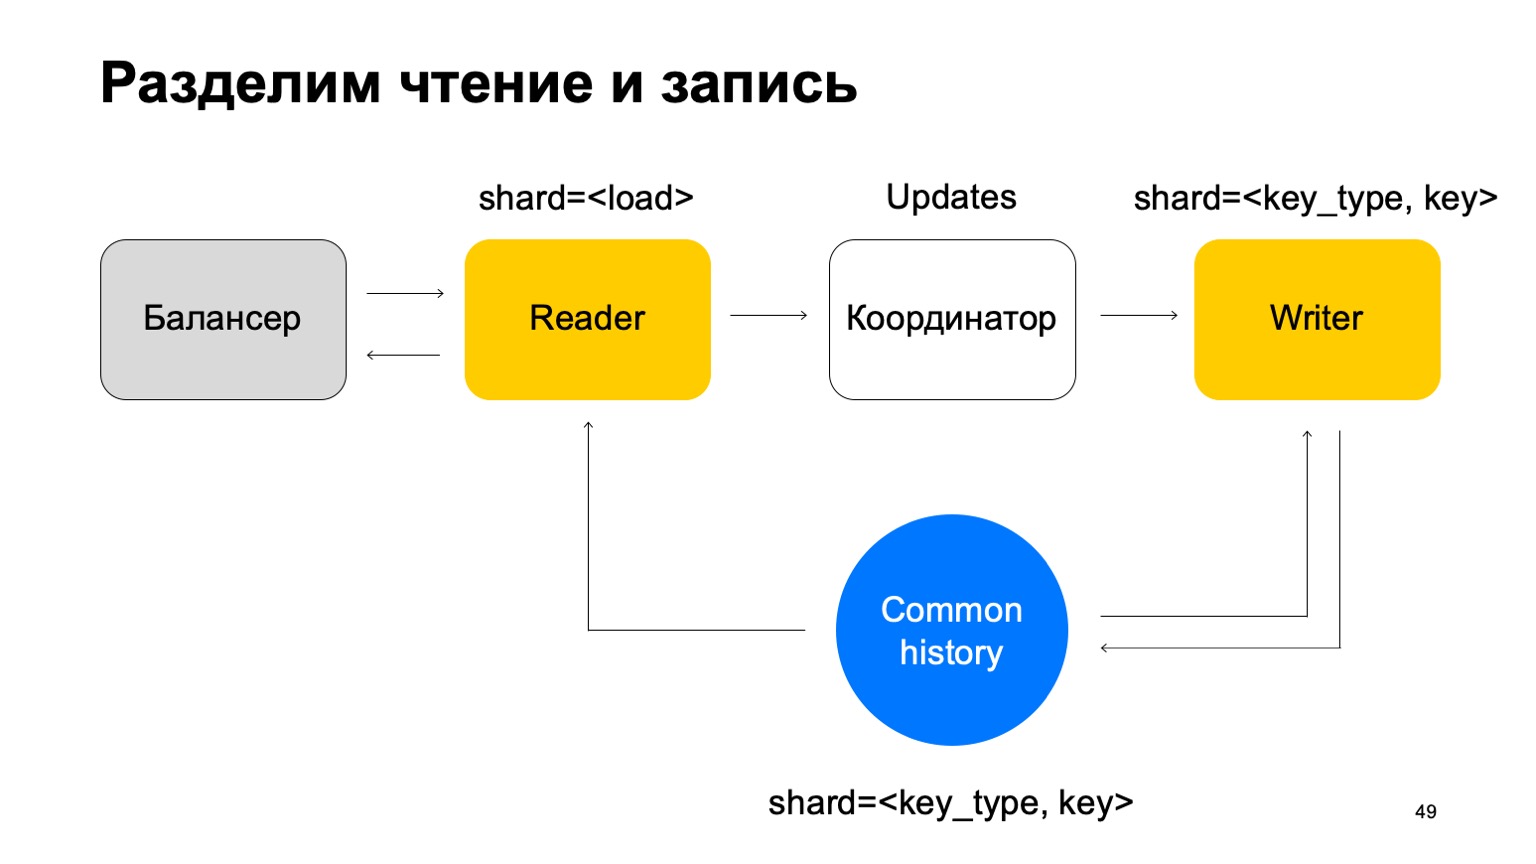
We will make it so that it is sharded in the same way as the history - by the type and value of the key. In this case, when its sharding is the same as history, we will not have the problem I mentioned above.
Here his mission changes. He no longer accepts verdicts. Instead, it just accepts updates from the Reader, mixes them up, and applies them correctly to history.
It is clear that a component is needed here, a coordinator that distributes these updates between readers and writers.
To this, of course, is added the fact that the worker needs to maintain an up-to-date cache. As a result, it turns out that we are responsible for hundreds of milliseconds, sometimes less, and we update statistics in a second. In general it works well, for services it is enough.
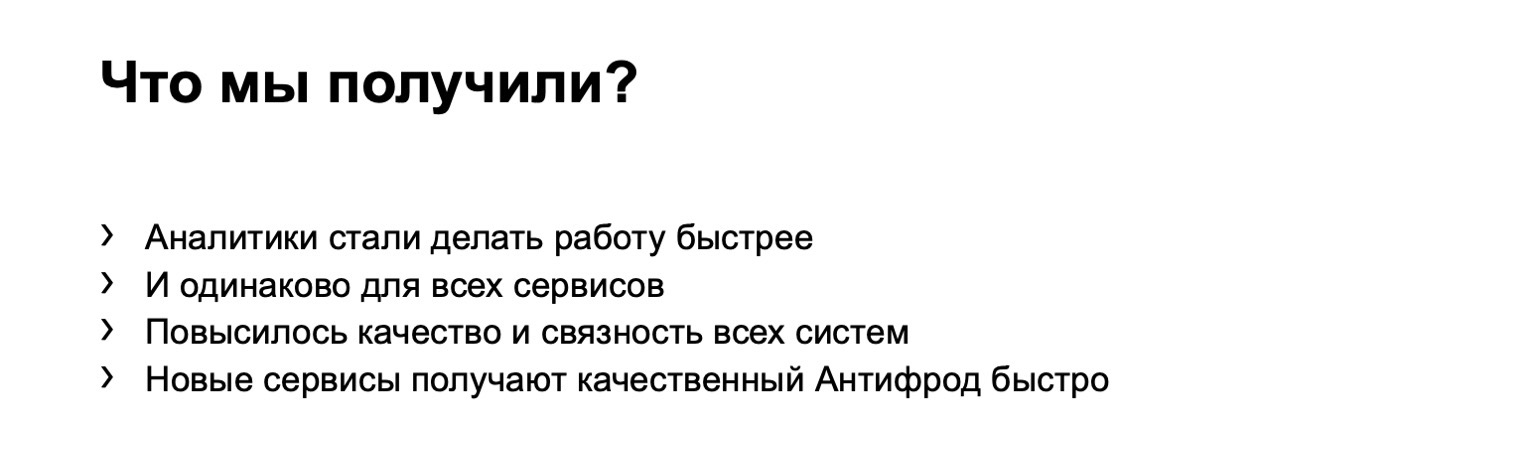
What did we get at all? Analysts began to do their jobs faster and in the same way for all services. This has improved the quality and connectivity of all systems. You can reuse data between anti-frauds of different services, and new services get high-quality anti-fraud quickly.

A couple of thoughts at the end. If you write something like that, immediately think about the convenience of analysts in terms of support and extensibility of these systems. Make everything configurable, you need it. Sometimes the cross-DC and exactly-once properties are difficult to achieve, but they can. If you think you have already achieved it, double-check it. Thanks for your attention.