
What is cohort analysis?
Let's consider in detail the definition of "cohort analysis". The concept of “cohort” dates back to the second century BC. They designated one of the main tactical units of the Roman army. The literal translation of the word is a fenced-in place.
In the context of this article, refers to a segment of the target audience or a group of people who performed an action in a certain period of time (for example, July 1 or 5). The temporal trait is very important, since it is it that distinguishes a cohort from a simple segment.
Users are grouped into one group based on common characteristics, experience, and timing. But we must understand that over time, the general attributes of people can change a lot. For example, today a client bought gingerbread cookies, a week later he ordered car rims, and a month later he bought a boat.
Cohorts in marketing do not represent a homogeneous target audience: newcomers to a site or service, regular users, temporary visitors, etc. At first glance, it seems that these are completely different groups, but using this tool, marketers combine them into several cohorts (the Roman army consisted of 10).
For example, a user came to the site from contextual advertising on July 17 and bought a window. It can be included in three groups at once:
- Users who came from contextual advertising. Helps to determine the effectiveness of the context compared to other customer acquisition channels.
- Customers who bought a window in July. Allows you to determine the seasonality of sales.
- Buyers of the goods "window". Helps in determining the demand for a specific product from different target audience groups.
The essence of cohort analysis is combining customers (users, visitors) into groups according to the same characteristics or attributes and tracking their behavior over time.
What can be done with cohort analysis?
Analyzing user behavior over time provides valuable insights into the effectiveness of advertising campaigns. In particular, it is possible to determine the impact of different marketing tools on key business indicators: LTV, conversions, ROI, Retention Rate, CAC, etc. Let's look at a few illustrative examples from practice of what was achieved using cohort analysis.
Accurate assessment of advertising effectiveness
Not all people make the decision to buy quickly. Someone doubts, someone has not fully decided whether he really needs the product or not, someone wants to consider alternative options in other stores, etc. That is, a potential client who has come today, for example, from contextual advertising, may not immediately take the targeted action.
Due to the long sales cycle, marketers are not always able to objectively assess the effectiveness and return on investment of advertising channels. Let's look at a small example of the value of using cohort analysis.
For example, in February 2020, we launched contextual advertising in Yandex. A month passed, we decided to analyze the first results, calculated the ROI, and it turned out to be below 100%. An inexperienced marketer will decide to "roll up" the ad or redesign ads.
But if you combine the potential customers who came from this ad campaign into a cohort and look at the results after a few months, you can see completely different numbers:
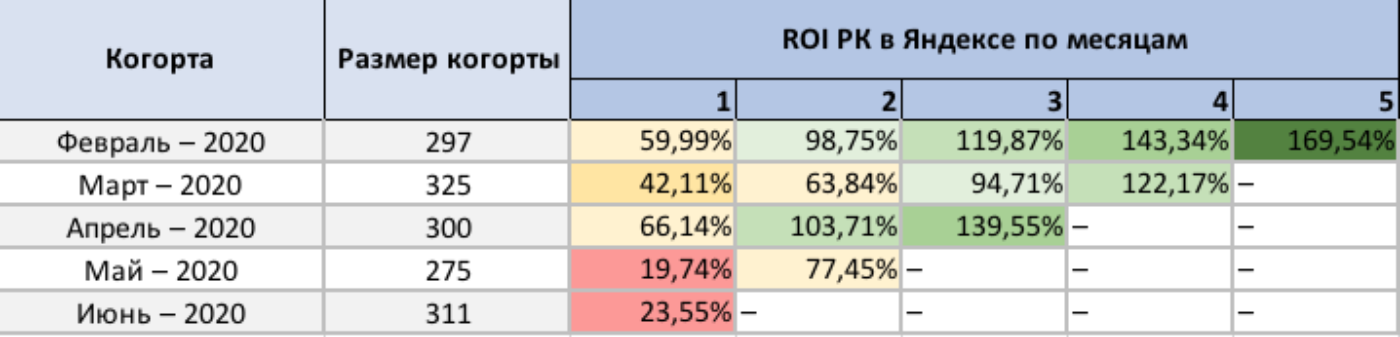
It took some buyers 5 months to make a decision! Tracking user behavior over time made it possible to more accurately assess the effectiveness of an advertising campaign. Such a "picture" is more typical for a company with a long sales cycle and / or expensive products.
Finding and retaining loyal customers
You can find out which advertising channels are generating the most loyal customers. For example, let's create a cohort of users with the first authorization from February to July and divide it into smaller groups according to the acquisition channel. Then, every month, we evaluate the groups according to the Retention Rate or Repeat Purchase Rates.
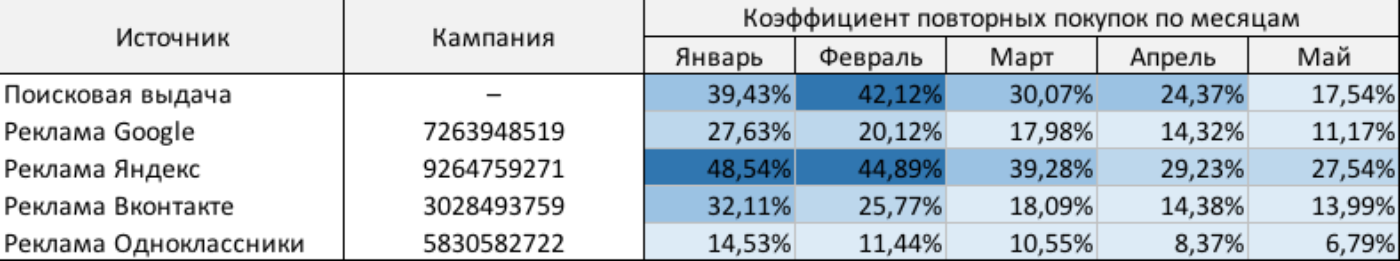
This data makes it easy to identify the best sources of loyal customers. Therefore, we can continue to invest more money in them and grow our loyal customer base faster.
The analysis is carried out constantly to determine the points of "heating" the audience. For example, one of the coefficients of a popular source began to decline. A letter is sent to the users of the group with a personal discount (any other action is possible) and the coefficient grows again. It is difficult to perform such a trick with high precision without a cohort analysis.
Forecasting and increasing LTV
LTV (Lifetime Value) is the customer's lifetime value or income received from him during the entire period of cooperation. Usually this indicator is calculated after the end of the joint work.
But nothing prevents you from estimating LTV for individual cohorts for a certain period of time (for example, for a month) and predicting the indicator for subsequent periods.
You can also compare the lifetime value of customers and the cost of acquiring them through advertising channels. So you will receive information about the payback periods of the channels and understand which one is worth investing more resources in.
A / B testing
A / B tests are used to test ideas and hypotheses. For example, let's say you decided to update the text of a sales page. As part of testing, you make two options (with the old content and the new one) and send some part of the audience to the updated version to evaluate the conversion. See in which case it is higher, and make a decision on further actions.
The problems of A / B testing in this situation are the inability to predict in the long term. Cohort analysis can help eliminate the gap. A month after the end of testing, build a report on users who first entered the site through the updated landing page and compare the metrics with the cohort of people who did not see the new text.
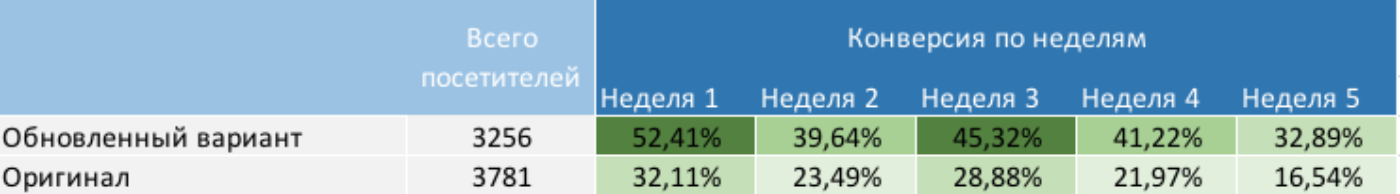
The resulting difference is the real impact of the updated text on conversions. This will help you understand the long-term effect of your decision.
Analysis of the effectiveness of a mobile application
Cohort analysis is widely used when rolling out new versions of applications. It is used to estimate the user return rate (Retention Rate). Also, marketers use a tool to analyze the most effective advertising channels. And these are not the only examples of the use of cohorts in the work on mobile applications: everything is limited by imagination and analytical skills.
Where is cohort analysis used?
The previous section described a few examples of the tool's use, but in what areas is it most commonly used? It is primarily useful in companies tied to the number of customers. User churn affects their profitability the most.
Do not refuse to use cohort analysis and organizations with a large number of regular customers. He is sent to evaluate marketing actions, the results of which allow improving advertising campaigns and correctly reallocating the budget.
In general, the use of cohort analysis is useful for any business. But below we will consider several of the most popular applications.
Formation of a portrait of the target client
By collecting information from different cohorts about users, over time you can build an accurate portrait of your target audience. Assessment of loyalty, seasonality, readiness for online shopping, etc. - all this allows you to understand who is interested in the product and most often buys it.
Conversion increase
Often, split testing is used to test hypotheses and ideas. Yes, it gives certain results for making objective decisions, but the cohort analysis in this regard is better and gives more accurate data, since different groups of the target audience are considered.
A / B testing is also a useful tool, but it evaluates one indicator, and the “trailer” cohort analysis pulls information about two more parameters - time and place.
For example, we determine the optimal color of a button on a selling landing page. Split testing showed that 45% of customers click green more often and 55% click blue more.
We connect the cohort by month (time) and place and find out that potential clients from Sochi are better off clicking the green button, because they are already tired of the blue sea color, they have been seeing it all their lives.
This is a simple but clear example of better understanding the target audience through the use of cohort analysis. Deeper data helps you generate more ideas and grow your business faster.
SaaS
In cloud projects, cohort analysis is used to optimize the sales cycle. Let's say there is a service with a trial period, trial version and paid tariffs. The company's management monitors key metrics: income and expenses. Cohorts are made up of users of the trial period and trial version.
Next, an analyst enters the work, who determines: who often switches to paid versions, what tariffs they choose, outflows of users for certain periods, etc. All of this is valuable information to help you optimize the sales cycle and maximize your SaaS service revenue.
Key indicators of cohort analysis
As they learn to use cohort analysis, analysts are encouraged to consider all possible metrics to gain practical experience. But in real work, to achieve maximum efficiency, they focus on target (most important) indicators.
There is no universal set of metrics; the choice of the list depends on the specific product and business industry. However, there are a number of indicators that are considered in most cases:
- Control point (Stick Point). The purchase amount, after which the customer is more likely to move into the “permanent” category.
- Attraction channels. Determine the most effective sources of new potential customers.
- Users switch from a trial version of a product to a paid version. Cohort analysis helps to determine the groups from which most often “free” customers turn into “paid” ones.
- Repeat purchases. The indicator indicates that the user liked the quality of the product and is ready to pay for it in the future.
The analyst's job is not only to organize the cohort analysis and assess the results obtained, but also to determine the target indicators. If you choose metrics that are irrelevant for a particular business, the collected data will be useless and will not be used to improve the organization's performance.
What is needed for a cohort analysis?
Before conducting a cohort analysis, four parameters are determined:
- — , : , , , ..
- — : , , .
- — .
- : ROI, Retention Rate, LTV ..
These four parameters are the pillars of cohort analysis and are determined when working in any system.
Note that the first and last parameters are interconnected: the attribute is determined after the selection of the analyzed key indicator. For example, when evaluating the repeat purchase rate, the "first purchase" is selected as a feature.
But again, do not drive yourself into a rigid framework, because each project is individual. The analyst is guided by his own experience, knowledge and working tools.
By the way, there may be several signs. Cohorts are created according to the firm's current needs and upcoming analysis. The analyst also determines the second and third parameters based on the tasks assigned to him.
How to Conduct Cohort Analysis in Google Analytics?
Let's talk about a tool that helps you conduct cohort analysis. Most suitable for newbies is Google Analytics. To get started, go to the system page -> "Audience" -> "Cohort analysis".

At the top, you can configure the four main parameters, which were discussed in the previous section of the article.
So far, the system is in beta testing, so the functions are available with restrictions:
- cohorts are formed only on the first visit (sign);
- one analysis - one indicator (14 available in total);
- cohort size - day, week, month (standard);
- reporting period for days - 30 days, for weeks - 12 weeks, for months - 3 months (you cannot choose the duration yourself);
- you cannot filter data by parameters, only the use of segments is available.
Despite significant limitations, the system is already suitable for full use. After beta testing is over, analysts will be able to conduct cohort analysis of online projects in an automated manner.
A visualization of the analyzed indicator is also available: under the project settings there is a graph for all users and three groups to choose from.
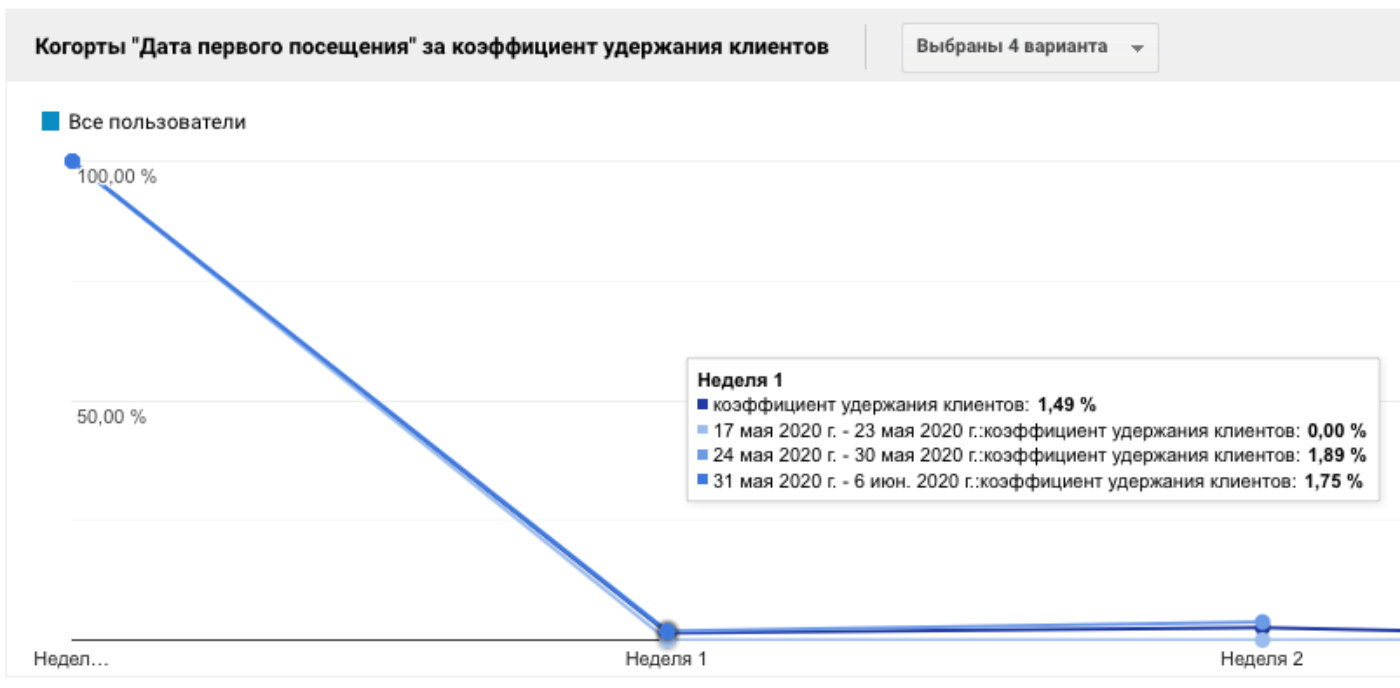
In our case, according to the graph, we understand that the overall customer retention rate is 1.49%, and for the group of users who visited the site for the first time between May 31 and June 6, it is 1.75%. Below the graph is a summary table with data for each cohort for the entire reporting period. It is identical to the one shown at the beginning of the article, only here it is generated automatically, and not by "pens" in Excel.
At this stage of development, the system is suitable for analyzing small projects. You can make changes to the service, improve offers for customers, etc. and track customer retention rates. If it grows, then the right decisions are being made.
What services are there for compiling cohort reports?
Let's consider other services that generate reports on cohort analysis. They are found in many advertising and analytical systems, so it is often difficult for a novice analyst to choose the best option. AppsFlyer
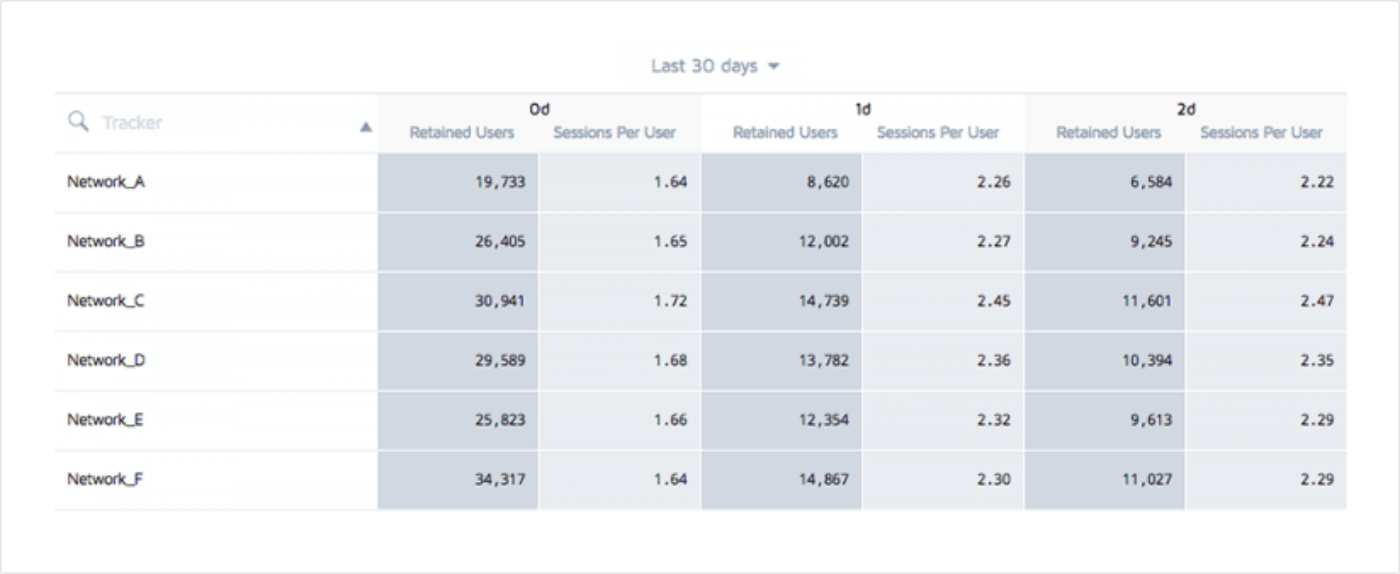
offers more flexible settings (compared to Google Analytics) for mobile marketing - several filters can be included in the report at once, which allows you to get more valuable information. In order not to spend a lot of time analyzing small groups, they set a limit on the number of users. App developers use AppMetrica and Adjust to analyze new user returns. In the second service, it is possible to add a second indicator to the report (for example, the number of sessions per user):
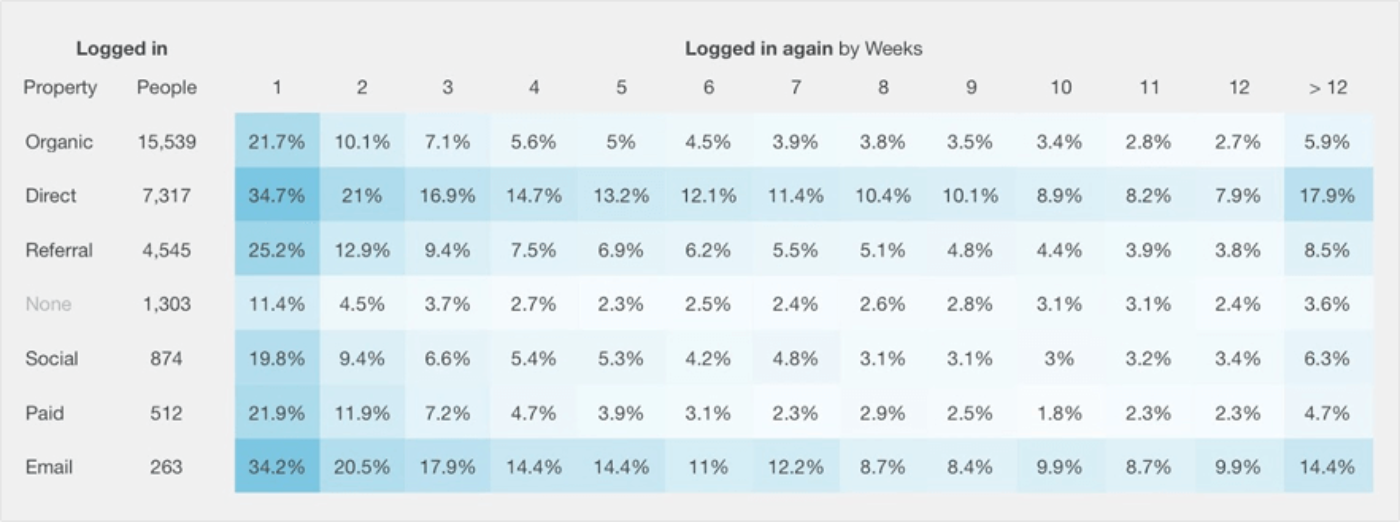
Another popular system for cohort analysis of apps and websites is Kissmetrics. A distinctive feature is the ability to form a cohort based on two characteristics at once. For example, customers who have visited the site and made a purchase in the amount of 1,000 rubles or more.
Also in Kissmetrics , groupings are available according to various criteria (not only by time), for example, by place of residence, traffic source, etc. An example of a report in this system:
As you can see, there are many systems for working with cohort reports. But since this direction is only gaining popularity, many are working in beta mode and with restrictions. Therefore, analysts in large projects have to interact with less automated tools, one of which will be discussed below.
Google Sheets
You can build a cohort report based on data from Google Sheets using a pivot table. To do this, you need to collect the initial data and add it to Google Sheets in this format:
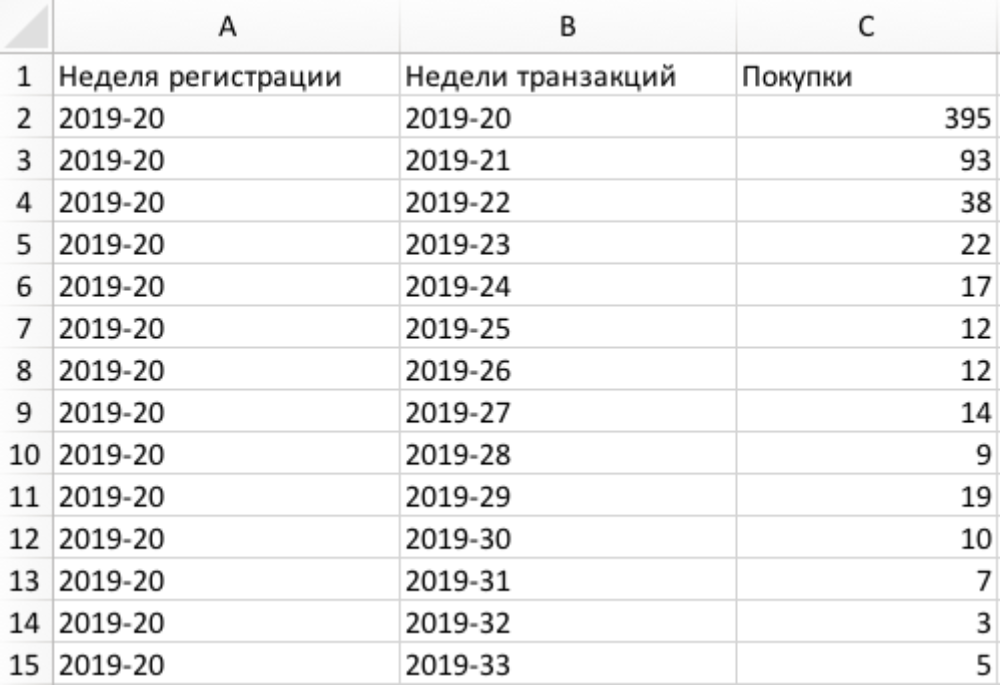
Observe the specified format: in the first column - the period of formation of the cohort (week of registration), in the second - subsequent periods (weeks of transactions) and in the third - data on the indicator in question (number of purchases).
Pivot table
The PivotTable is the easiest and fastest way to build a cohort report based on the raw data, which, by the way, you should have already added to Google Sheets.
Select the desired data range, open the Data tab and select PivotTable. The settings panel will appear on the right:
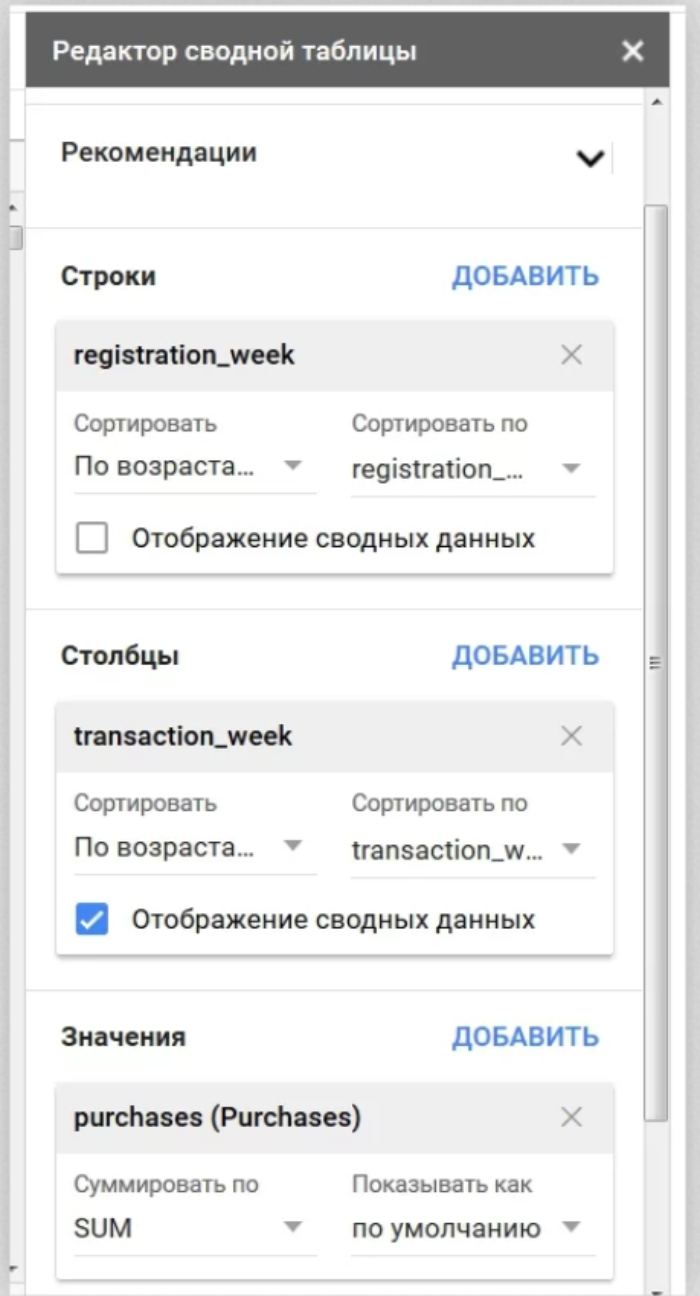
Make the following settings:
- "Strings" - a week of registration;
- "Columns" - the week of the transaction;
- "Values" are purchases.
Apply conditional formatting to make the report "readable". You should get something like the following pivot table:
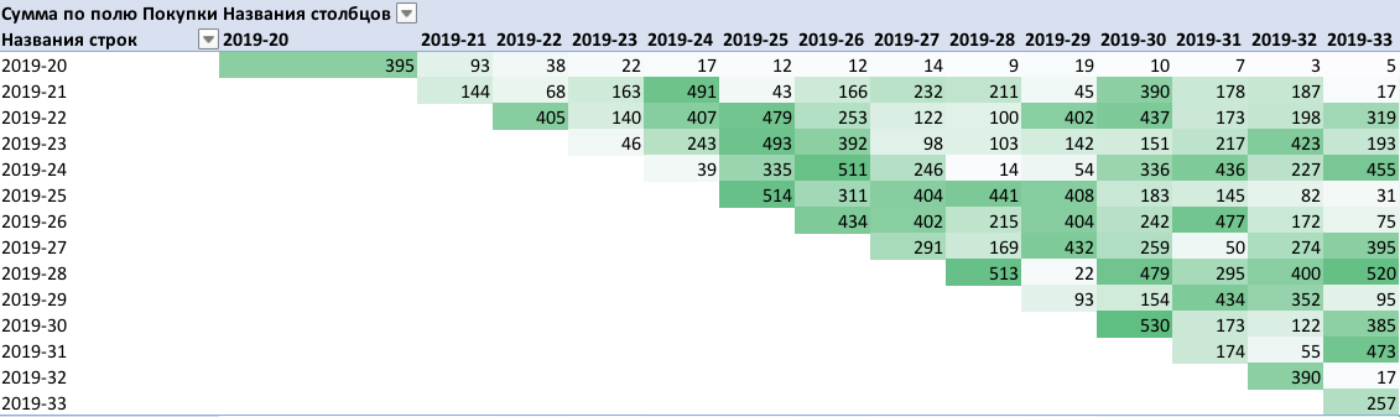
It takes a few minutes to create a report, but it does provide a wealth of valuable information. Then the analyst enters the work, "reads" the data, draws conclusions and makes decisions.
Cohort analysis is an indispensable tool for the modern analyst. Its use provides more valuable information for product development than, for example, A / B testing. But in general, the scope of application of cohorts is quite extensive and a competent analyst can adapt their use for different tasks.
Special tools and special knowledge are not required to conduct cohort analysis. Most modern analytics systems automate data collection and reporting. It remains for the analyst to correctly interpret the received data and use it for product development.
If it is not possible to interact with any analytics system, use the available tools - Google Sheets and pivot tables. This article provides a detailed description of how to prepare a report with their help.