Let's take a look at the main metrics and definitions used in reports, talk about cookies, find out how GA determines the traffic source, and much more.

Let's not ignore Yandex.Metrica - let's look at the basic settings, give examples of the correct placement of advertising campaigns, learn how to set goals and track sales on the site using the e-commerce module.
The article is intended for novice analysts who have minimal experience with these analytics systems or have never encountered them at all. But for experienced professionals, the material will be useful: refresh your knowledge and, perhaps, learn something new and interesting.
How analytics counter collects data
Google Analytics and Yandex.Metrica are analytics systems for websites and mobile applications that collect data about user behavior and provide them in the form of conveniently readable reports.
Analytics systems collect data in three stages:

The user visits the site with the Yandex.Metrica or Google Analytics counter installed. The script monitors his behavior and collects data about which pages he visited, through which browser viewed the resource, from which country (city), etc. and where it came from (through a search engine, from contextual advertising, another site, etc.).
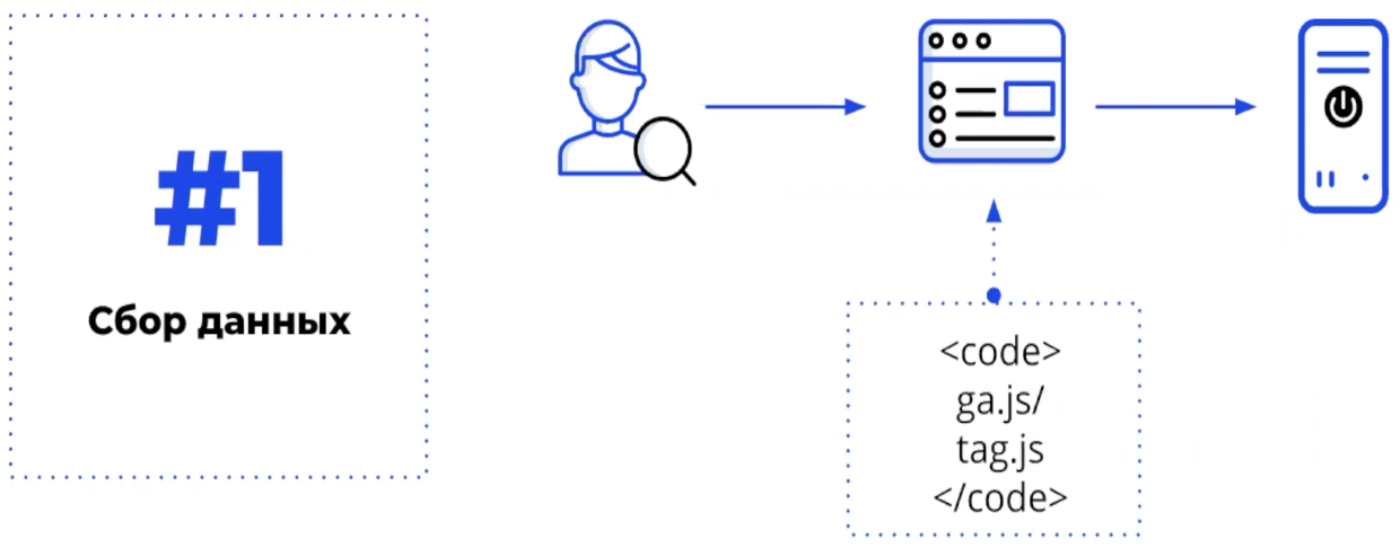
The collected information is placed in a data warehouse and sorted according to certain indicators. The systems automatically generate reports, which at the third stage are viewed by the resource owner or analyst: indicators that are important for decision-making are shown in a convenient form.
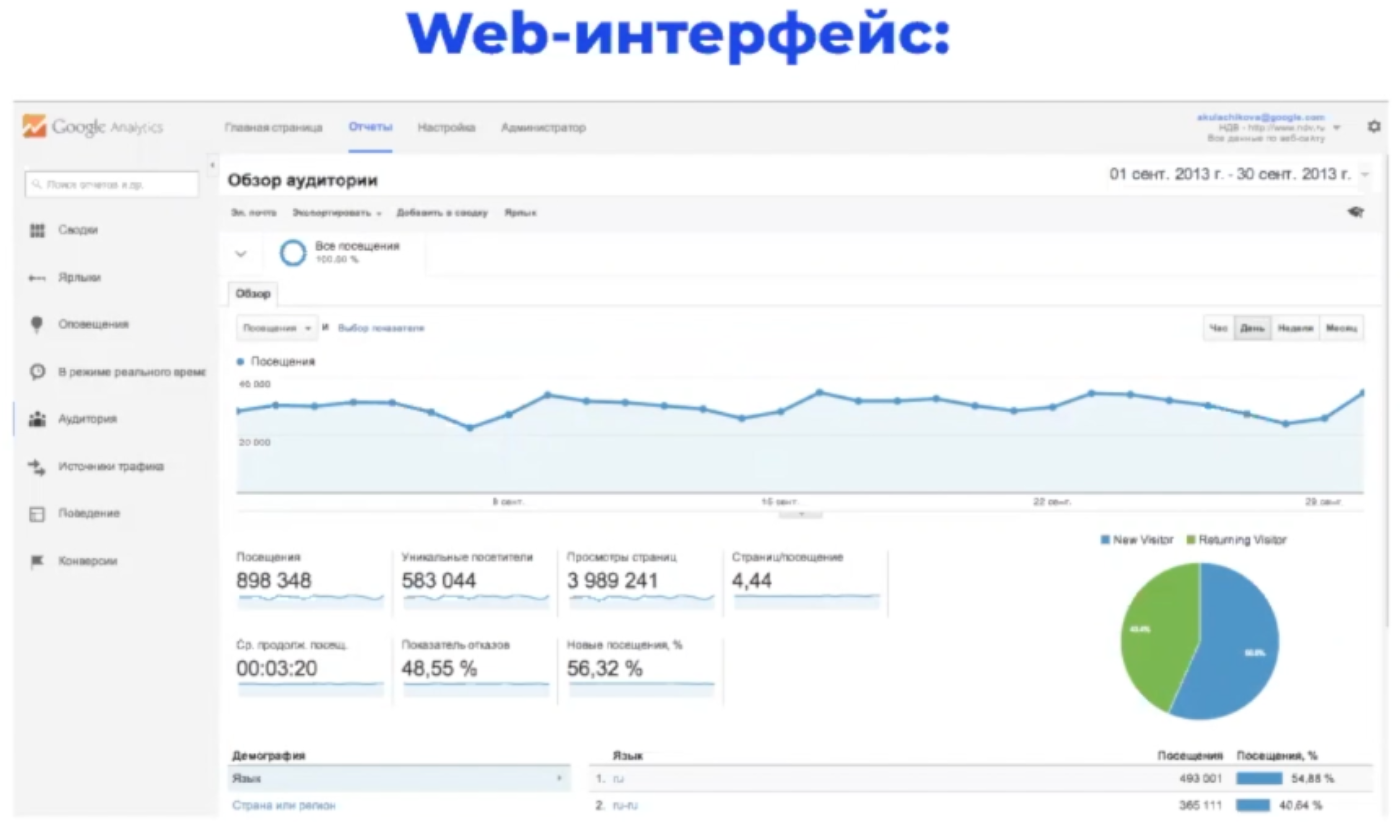
Statistics are viewed through the web interface or loaded through the API. The first is distributed more, below you can look at an example of an automatically generated report in Google Analytics.
Google Analytics has a small minus: the system collects information about no more than 500 actions (hits) of one user on the site. When the limit is reached, recording stops to minimize server load. Typically, this flaw affects large projects with large amounts of data. Yandex.Metrica has no such restriction.
Analytics systems are taught not to consider the same user as a unique visitor. After the first visit, a person is assigned a “cookie” (cookie) - a small text file that is its unique identifier. Thanks to the information in the document, the next visit to the same person will not be considered unique.
It is worth noting that analytics systems do not provide information with 100 percent accuracy. Firstly, the same person can use several browsers: then each time he will be considered a unique visitor. Secondly, some Internet users often "clear cookies", that is, delete their personal identifier.
The spread of accuracy is different: somewhere a few percent, somewhere 20-30%. It all depends on the type of site, subject matter and a number of other factors. Nevertheless, Yandex.Metrica and Google Analytics remain the undisputed leaders among analytics tools; many experts use them to obtain important information about the behavior of visitors to web resources.
Basic Google Analytics settings
There are a lot of settings in Google Analytics and newbies are often lost in their abundance. Let's go through the installation of the right parameters from the very beginning, so that you get the right and high-quality data for making effective decisions.
The very first thing is to set the correct time when creating the counter. It must match the time zone in which you live or view reports. If the counter has already been created, check the setting in View Settings.
The maximum amount of data is received if the counter code is set correctly: on all pages before the closing tag. If you put a script at the bottom of the site, it will not always work and this will lead to the loss of a significant part of valuable information.

Setting codes manually on each page is a tedious and time-consuming process. To minimize time costs, use Google Tag Manager (or another similar system). You can install one script on the site, and add the rest of the codes through a convenient and intuitive interface. By the way, later, when working with scripts of advertising systems, pixels, questionnaires, etc. you will also need this tool.
Google Analytics account structure
Let's see what the start page of your Google Analytics account looks like:
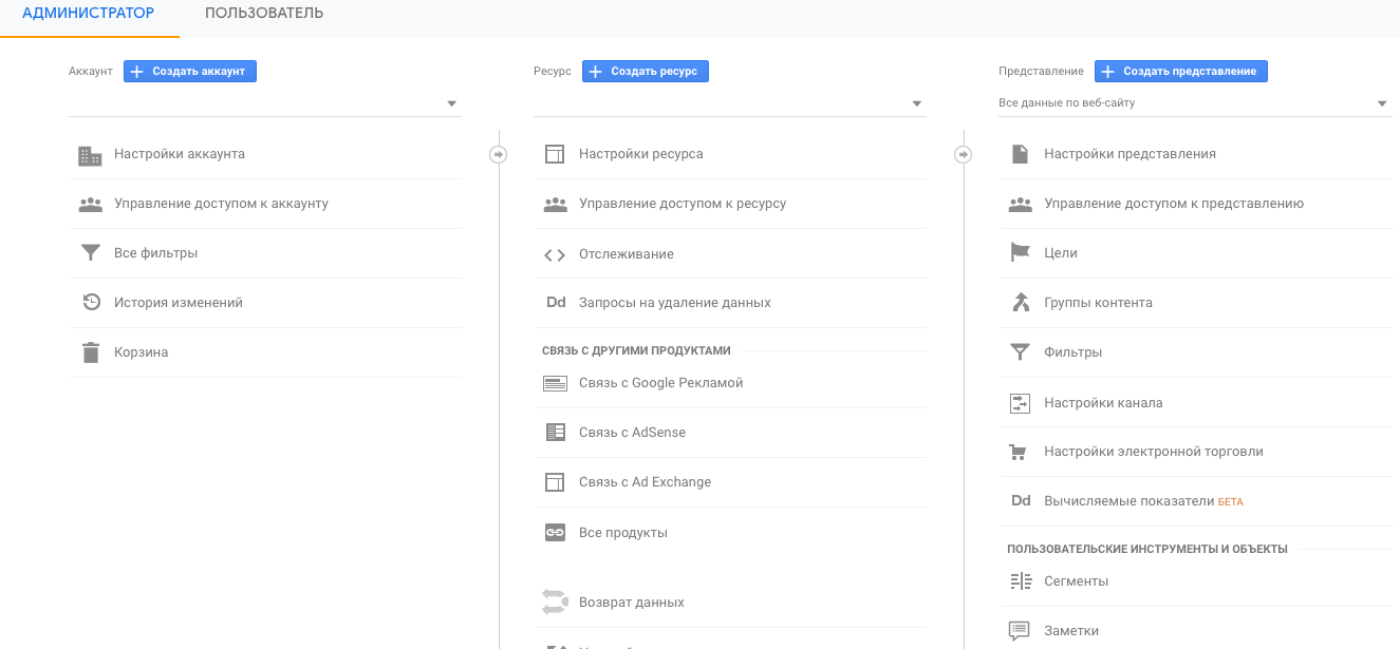
The start page is divided into 3 sections:
- Shared account - refers to the business as a whole.
- Resources - menus for individual sites, applications, etc.
- Options for presenting data - various report formats (for example, you can see general data for a particular resource, for certain regions, traffic sources, etc.).
The account structure looks like this:
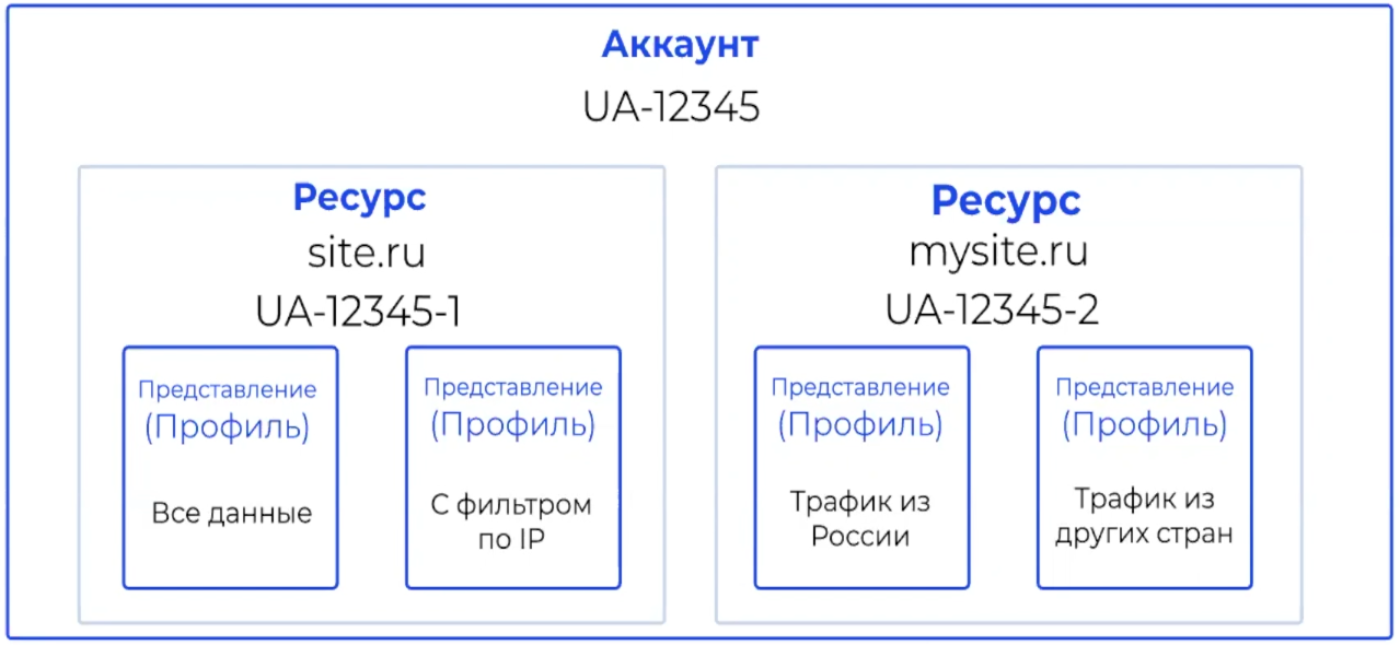
Center is a general account that includes many resources related to different sites or applications. For everyone, you can set different filters for providing data: for example, showing traffic only from Russia, from certain advertising sources, etc.
In order for the account structure to be correct, first make a list of all resources and think about what data slices you want to receive from them. Before moving on to setting up filters, check out a couple of valuable tips:
- Leave a view across all traffic (no limits). This way, you can find lost data if filters are incorrectly configured.
- Leave a view on all traffic except users with internal IP. This will allow access to data without visits to employees of companies that use the site or applications to perform work tasks.
Filters in Google Analytics
In addition to installing filters for traffic from certain countries or regions, which were discussed in the previous section, there are many others. For example, to track traffic and its behavior on certain pages, sections or subdomains of the site. Before moving on to adding and configuring new filters in your account, see when you need them.
Filters are needed for:
- excluding traffic from internal IP addresses (corporate traffic, developers and contractors);
- providing reports on traffic from specific countries or regions;
- view traffic from specific advertising campaigns with limited access for contractors;
- analysis of user behavior on specific pages, sections and subdomains;
- excluding bot traffic;
- replacing some data with others in reports.
Adding and Configuring Filters
Filters are created in one of two ways:
- "Admin Panel" -> "Account" -> "All Filters".
- View -> Filters
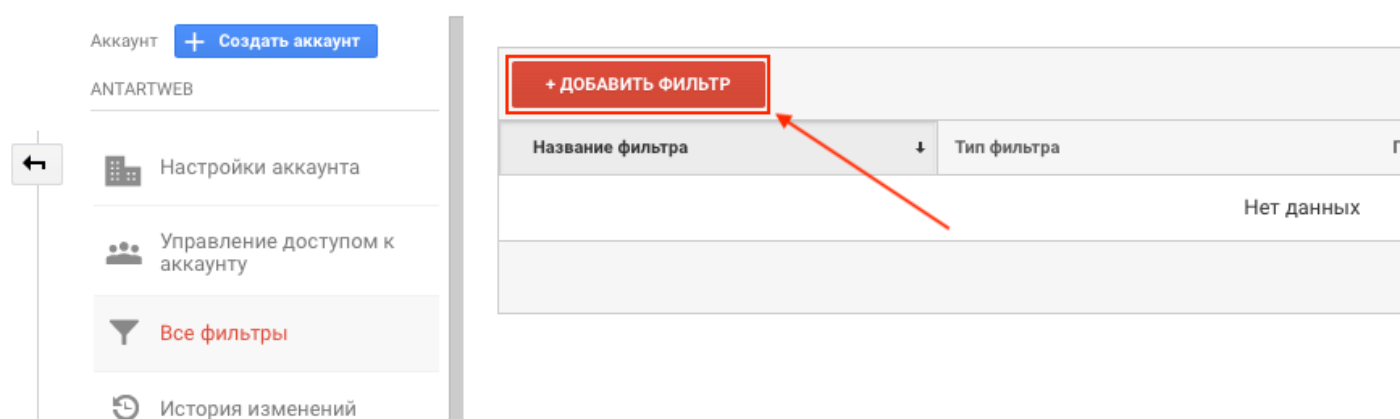
We get to the page of creation and settings. Here's an example to exclude a specific IP address:
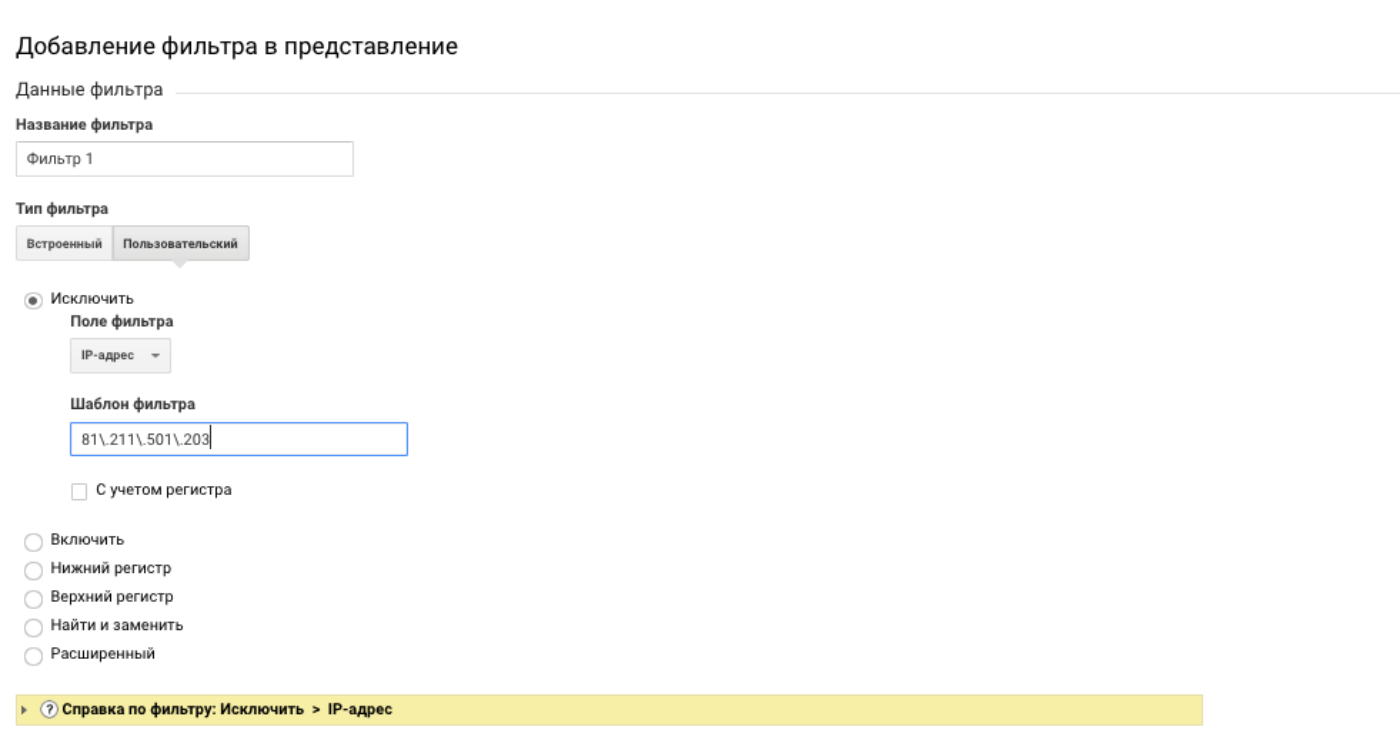
Pay attention to the "filter type". Built-in - template options from Google. They are suitable for excluding or adding traffic from different sources to reports. Custom - more flexible options, suitable for in-depth analytics. For example, the reports can include or not include users whose devices do not support NFC, etc.
If one filter provides for specifying multiple values (as in the example with IP), use regular expressions :
- [| ] - is used as the "OR" operator to find matches;
- [^] - requires the specified data to be at the beginning of the field;
- [$] - requires that the specified data be at the end of the field;
- [()] - used to create an element, not accept the default;
- [\] - Converts a regular expression character to a regular character.
Symbols are very useful when multiple conditions are specified for the same filter. For example, you want to receive traffic data from the main cities of the company or product: Moscow and St. Petersburg. The symbol [| ].
All created filters are stored in the library, from there they can be applied to any projects (sites, applications, etc.) through the admin panel.
Before using new parameters for main projects, test for correctness of work. To do this, create a test site, apply new filters to it, and check that it functions correctly.
Another important point- filters work in descending order, so keep track of the contradictions between them. For example, if the first leaves traffic only from Moscow, then the second, which is configured to collect data about the audience from Sochi, will have no data, because they are all excluded by the first filter.
Display Features and Audience Reports
Google Analytics includes many functions that make it difficult for novice analysts to immediately deal with such a volume of data. Let's consider what settings are available here and determine the most important ones, which will be enough at the first stage of work.
Let's start with the "Resource Settings":
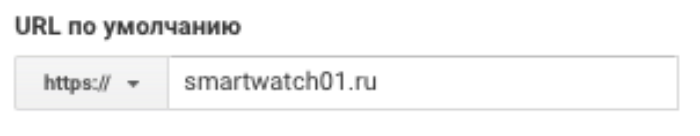
- Specify the project URL correctly, do not forget to select the appropriate prefix: http or https.
- Select a business sector (website, application, other sites). In the future, this will help when viewing reports on benchmarks - the benchmarks of other companies.

- (, ), ( UTM), .

- , , .

- Google Analytics Search Console ( ).
- «» .
Google Search Console
By promoting the company’s website, valuable information is obtained from reports on search queries. But if you go into it now, then you will not see any data. The fact is that this information is confidential, therefore Google does not disclose it so easily.
Therefore, you must link your site to the Google Search Console and Google Analytics. Of course, all the information will not be 100% open, but most of it will be possible to get.
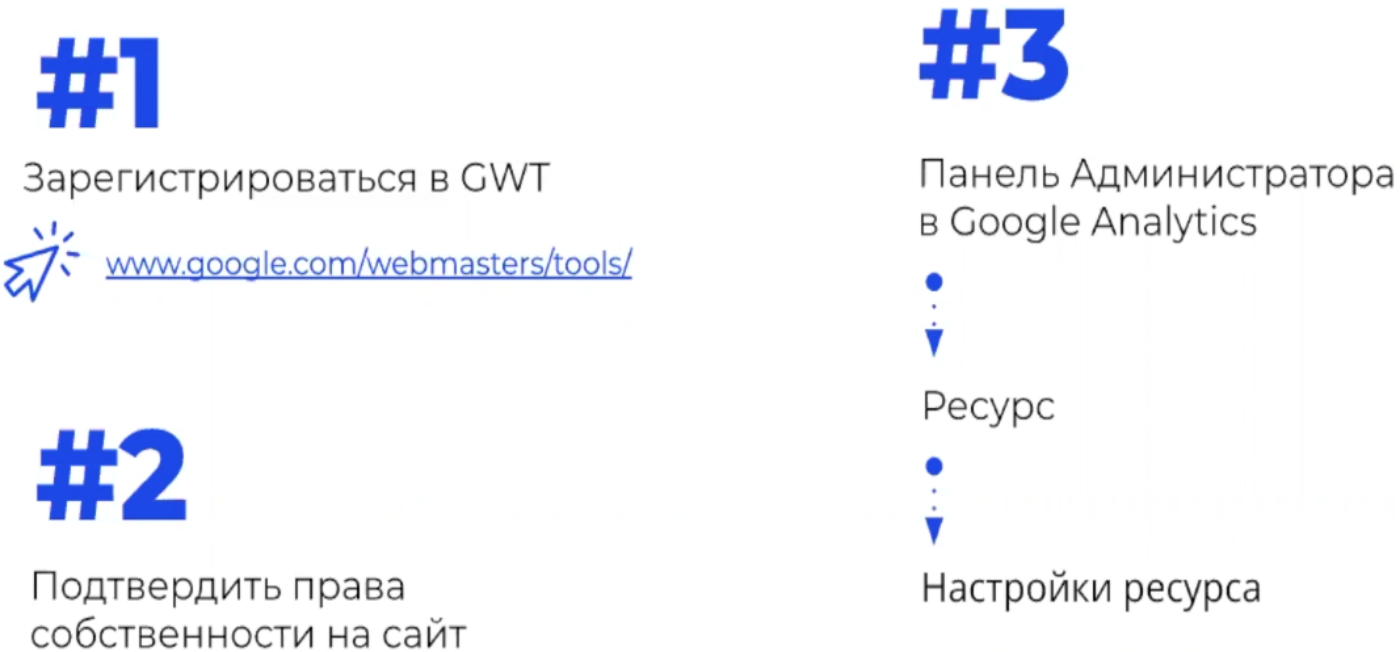
The bunch takes a little time and is carried out in 3 stages:
- Sign up for Google Webmaster Tools .
- Add your site to Google Search Console and verify your rights (usually this is done by adding a special meta tag between tags).
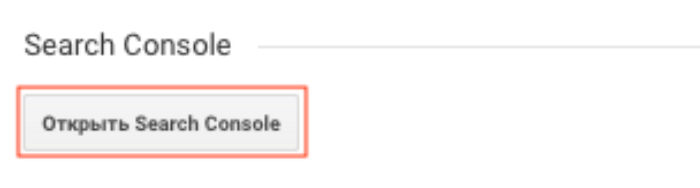
- Go to your Google Analytics admin panel and in Resource Settings click Open Search Console. Follow the instructions in the service to complete the bundle.
Pay attention to an important point: in order for the bundle to succeed, log in to both services from the same Google account.
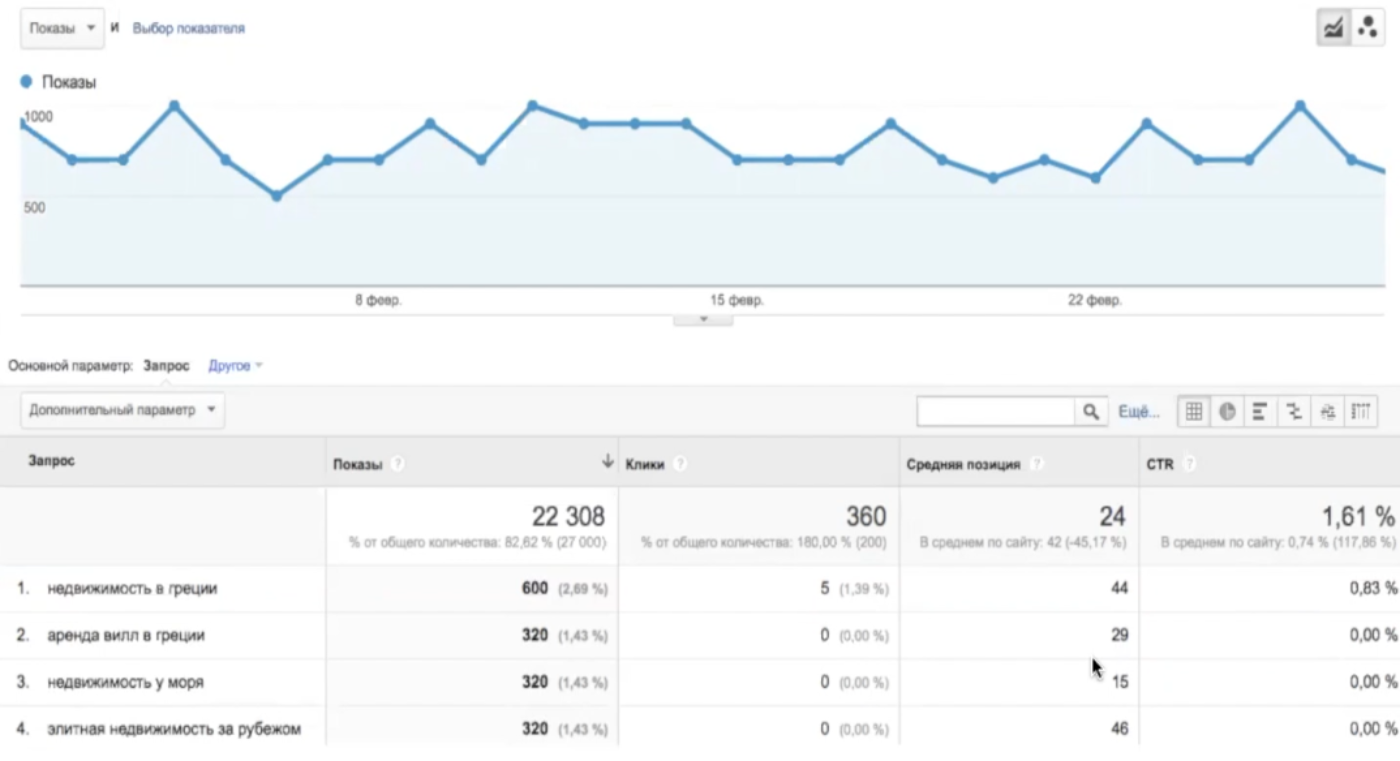
You will find the Search Engine Optimization reports on the main page of the analytics system: Reports -> Traffic Sources -> Search Console -> Queries. Here you can find information about the most popular queries for which the site is found in the search engine, what is the average position they occupy in the SERP and CTR of clicks.
It is worth noting that you will not be able to view the data immediately after linking. Systems need time to synchronize. Typically, the report becomes available within 24 hours. Another feature is that information appears with a delay of 2 days. That is, today, June 19, a report is available for June 17 and earlier. If you want to use the data in your work to improve the sites, work promptly, since they are stored in the system for 3 months, and then they are automatically deleted.
Tracking
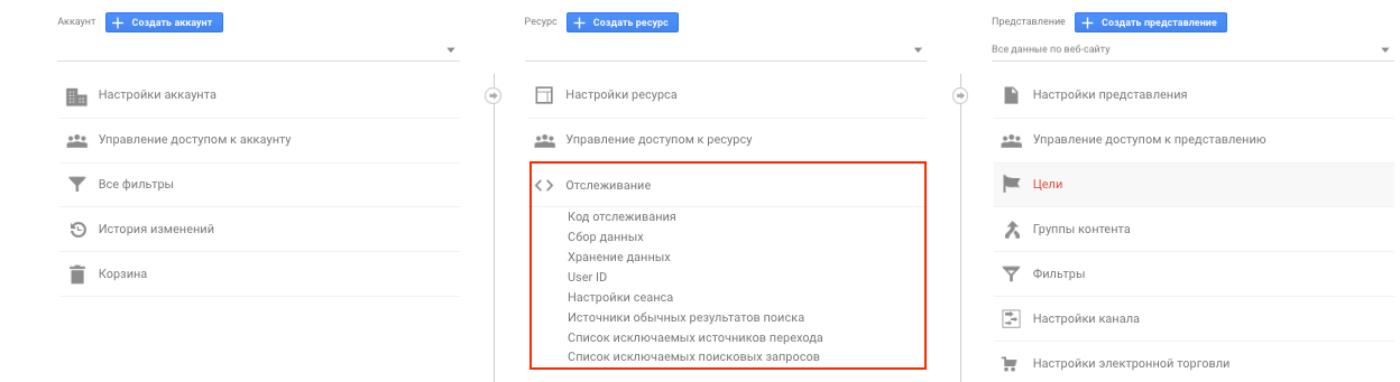
In the "Tracking" section, there are several important points that you should pay attention to when setting up a site.
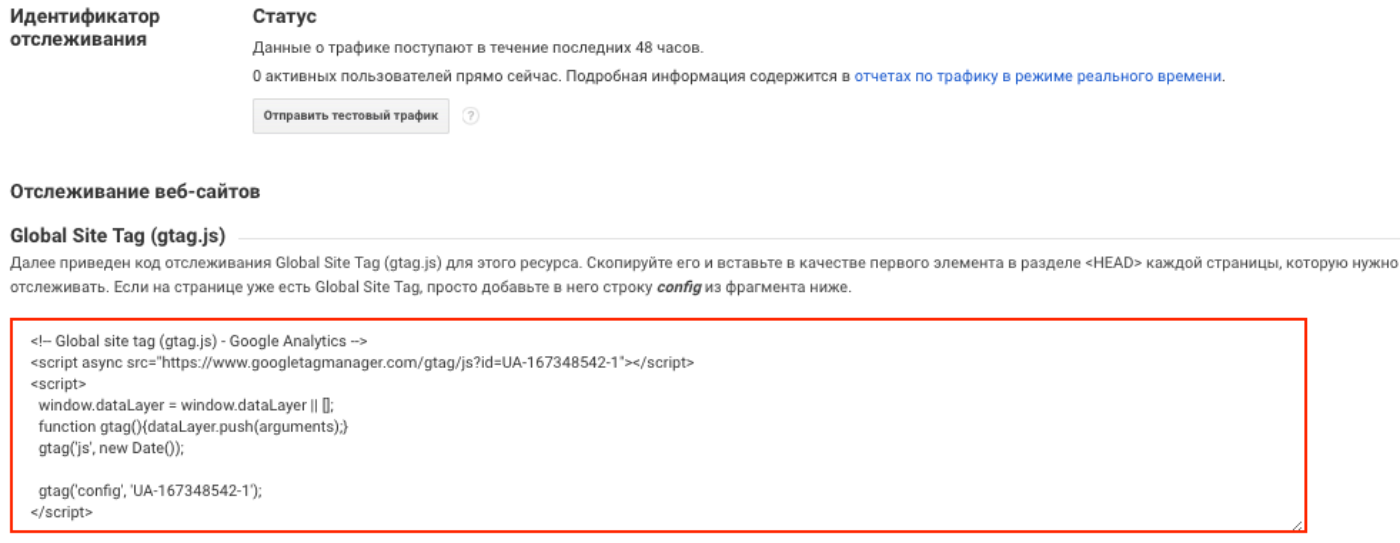
First, make sure you are using the latest and most current tracking code. After technical work and innovations in the service, it may change.
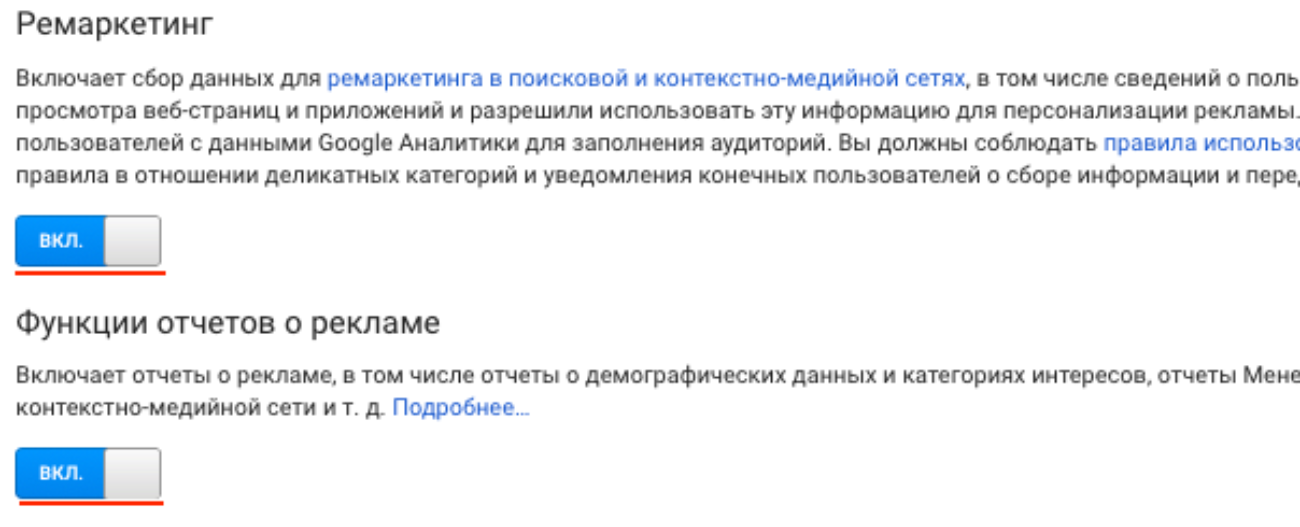
Secondly, check that the functions of reports on advertising and remarketing are activated (the latter is needed to return potential customers to the site and "press" to the target action) in the "Data Collection".
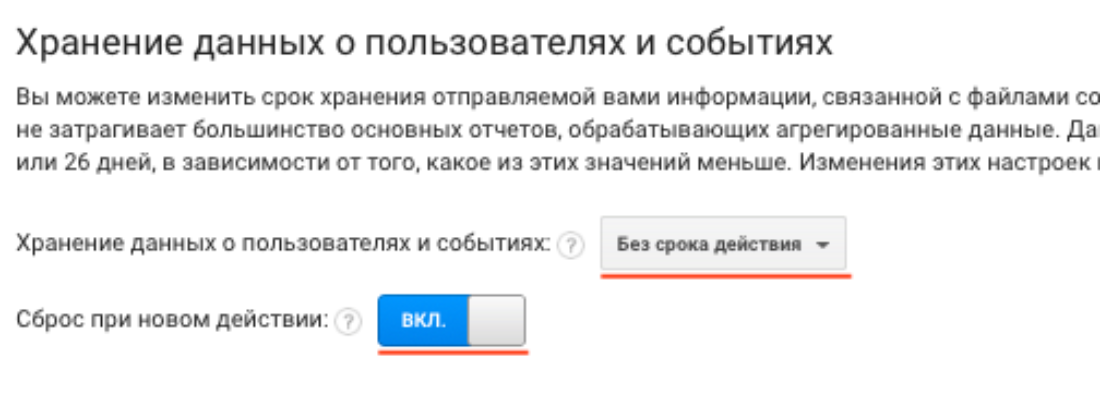
Third, configure the storage of user and event data "without expiration" and activate the reset function on a new action in the subsection "Data storage".
And one more important subsection is the list of excluded referral sources. Here are the sites that do not want to be seen in traffic sources.
For example, you have an online store with the ability to pay for goods online through a payment service. The customer gets there from the cart, makes a payment and returns to the site. If the service is not added to the exclusion list, Google Analytics will accept each such return as a new visitor, since he came from a third-party resource.
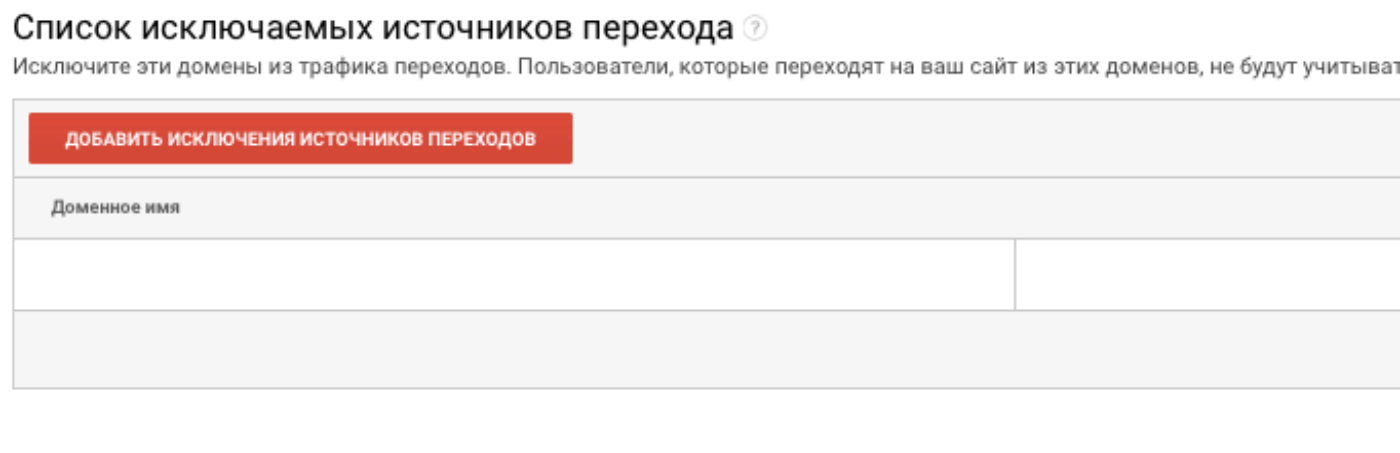
Such analytics will be inaccurate, you will not be able to objectively measure key indicators (for example, conversion). Therefore, add payment service sites and other unnecessary sites to the list of exclusions.
Linking with Google Ads
If you are promoting a property through Google Ads, link your account with Google Analytics. This will help you track conversions and other important metrics to optimize your advertising strategies and budgets.
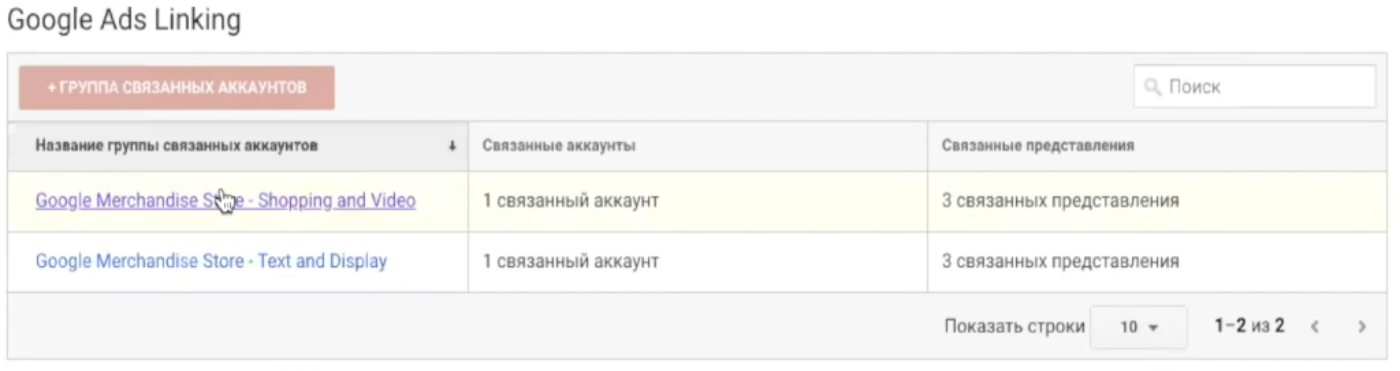
Select the account with which you want to set up a link to the resource. If there are several accounts, then indicate all to obtain information in the maximum amount. Next, configure the connection, namely the types of views in which you want to receive data.
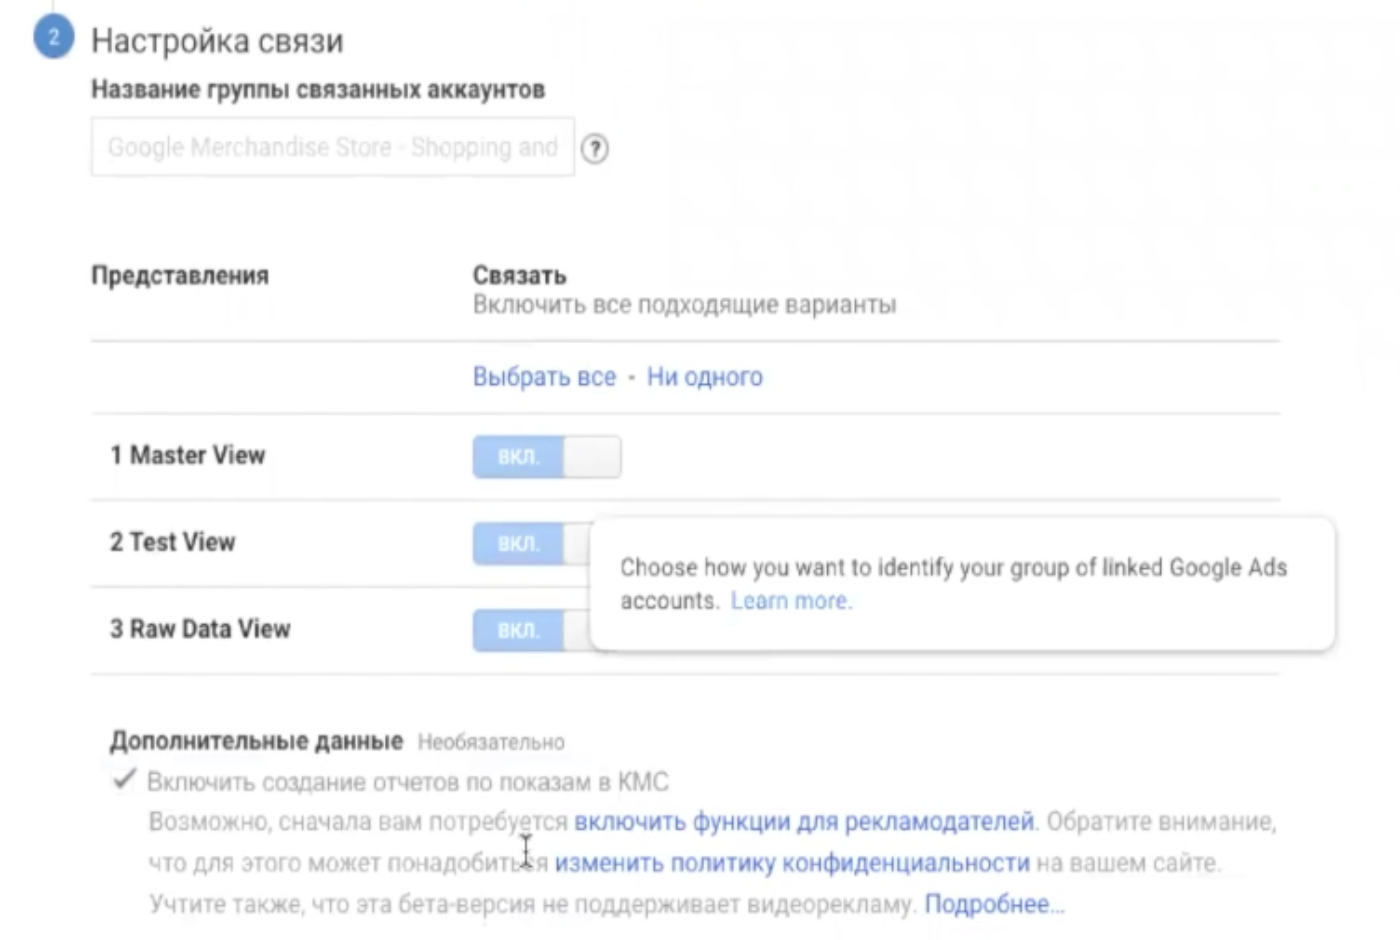
Thanks to this, you will receive detailed reports on advertising campaigns, as well as be able to send segments to Google Ads for retargeting. This will help to “squeeze” potential customers and increase sales.
Customize Views
Let's consider in which views it is possible to receive data in Google Analytics. But first, check the basic settings. First, see if the resource domain and time zone are correct.
Second, exclude the required URL request parameters. Various parameters are entered into this field (for example, product filters) separated by commas. We recommend that you approach this setting responsibly, as otherwise the reports received will be incorrect.
Thirdly, activate the checkbox "Exclude requests from robots and spiders". Then the analytics will not display data about visits to the site by search engine robots, various inspectors and grabbers. Of course, it is impossible to completely exclude the inclusion of such information in the report, since there are a huge number of robots and it is impossible to know about all, but when the function is activated, the correctness of the data will increase significantly.
Site search setup
Another useful block is setting up internal search tracking. The function is useful for resources that have an internal system for searching various documents (for example, articles, products, etc.).
Internal search will provide you with information about what users and potential customers are looking for on the site. Such information is a possible growth point: the definition of new popular products, interesting content for the audience, etc. By satisfying their search results, you will increase visitor engagement, which will have a positive effect on key metrics.

Site search tracking is activated in the view settings ("Admin Panel" -> "View" -> "View Settings"):
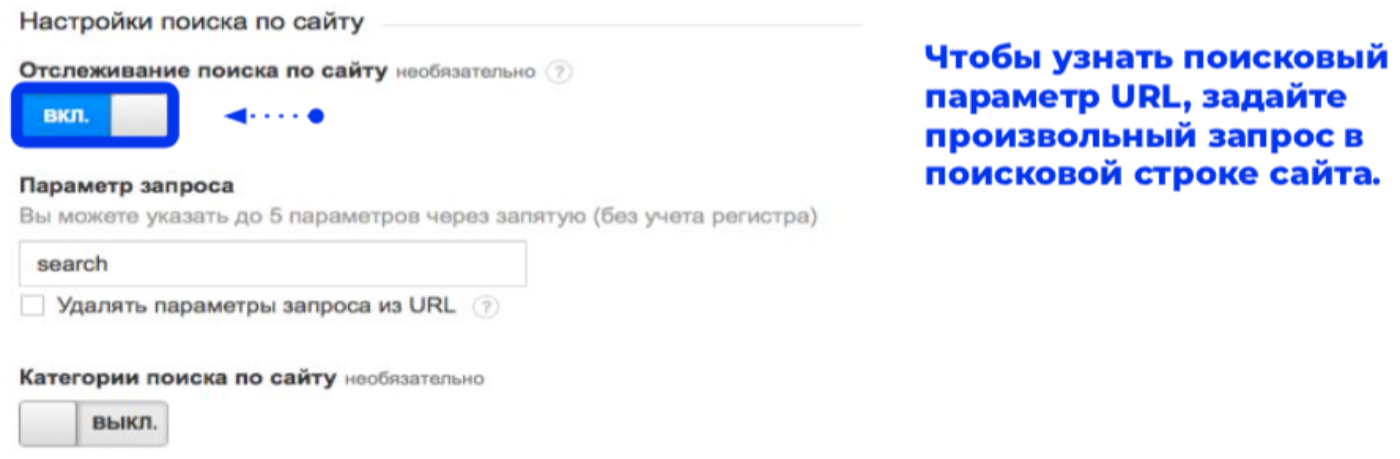
Pay attention to the item "Query Parameter": incorrect settings will lead to incorrect data. To determine the parameter correctly, search inside the resource for any query. The first value after the main URL is the required parameter:

The internal search report is in a separate tab:
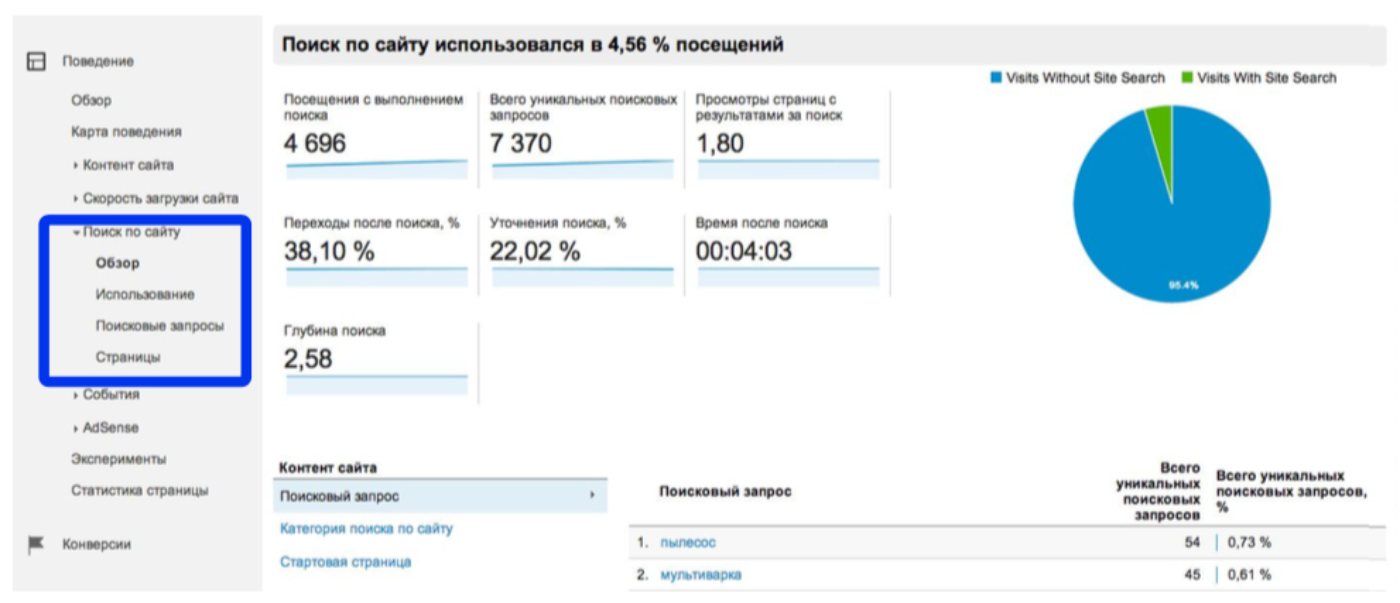
A competent analyst or product manager on the basis of these data determines the growth points: what products / content can be added, where to refine search engine optimization, etc.
An important point! Internal search data appears in Google Analytics within 48 hours after the setup is complete.
Access levels
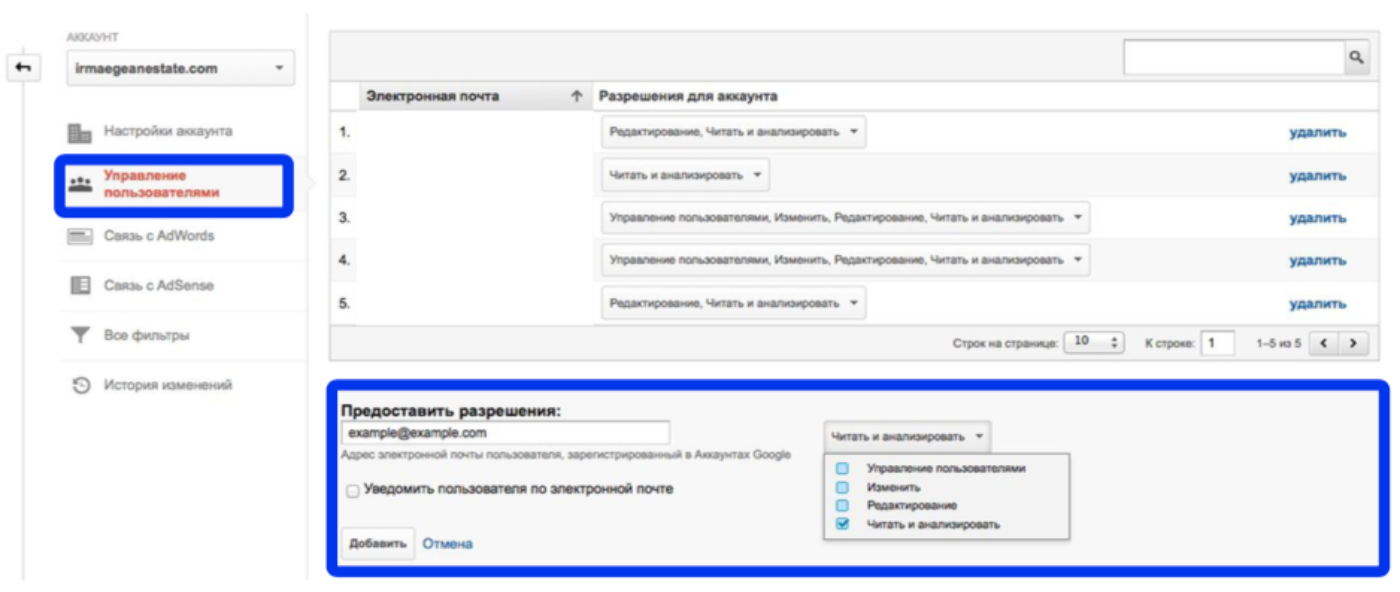
It is customary in companies to set up different levels of access for employees and contractors. There are three types of accesses: at the level of the entire account, a specific resource or specific representations.
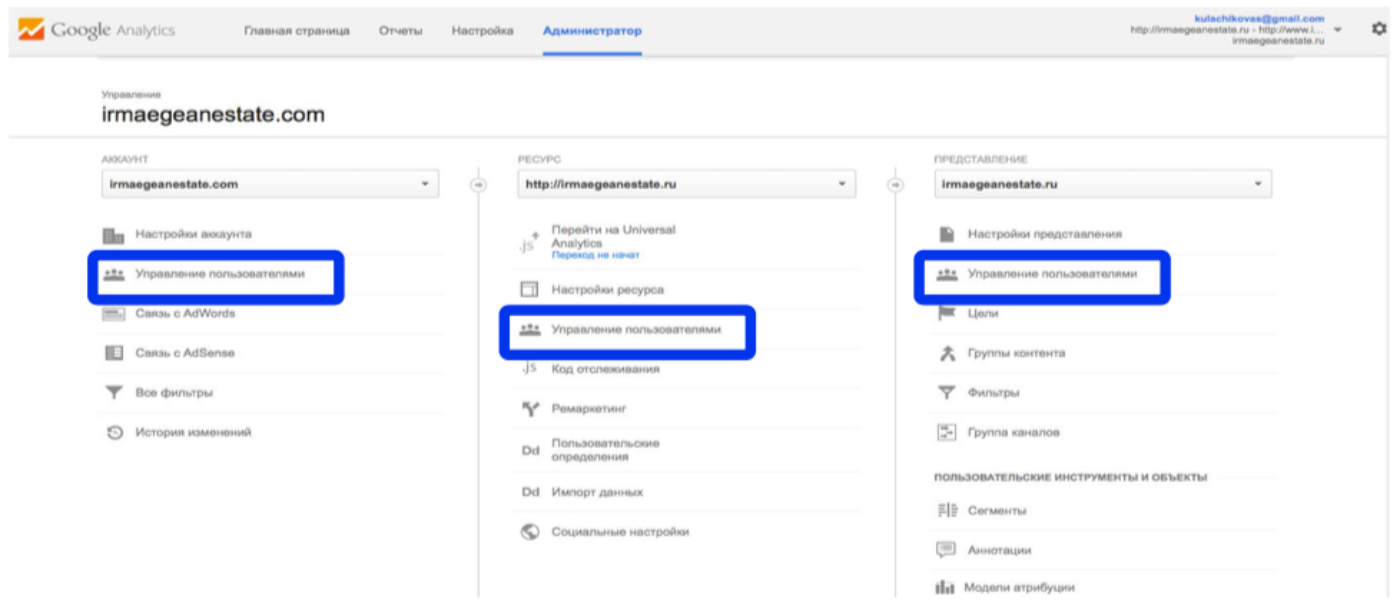
To grant permission, go to the "User Management" section, enter the Google mail address, select the permissions and click "Add".
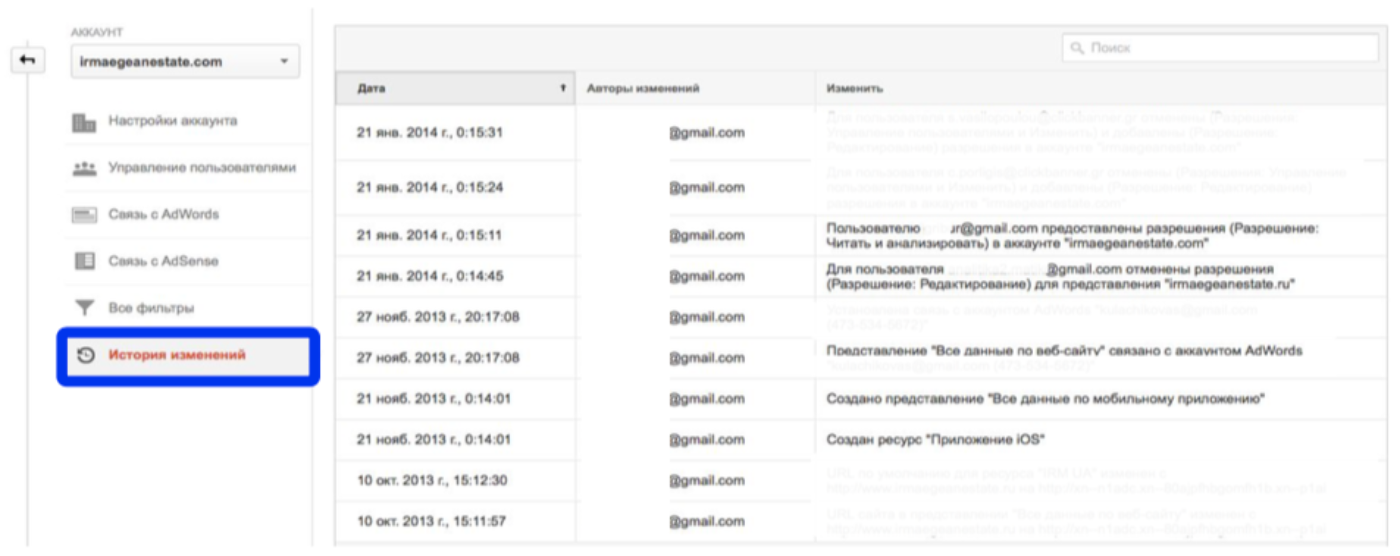
Review the Change History section regularly to keep track of your employees and contractors. It describes all the actions taken in an account, a specific resource or view. They are tied to user logins, which makes it easy to determine who exactly did what.
Alerts
Alerts is a convenient feature that allows you to receive operational notifications in case of a change in the target metric.
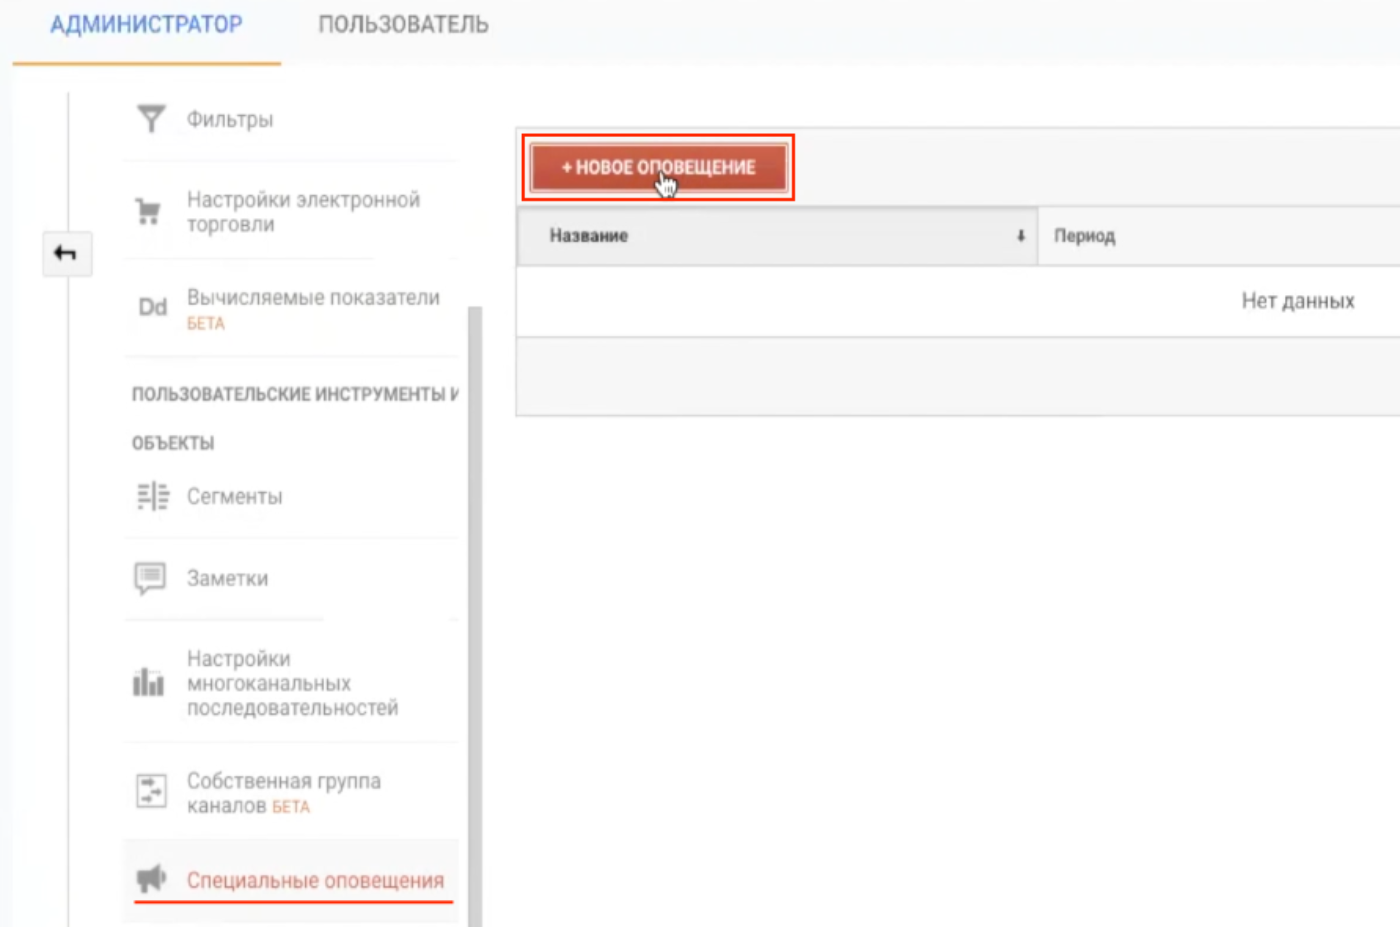
The number of alerts is unlimited. Set up easily and quickly through an intuitive interface. Indicate a clear name, period, what you need to look at. For example, you can make an alert to reduce traffic by 80% compared to the previous day.
This feature is useful if you work with a large number of sites and do not have the purely physical ability to regularly monitor the performance of each. Alerts will help you to timely react to non-standard deviations of metrics from the usual indicators and make changes to correct the situation.
Basic Yandex.Metrica settings
For clarity of the described settings, we recommend using the Yandex.Metrica demo counter. It is available at: metrika.yandex.ru/about
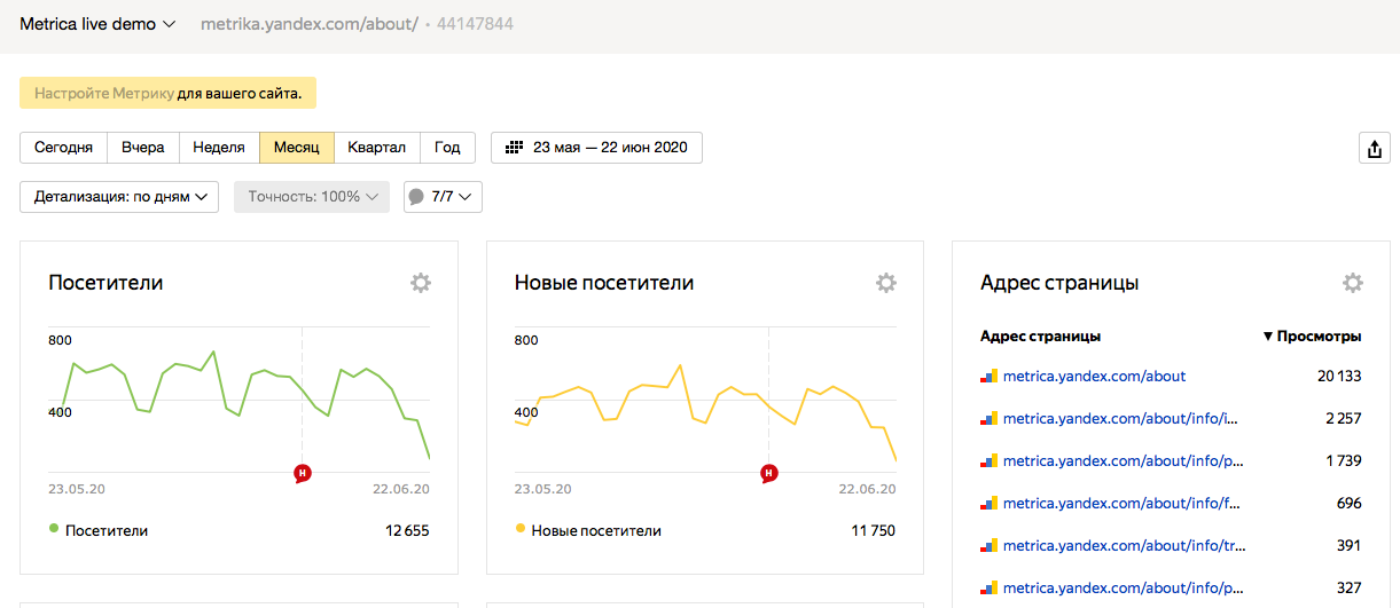
Immediately, we note that in comparison with Google Analytics, Yandex.Metrica does not have such a branching account. You log in to the mail, go to metrika.yandex.ru and see a list of all connected resources. You can go into the statistics of each separately and view the necessary information. In this regard, the metric is easier for novice analysts and product managers in terms of perception.
Creating and installing a counter
Creating a counter in Yandex.Metrica is similar to a similar procedure in Google Analytics. To get started, go to the main page of the service (log in to your account in advance) and click “Add counter”.

The setup form is already familiar to you if you have previously worked with a counter in Google Analytics.
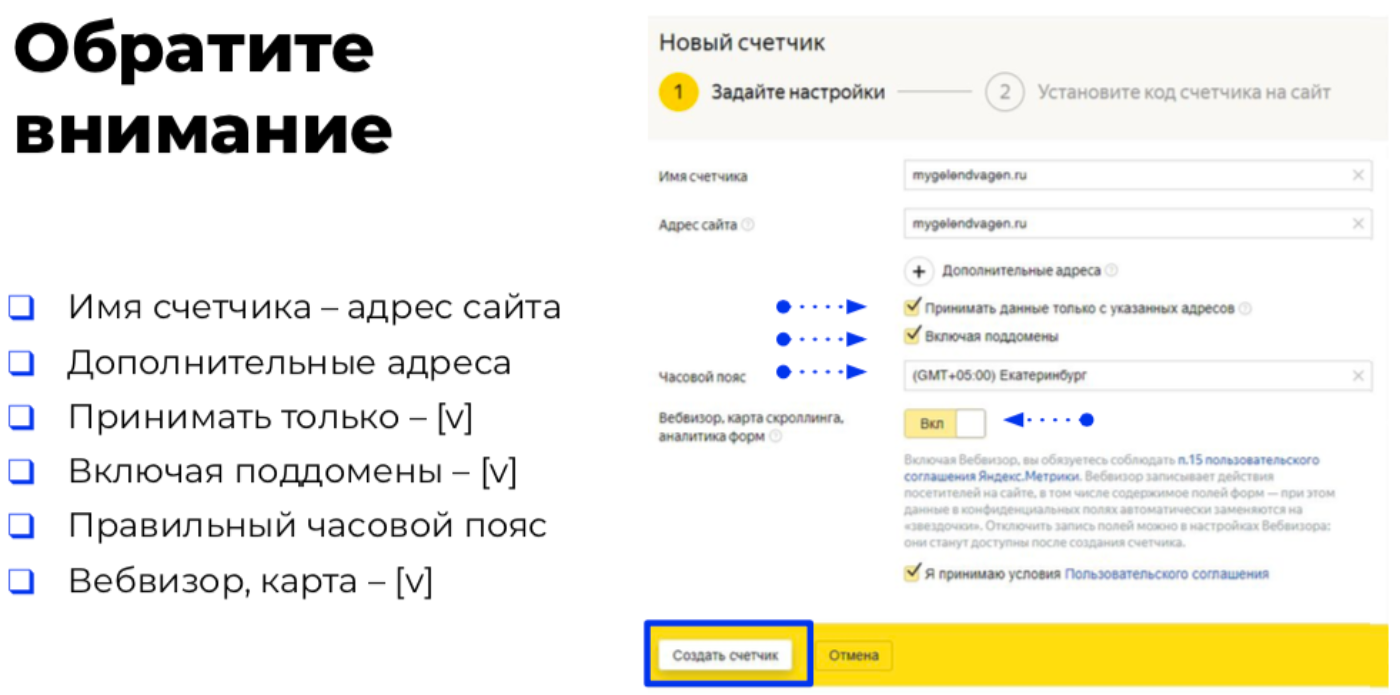
- The name of the counter is an arbitrary name, for convenience, the resource domain is entered there.
- — URL , .
- — , (, , ).
- — , . .
- — , .
Pay attention to two checkboxes: "Accept data only from specified addresses" and "Including subdomains", so that uninteresting and unimportant data from the point of view of analytics do not accidentally come across.
E-commerce is useful for online stores. The function allows you to track orders, orders, sales, etc. The collected data helps to improve usability, find new points of growth and much more.
"Content analytics" - in-depth analysis of page inspection, scrolling, transitions between articles and sections, etc. Clarifies user behavior, helps track their "path" on the site, and much more. Relevant for sites with blogs and information sections.
After completing the settings, click "Add counter". The system will generate the counter html-code in a few seconds. It, as in the case of Google Analytics, needs to be installed on all pages of the site. You can do it manually, but it is better to use the Tag Manager or special plugins that simplify and speed up this action.
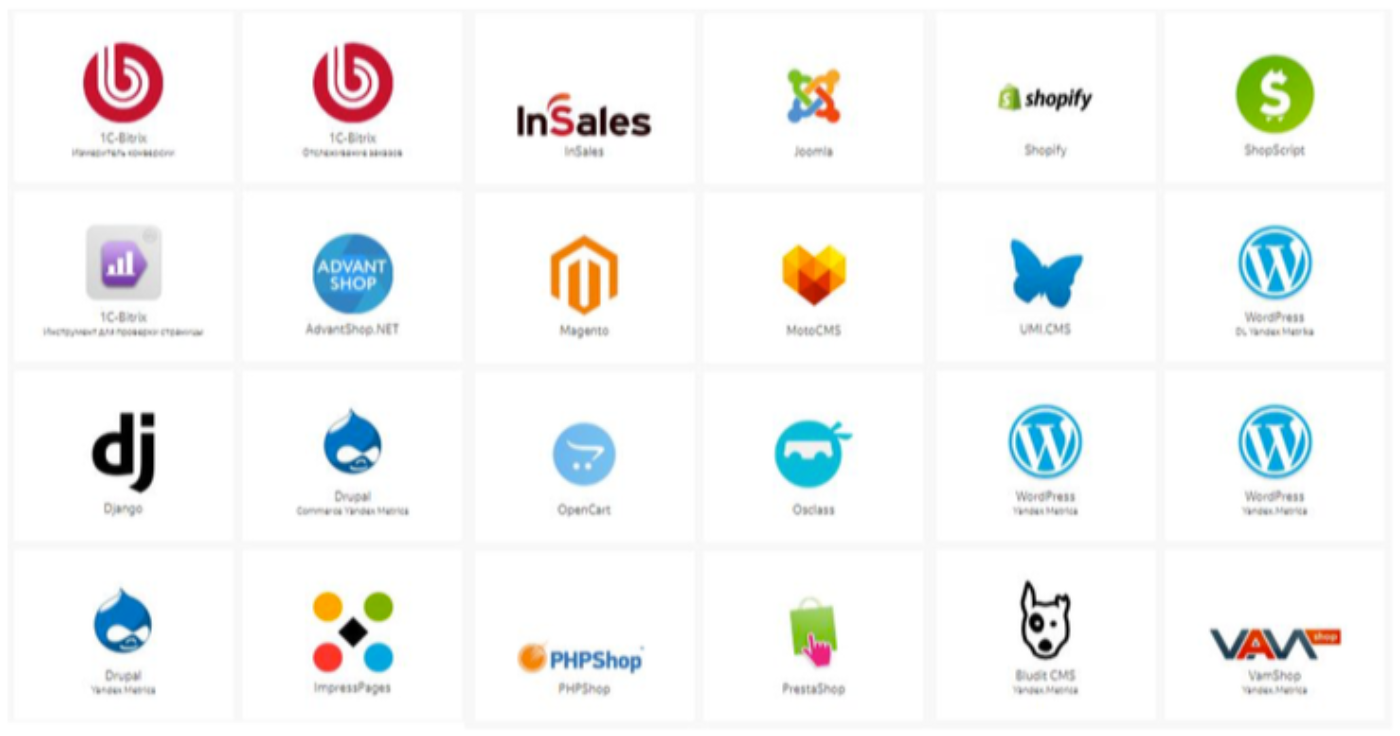
For example, for the most popular CMS - Wordpress - there is the Yandex Metric plug-in of the same name. In the settings, add the counter code and the plugin automatically places it on all pages for the correct collection of data on user behavior.
Other counter settings
After creating and installing the counter on the site, make additional settings.
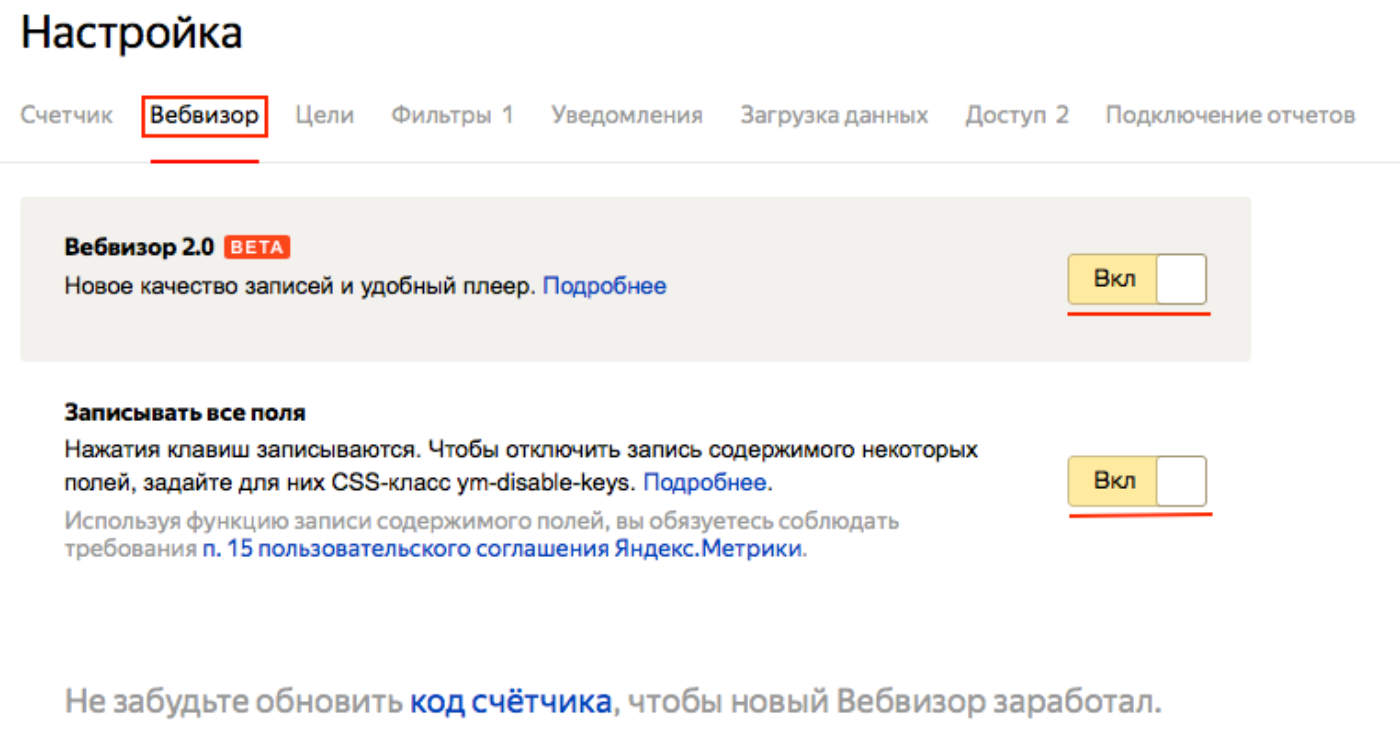
We recommend activating Webvisor 2.0 - it allows you to collect more data, track the behavior of users of the mobile version of the resource, transitions between tabs, interaction with dynamic fields, etc.
"Record all fields" is relevant for sites that have a section with reviews, comments, etc. This will allow you to view what users have written in the various fields. In this case, personal data (name, email address, telephone number, etc.) is not recorded.
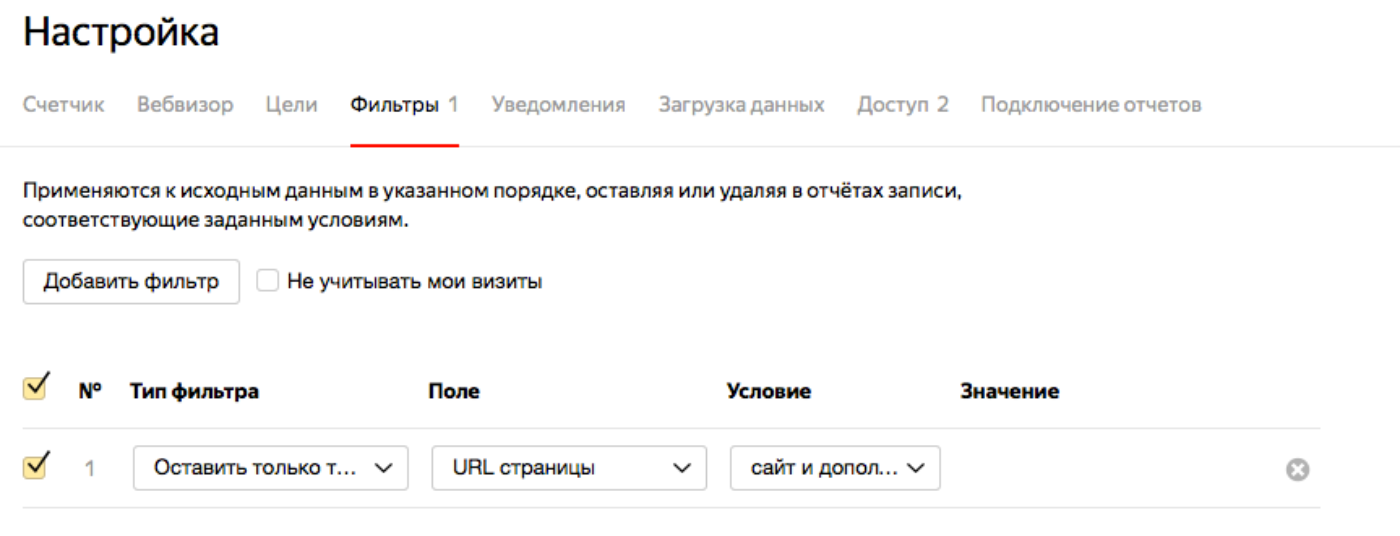
"Filters" in a metric work the same way as in Google Analytics. For example, you can exclude traffic accounting for your employees or contractor. You can activate the "ignore my visits" checkbox. Then, whenever you log in to Yandex.Mail, your visits to the site will not be displayed in the statistics.
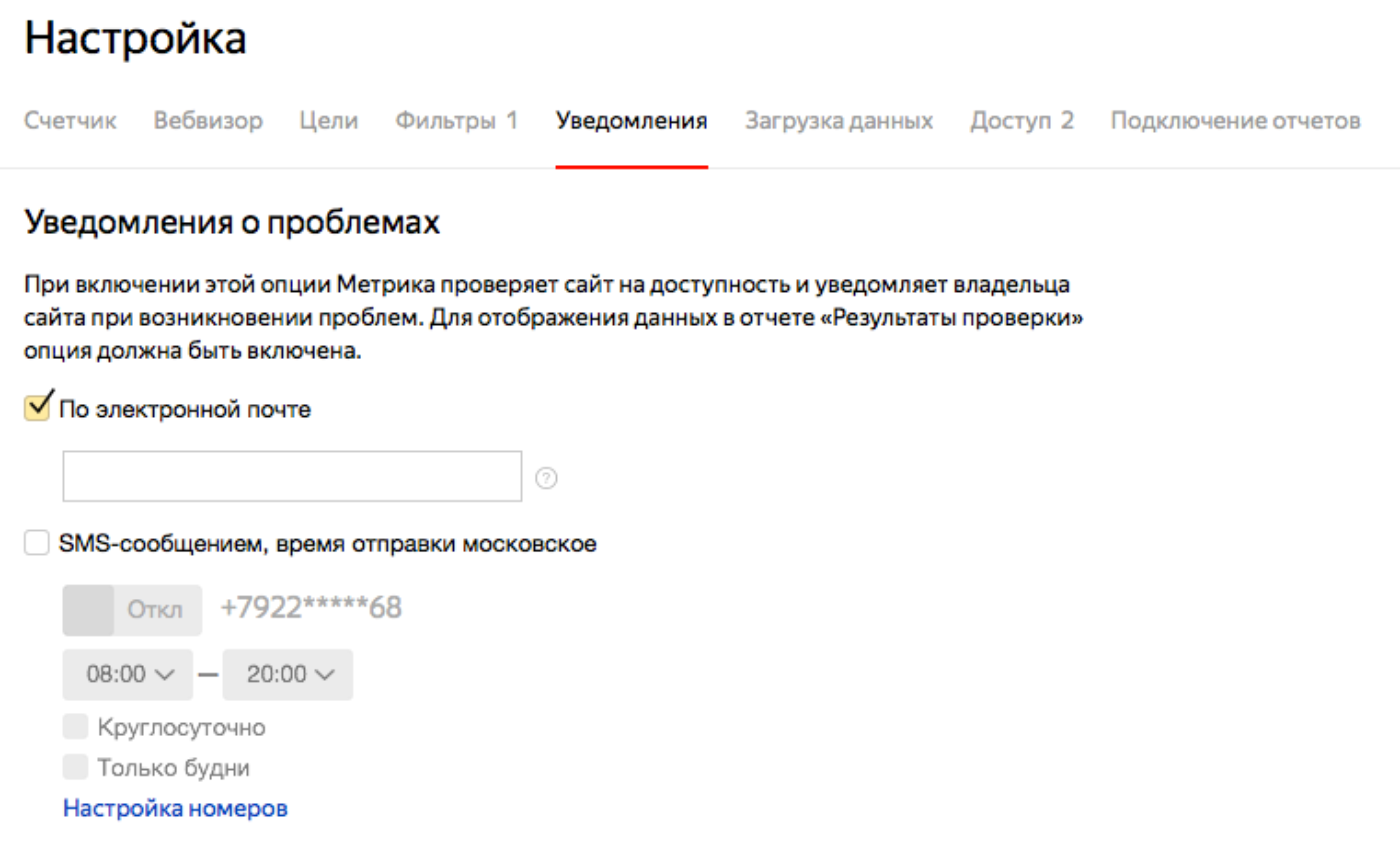
Notifications in the metric work and are configured easier than in GA. One type is available - notification by email or SMS if the site has stopped working completely (for example, hosting failures and other technical problems). The parameter is activated by setting the corresponding checkbox. Flexible settings are available for SMS notifications: you can set the notification time, on which days it can be done, etc.
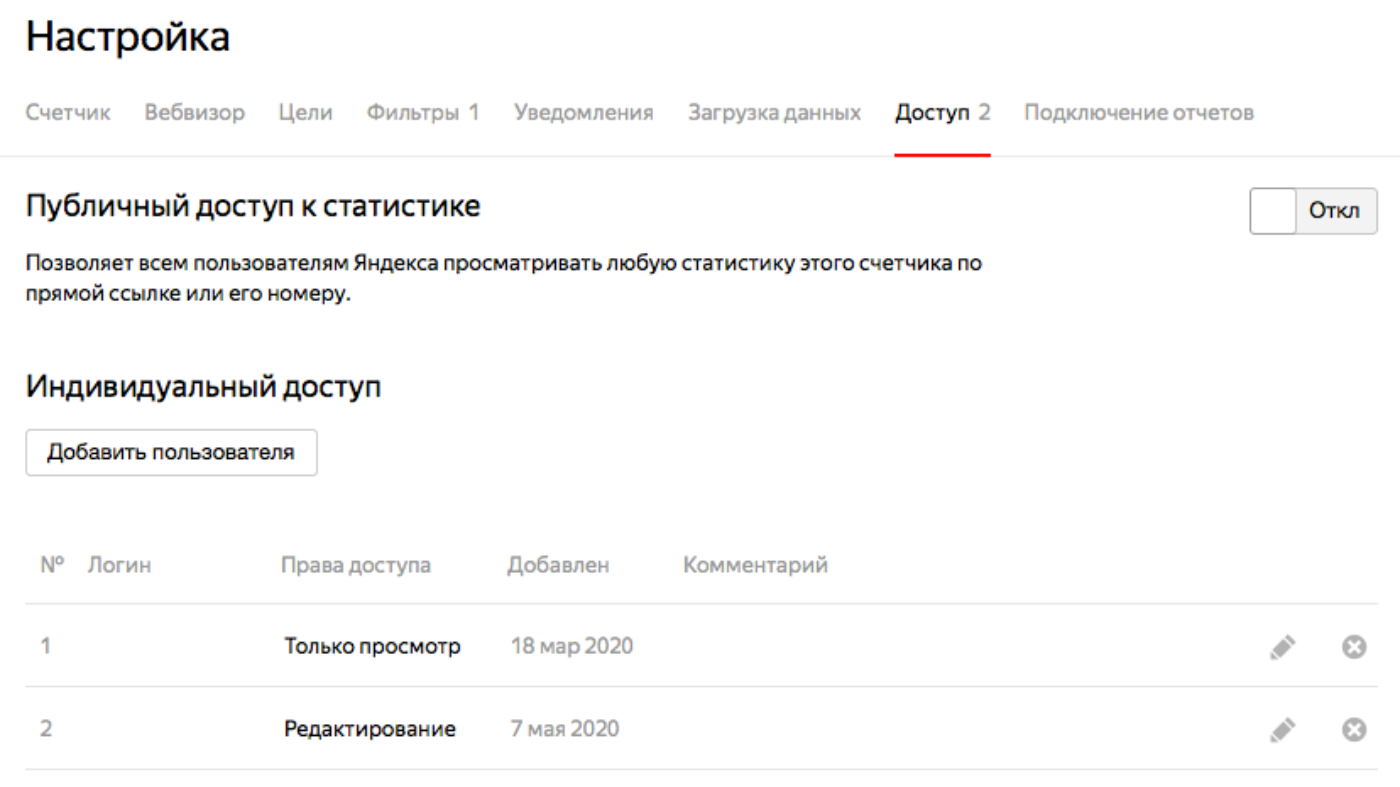
"Access" is another important point that will allow you to hide statistics and valuable data from "prying" eyes. First of all, disable public access. Then your competitors will not be able to view information on conversions, for which search queries the site is being promoted, etc.
If necessary, give specific people personal access. In Yandex.Metrica, it is divided into two levels: for the account and as a representative. In the first case, the user will be able to view data on a specific site, in the second, he will have access to the entire account and all resources associated with it.
Sort by Label
Labeling is relevant for owners of a large number of resources or for sites with subdomains (for example, a company has sites for different cities on subdomains).
The main resource and its branches are labeled (they are added independently, they are named arbitrarily). For each label, viewing summary data is available: total number of visits and views. This allows analysts to analyze the overall website traffic faster.
Yandex.Metrica and Google Analytics are one of the main tools that an analyst should use. They collect information about traffic sources, user behavior, conversions, etc. and generate conveniently readable reports. This article shows the basic settings of the counters - the initial stage of working with tools.