I used to be a team lead, and I was in charge of a couple of critic services. And if something went wrong in them, it stopped real business processes. For example, orders stopped going into assembly at the warehouse.
I recently became a Direction Lead and am now in charge of three teams instead of one. Each of them runs an IT system. I want to understand what is happening in every system and what can break.
In this article I’ll talk about
- what we monitor
- as we monitor
- and most importantly, what do we do with the results of these observations.
Lamoda has many systems. They are all being released, something is changing in them, something is happening with technology. And I want to have at least the illusion that we can easily localize the breakdown. I am constantly bombarded with alerts that I try to figure out. In order to get away from abstractions and move on to specifics, I will tell you the first example.
From Time to Time Something Explodes: Chronicles of a Fire
One warm summer morning without declaring war, as is usually the case, monitoring worked for us. We use Icinga as an alert. Alert said that we have 50 GB of hard drive left on the DBMS server. Most likely, 50 gigabytes is a drop in the ocean, and it will end very quickly. We decided to see how much free space was left. You need to understand that these are not virtual machines, but iron servers, and the base is under heavy load. There is a 1.5 terabyte SSD. Soon this memory will soon come to an end: it will last for 20-30 days. This is very little, you need to quickly solve the problem.
Then we additionally checked how much memory was actually consumed in 1-2 days. It turns out that 50 gigabytes is enough for about 5-7 days. After that, the service that works with this database will predictably end. We begin to think about the consequences: what we will urgently archive, what data we will delete. The Data analytics department has all the backups, so you can safely drop everything older than 2015.
We try to delete it and remember that MySQL will not work like that from half a kick. Deleted data is great, but the size of the file allocated for the table and for the DB does not change. MySQL then uses this place. That is, the problem has not been resolved, there is no more space.
Trying a different approach: migrating labels from fast expiring SSDs to slower ones. To do this, select the tablets that weigh a lot, but under a small load, and use Percona monitoring. We have moved the tables and are already thinking about moving the servers themselves. After the second move, the server takes up not 4, but 4 terabytes of SSD.
We put out this fire: we organized a move and, of course, fixed the monitoring. Now warning will be triggered not on 50 gigabytes, but on half a terabyte, and the critical monitoring value will be triggered on 50 gigabytes. But in reality, this is just a blanket covering the rear. It will last for a while. But if we allow a repetition of the situation without breaking the base into parts and not thinking about sharding, everything will end badly.
Suppose that we changed the server further. At some stage, it was necessary to restart the master. Probably, in this case there will be errors. In our case, the downtime was about 30 seconds. But requests are coming, nowhere to write, errors rained down, monitoring worked. We use the Prometheus monitoring system - and we see in it that the metric of 500 errors or the number of errors when creating an order has jumped. But we do not know the details: which order was not created, and things like that.
Further I will tell you how we work with monitoring in order not to get into such situations.
Monitoring review and clear description for customer support
We have several areas and indicators that we are observing. There are TVs everywhere in the office, on which there are many different technical and business labels, which, in addition to developers, are monitored by the support service.
In this article, I talk about how we have it, and add what we want to come to. This also applies to monitoring reviews. If we regularly took an inventory of our "property", then we could update everything that is outdated and fix it, preventing a repetition of the fakap. To do this, you need a clear list.
We have config-icings with alerts in the repository, where there are now 4678 lines. From this list, it is difficult to understand what each specific monitoring is talking about. Let's say our metric is called db_disc_space_left. The support service will not immediately understand what this is about. Something about free space, great.
We want to dig deeper. We look at the config of this monitoring and understand where it comes from.
pm_host: "{{ prometheus_server }}"
pm_query: ”mysql_ssd_space_left"
pm_warning: 50
pm_critical: 10 pm_nanok: 1
This metric has a name, its own limitations, when to include warning monitoring, an alert to report a critical situation. We use a metric naming convention. At the beginning of each metric there is a system name. Thanks to this, the area of responsibility becomes clear. If the person responsible for the system starts the metric, it’s immediately clear who to go to.
Alerts are poured into telegrams or slack. The support service is the first to respond to them 24/7. The guys look at what exactly exploded, if this is a normal situation. They have instructions:
- those that are being replaced,
- and instructions that are fixed in confluence on an ongoing basis. By the name of the exploded monitoring, you can find what it means. For the most critical, it is described what is broken, what are the consequences, who needs to be raised.
We also have shift shifts in teams responsible for key systems. Each team has someone who is constantly available. If something happened, they pick it up.
When the alert is triggered, the support team needs to quickly find out all the key information. It would be nice to have a link to the monitoring description attached to the error message. For example, so that there is such information:
- a description of this monitoring in understandable, relatively simple terms;
- the address where it is located;
- an explanation of what this metric is;
- consequences: how it will end if we do not correct the mistake;
- , , . , , . -, .
It would also be convenient to immediately see the traffic dynamics in the Prometheus interface.
I would like to make such descriptions for each monitoring. They will help to build a review and make adjustments. We are implementing this practice: the icing config already contains a link to confluence with this information. I have been working on one system for almost 4 years, there are basically no such descriptions for it. So now I am gathering knowledge together. Descriptions also solve the team’s lack of awareness.
We have instructions for most alerts, where it is written what leads to a certain business impact. This is why we must quickly sort out the situation. The criticality of possible incidents is determined by the support service together with the business.
Let me give you an example: if the monitoring of the memory consumption on the RabbitMQ server of the order processing service has worked, this means that the queue service may fall in a few hours or even minutes. And this, in turn, will stop many business processes. As a result, customers will unsuccessfully wait for orders, SMS / push notifications, status changes and much more.
Discussions of monitoring with the business often occur after serious incidents. If something is broken, we collect a commission with representatives of the direction, which was hooked by our release or incident. At the meeting, we analyze the reasons for the incident, how to make sure that it never recurs, what damage we suffered, how much money we lost and on what.
It happens that you need to connect a business to solve problems created for customers. There we discuss proactive actions: what kind of monitoring to start so that this does not happen again.
The support service monitors the values of metrics using a telegram bot. When a new monitoring appears, the support staff needs a simple tool that will let you know where it broke and what to do about it. The link to the description in the alert solves this problem.
I see the fakap as in reality: using Sentry for debriefing
It’s not enough just to find out about the error, I want to see the details. Our standard use case is as follows: rolled out the release and received alerts from the K8S stack. Thanks to monitoring, we look at the status of the pods: which versions of the application were rolled out, how the deployment ended, is everything good.
Then we look at the RMM, what we have with the base and with a load on it. For Grafana and boards, we look at the number of connections to Rabbit. He's cool, but he knows how to flow when the memory runs out. We monitor these things, and then we check the Sentry. It allows you to watch online how the next debacle unfolds with all the details. In this case, post-release monitoring reports what broke and how.
In PHP projects, we use a raven client, additionally enriching with data. Sentry aggregates it all nicely. And we see the dynamics for each fakap, how often it happens. And we also look at examples, which requests did not succeed, which extensions got out.
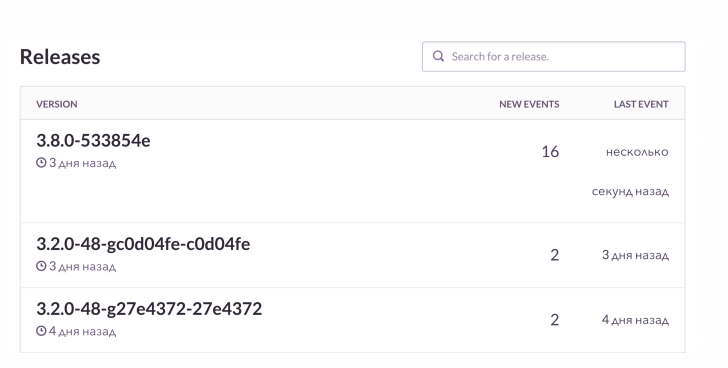
This is approximately how it looks. I see that on the next release there are more errors than usual. We will check what exactly is broken. And then, if necessary, we will get the failed orders in the context and fix them.
We have a cool thing - binding to Jira. This is a ticket-tracker: clicked a button, and a task error was created in Jira with a link to Sentry and a stack trace of this error. The task is marked with specific labels.
One of the developers brought a sensible initiative - “Clean project, clean Sentry”. During planning, every time we throw into the sprint at least 1-2 tasks created from Sentry. If something is broken in the system all the time, then Sentry is littered with millions of small stupid mistakes. We regularly clean them so that we don’t inadvertently miss the really serious ones.
Blazes for any reason: we get rid of monitoring, which everyone is hammered into
- Getting used to mistakes
If something is constantly blinking and looks broken, it gives the feeling of a false norm. The support service may be mistaken in thinking that the situation is adequate. And when something serious breaks, they will ignore it. Like in a fable about a boy shouting: “Wolves, wolves!”.
A classic case is our project that is responsible for order processing. It works with a warehouse automation system and transfers data there. This system is usually released at 7 am, after which we start monitoring. Everyone is used to it and scores, which is not very good. It would be wise to turn off these controls. For example, to link the release of a specific system and some alerts through Prometheus, just do not turn on unnecessary signaling.
- Monitoring does not consider business metrics
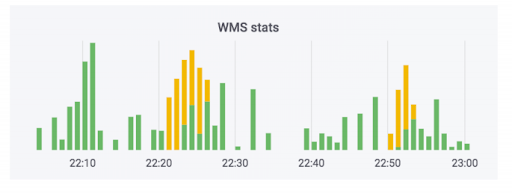
The order processing system transfers data to the warehouse. We have added monitors to this system. None of them shot, and it seems that everything is fine. The counter shows that the data is leaving. This case uses soap. In reality, the counter may look like this: the green part is incoming exchanges, the yellow part is outgoing.
We had a case when the data really did please, but curves. Orders were not paid, but they were marked as paid. That is, the buyer will be able to pick them up for free. It seems to be scary. But the opposite is more fun: a person comes to pick up a paid order, and he is asked to pay again because of an error in the system.
To avoid this situation, we observe not only the technology, but also the metrics of the business. We have a specific monitoring that monitors the number of orders that require payment upon receipt. Any major leaps in this metric will show if something went wrong.
Business performance monitoring is an obvious thing, but it is often overlooked when new services are released, including us. Everyone covers the new services with purely technical metrics related to disks, process, whatever. As an online store, we have a critical thing - the number of orders created. We know how many people usually buy adjusted for marketing campaigns. Therefore, we monitor this indicator during releases.
Another important thing: when a client repeatedly orders delivery to the same address, we do not torment him by communicating with the call center, but automatically confirm the order. System crash has a huge impact on the customer experience. We also monitor this metric, since releases of different systems can strongly influence it.
We are watching the real world: we care about a healthy sprint and our performance
In order for the business to keep track of different indicators, we filmed a small Real Time Dashboard system. It was originally made for a different purpose. The business has a plan for how many orders we want to sell on a specific day of the coming month. This system shows the compliance of plans and made in fact. For the schedule, she takes data from the production base, reads from there on the fly.
Once our replica fell apart. There was no monitoring, so we did not have time to find out about it. But the business saw that we were not fulfilling the plan for 10 conventional units of orders, and came running with comments. We began to understand the reasons. It turned out that irrelevant data is read from a broken replica. This is a case in which a business observes interesting indicators, and we help each other when problems arise.
I'll tell you about another monitoring of the real world, which has been in development for a long time and is constantly being tuned by each team. We have Jira Viewer - it allows you to watch the development process. The system is extremely simple: the Symfony PHP framework, which runs in Jira Api and picks up data on tasks, sprints, and so on, depending on what was given to the input. Jira Viewer regularly writes metrics related to teams and their projects to Prometeus. There they are monitored, alert, and from there displayed in Grafana. Thanks to this system, we follow Work in progress.
- We monitor how long a task has been in work from the moment in progress to rolling out into production. If the number is too large, theoretically this indicates a problem with the processes, team, task description, and so on. Task lifespan is an important metric, but not enough by itself.
- . , , . , .
- – ready for release, . - - , « ».
- : , . .
- . 400 150. , , .
- I monitored in my team the number of pull requests from developers outside working hours. Particularly after 8pm. And when the metric shoots out, this is an alarming sign: a person either does not have time for something, or invests too much effort and sooner or later will simply burn out.
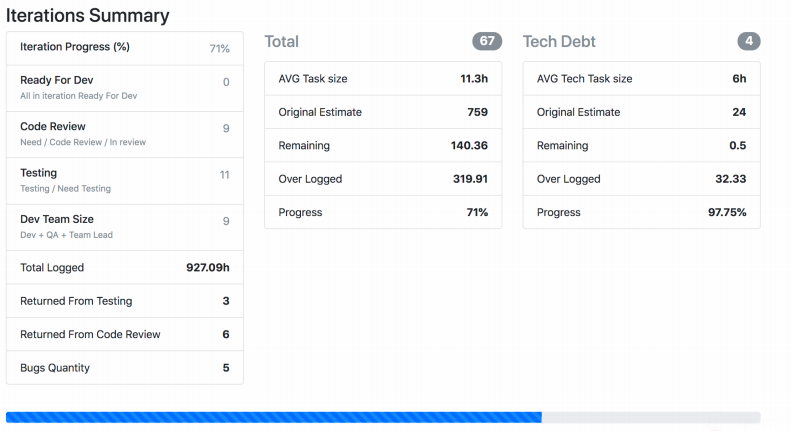
The screenshot shows how Jira Viewer outputs data. This is a page where there is summary information about the status of tasks from the sprint, how much each weighs, and the like. Such things also gather and fly to Prometheus.
Not only technical metrics: what we already monitor, what we can monitor and why all this is necessary
To put it all together, I suggest monitoring both technology and metrics related to processes, development, and business together. Technical metrics alone are not enough.
- , -, Grafana-. . , , .
- : , . , , crontab supervisor. . , , .
- – , , .
- : , - , . , .
- , . – Sentry . - , . - , . Sentry , , .
- . , , .
- , . , - , - . .